

Abstract
The objective of this study was to measure the pressure-induced deformation response of the human lamina cribrosa (LC) and analyze for variations with age and anatomical region. The posterior scleral cup of 8 eyes from 6 human donors was mounted onto a custom inflation chamber. A laser-scanning microscope was used for second harmonic generation (SHG), imaging the collagen structure in the posterior volume of the LC at pressures from 5 mmHg to 45 mmHg. The SHG volumes were analyzed by the Fast-Fourier Iterative Digital Volume Correlation (DVC) algorithm for the three dimensional (3D) displacement field. The components of the Green-Lagrange strain tensor and the in-plane principal and maximum shear strains were evaluated from the DVC displacement field for the central and peripheral regions of the LC and the nasal, temporal, inferior, and superior quadrants surrounding the central retinal artery and vein. Among the major findings were that older age was associated with lower strains, the maximum shear strain was larger in the peripheral than central region, and the maximum principal strain was lower in the nasal quadrant. The elliptical shape of the LC was also predictive of the biaxial strain ratio. Age-related and structure-related variations in the pressure-induced strains of the LC may contribute to the susceptibility and severity of optic nerve damage in glaucoma, and regional variations may explain the progression of axonal damage and tissue remodeling observed in the LC in glaucoma.
Keywords: glaucoma, lamina cribrosa, inflation test, digital volume correlation, second harmonic generation
1. Introduction
The human lamina cribrosa (LC) is a connective tissue structure in the optic nerve head that forms a part of the eye-wall separating the intraocular cavity and the intraocular pressure from the retro-ocular space and the intracranial pressure. The LC serves to mechanically support the axons of the retinal ganglion cells as they exit the eye, the lamina capillaries that nourish the neural and cellular tissues of the optic nerve head, and the central retinal artery and vein entering and exiting the eye through the optic nerve head. Glaucoma is characterized by the progressive dysfunction and death of the retinal ganglion cells and remodeling of the connective tissue structure at the LC [1]. In glaucoma, defects in the visual field develop in the midperiphery in the early stages of the disease and can grow into significant central and peripheral vision loss in later stages [2, 3]. Glaucomatous optic axon damage occurs in all regions of the optic disk, and regional variations in damage depend on the stage of the disease [1, 4–6]. Jonas et al. [4] showed that damage to the neuroretinal rim in moderate glaucoma occurred mainly in the inferotemporal and superotemporal regions [5], while the remaining portions of the neuroretinal rim in advanced glaucoma was found in the nasal region [5]. Quigley and Addicks [6] performed histological evaluations of optic nerve axons at the LC and found that axon loss occurred in all regions but was greater in the superior and inferior regions of the LC. Furthermore, the pattern of axon loss corresponded to regional differences the structure of the LC, which contained larger pores and thinner beams in the superior and inferior regions [7].
The intraocular pressure (IOP) is strongly associated with the prevalence and severity of optic nerve axon damage in open angle glaucoma [8–11]. Higher IOP is associated with increased prevalence [12–14] and lowering IOP slows the progression of the disease [15, 16]. Higher IOP is also associated with disruption of axonal transport [17–22], changes in gene expression and signaling, and dysfunction of the neurons and glia [23, 24]. However, there is a wide overlap in the distribution of IOP among those with and without glaucoma. Nearly half of patients with open angle glaucoma (OAG) have normal IOP, lower than 21 mmHg, and the majority of ocular hypertensives do not develop glaucoma [10, 25–27]. The stress and strain state of the connective and neural tissues of the optic nerve head are determined by the level of IOP and the mechanical behavior of the LC and the surrounding sclera [28–32]. Variations in the structure and mechanical properties of the LC and sclera may explain why some patients with low IOP develop glaucoma, while some patients with high IOP do not, and why in a few patients their glaucoma continues to progress after IOP lowering treatment.
The objective of this study was to measure the deformation response of the human LC to controlled pressurization and analyze for variations with age, LC shape, and anatomical region. Mechanical characterization of the LC is challenging because of the complex 3D geometry, small size, and inaccessibility of the tissue. Previous studies of LC deformation measured the displacements of landmarks in the LC [33–35] and adjacent tissue structures [36], and changes in the anatomical geometry of the LC using light microscopy [37] nonlinear optical microscopy [38], static histomorphometry [39, 40], and spectral domain optical coherence tomography (SD-OCT) [41–43]. Albon et al. [38] measured the volume strain and perimeter strain of the normal human LC from second harmonic generation (SHG) imaging of collagen viewed perpendicular and parallel to the optic nerve axis, and found a stiffer response with age. Zeimer et al. [35] measured a stiffer displacement response of the LC in post-mortem human glaucoma eyes than in non-glaucoma eyes using laser Doppler velocimetry, while Belleza et al. [39] measured a more compliant response in early glaucoma monkey eyes using static histomorphometry.
Recent advances in volume imaging and post-processing methods have made possible full-field deformation mapping of the pressure-induced deformation in the optic nerve head. Sigal et al. [44] applied 2D digital image correlation to analyze the anterior-posterior projections of SHG z-stacks of the human LC with ex vivo inflation and reported a highly heterogeneous strain field with localized regions of large inplane strains. Girard et al. [45, 46] applied digital volume correlation (DVC) to analyze the deformation of in vivo SD-OCT scans of the visible anterior volume of the human LC and peripapillary sclera after IOP-lowering surgery. Results from 8 glaucoma patients showed that lowering IOP decreased the strain and displacement magnitudes in all tissues of the optic nerve head for all patients. Coudrillier et al. developed a phase-contrast micro-computed tomography (micro-CT) method that used DVC to measure the deformation response of the LC to inflation. The authors applied the method to pig eyes and reported that stiffening of the peripapillary sclera with glutaraldehyde increased the maximum principal strain in the LC [47].
We developed an ex vivo inflation test that uses a laser scanning microscope to acquire the backscattered SHG signal of the posterior volume of the human LC under an applied pressure, and the Fast Iterative DVC algorithm of Bar Kochba et al. [48] to analyze the SHG volumes and calculate the 3D displacement field. In DVC, the deformation field is obtained by correlating the image intensity distribution within subsets of voxels between a reference (undeformed) and deformed image volume [49, 50]. First introduced by Bay et al. [51], DVC has been applied to a wide variety of imaging modalities to map the deformation of heterogeneous materials, including bone [51,52], wood [53], and 3D cell cultures [54,55], in addition to the more recent applications to the LC. The Fast Iterative DVC is a computationally efficient and high resolution DVC method that performs subset matching in the Fourier domain [48, 56] and iteratively refines the subset size and spacing to resolve sharp gradients in the displacement field. We developed a method to compute the strain field from the gradient of the DVC displacement field and analyzed the strain components and strain invariants for correlations with age and the shape of the LC opening and for variations with the anatomical regions of the optic nerve head.
2. Methods
2.1. Specimen preparation
Eight human eyes from 6 donors (ages 26–93) were received from the National Disease Research Interchange (NDRI) 12–24 hours post-mortem. The group included eyes from 3 male and 3 female donors with a mean age of 67.0±26.6 years and no history of glaucoma (Table 1). The eyes were shipped wrapped in wet gauze in a closed container placed on ice. Upon receipt, the eyes were stored at 4°C, and all testing was conducted within 48 hours post-mortem.
Table 1:
Human donor sclera and ONH subjected to inflation testing.
| Eye ID | Sex | Age (yr) | Race | Right/Left Eye |
|---|---|---|---|---|
| FC93 | Female | 93 | Caucasian | Left |
| FC93 | Female | 93 | Caucasian | Right |
| FC49 | Female | 49 | Caucasian | Right |
| FC26 | Female | 26 | Caucasian | Right |
| MC88 | Male | 88 | Caucasian | Left |
| MC88 | Male | 88 | Caucasian | Rght |
| MC57 | Male | 57 | Caucasian | Right |
| MH42 | Male | 42 | Hispanic | Right |
The extraocular tissues were removed from the eye with fine scissors and the optic nerve was cut flush with a razor blade to the sclera. The depth of this cut varied among specimens (Fig. 1a), and multiple thin cuts were often required to remove the post-LC myelinated optic nerve to reveal the trabecular structure of the LC, which was visualized under a dissecting microscope after each cut.
Figure 1:
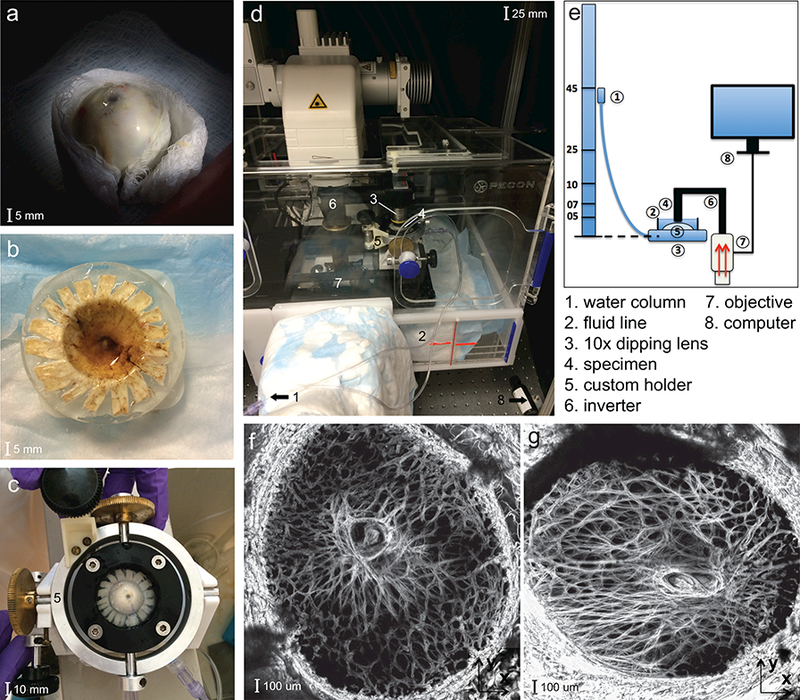
Inflation experimental set-up of the human LC showing: a) the optic nerve head cut flush to the sclera, b) the posterior scleral cup glued to a plastic ring, c) the custom inflation holder with tilt correction about 2 axes; d) the Zeiss LSM 710 microscope with the specimen placed underneath an inverted objective; e) schematic of the experimental setup; f) and the maximum projection SHG volume images of the LC of the MH42 g) and FC26 specimens, showing a large variation in shape.
The eye was glued to a polycarbonate ring, machined to fit the curvature of the globe, 2–5 mm posterior to the equator using cyanoacrylate (Permabond 910, Electron Microscopy Sciences, Hatfield PA). Three ring sizes were manufactured to account for variation in the globe diameter. The ONH was centered within the ring, and the exposed posterior sclera and LC were kept hydrated with 1M phosphate buffered saline (PBS) as the adhesive dried. The cornea, anterior sclera, and intraocular components, including the retina and choroid, were removed with a scalpel leaving the posterior scleral shell. The anterior scleral edge was scored using a razor blade and the edges glued flat to the back of the polycarbonate ring to provide a more rigid seal (Fig. 1b).
2.2. SHG imaging
The specimen was mounted onto a custom inflation chamber with tilt-correcting gears about two or thogonal in-plane axes [57]. The pressure lines were flushed of air and filled with PBS and the specimen inflated briefly to ensure there were no leaks prior to testing (Fig. 1c). The inflation chamber was placed on the stage of a Zeiss laser-scanning microscope (LSM 710 NLO, Oberkochen, Germany) (Fig. 1d) and the exposed posterior surface was covered with PBS to maintain hydration for the duration of the experiment. The objective was centered on the central retinal artery and vein (CRAV), the posterior LC surface was aligned parallel with the imaging plane using the two tilt-correcting gears, and the nasal-temporal and inferior-superior axes of the specimen were aligned with the X and Y directions of the image plane. The Z direction corresponded to the anterior-posterior direction of the specimen (Fig 1f-g).
The pressure was controlled by the height of a water column connected to the inflation chamber through a polyethylene line (Fig. 1e). The specimen was pressurized to a baseline 5 mmHg and allowed to equilibrate for 30 minutes before imaging. A distinct landmark in the LC structure was selected, imaged for reference, and Z parameters set for image acquisition. Duplicate 2×2 tiled z-stacks were acquired to 300 μm depth from the posterior LC surface at 3 μm intervals using the Zeiss NLO microscope with a coherent Chameleon Ultra II laser tuned to 780 nm [58], a 390–410 nm band pass filter, and 10× 0.45 NA Apochromat objective. The laser power (10–20%) and gain (500–600) were adjusted to minimize the number of over-saturated pixels in the imaged LC volume. The zoom factor was varied between 0.6 and 0.8 to fit the LC and part of the peripapillary sclera into the 2×2 tiled image, and the tiles were imaged at 512×512 pixel resolution (Fig. 1f-g). Imaging began at the lowest visible depth towards the choroid where the LC beams first came into focus (300 μm) below the posterior surface of the specimen. Tiles were acquired moving from left to right and top to bottom, starting with the upper-left corner. To minimize errors from tissue creep during image acquisition, the tiled z-stacks were acquired with a short pixel dwell time of 5 μs and no line averaging. These setting produced a 3–5 minute imaging time for the tiled z-stack.
2.3. Loading regimen
The pressure was raised from the baseline 5 mmHg to 10 mmHg, then 45 mmHg. For 2 specimens we imaged the deforming specimens at additional intermediate pressures of 7.5 mmHg and 25 mmHg to characterize the nonlinearity of the pressure-strain response. The specimen was allowed to equilibrate for 30 minutes after each pressure increase to avoid excessive imaging reconstruction errors from creep. The focus was readjusted to relocate the distinct material landmark to account for large Z translations experienced by the LC and the imaging protocol was repeated. The Z motion caused by refocusing was recorded and added back to the DVC displacement measurements as a rigid body translation.
2.4. Image post-processing
The 2×2 tiled images were stitched with a 15% overlap using the Zeiss software, Zen 2015, (Oberkochen, Germany) and the data was exported as multistage TIFF files for DVC correlation. The final size of the images was 947×947 pixels after stitching and the resolution varied from 2–2.5 μ m/pixel based on the zoom factor, which was adjusted for the LC size. The SHG stacks were post-processed first by deconvolution using a theoretical point spread function in Huygens Essentials (SVI, Hilversum, NL). This treatment removed noise and reduced blur. The images were treated next by the contrast-limited adaptive piecewise histogram equalization (CLAHE) algorithm in FIJI [59] to remove the effect of large variations in image intensity and improve the image contrast. Histogram equalization enhances the intensity of noisy speckles in the image volumes and these must be reduced prior to contrast enhancement. For the SHG images, we found that the Huygens deconvolution algorithm was sufficient in removing the image noise prior to contrast enhancement and the application of both methods resulted in significant improvement in the image quality and subsequent DVC displacement accuracy. Deconvolution sharpened the collagen features and CLAHE revealed features that were too dark to be visible in the original SHG images (Fig. 2).
Figure 2:
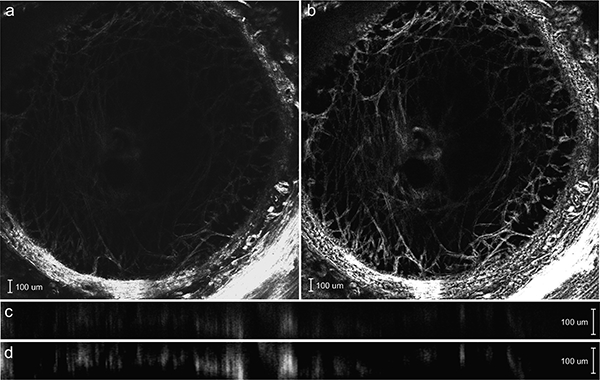
SHG image of an anterior z-slice of the MC57 specimen a) before and b) after deconvolution and contrast enhancement. The Y-Z cross-section of the SHG image c) before and (d) after deconvolution and contrast enhancement. The image post-processing reveals the collagen beam structure that was previously too dim to view and sharpens the collagen structure.
2.5. Digital volume correlation
The enhanced image sets were imported into Matlab R2015b (Mathworks, Natick, MA, US) and reconstructed into a three-dimensional matrix of 8-bit intensity values. The Fast-Iterative DVC algorithm developed by Bar-Kochba et al [48] was used to analyze the image sets for the displacement field. In DVC, a series of images are acquired at different pressures. The images are divided into subvolumes surrounding points defined in the reference image at the baseline pressure (material points). These are compared to subvolumes at subsequent pressures for displacement tracking. Volumes were correlated incrementally between 5 and 10 mmHg and 10 and 45 mmHg to avoid decorrelation errors from large deformations. The displacement field for inflation from 5–45 mmHg was obtained from the sum of the displacement field from 5–10mmHg and from 10–45mmHg. A starting subset size of 128×128×64 pixels and a coarse calculation spacing of 32×32×16 pixels was selected for the first iteration and the spacing and size was refined in subsequent iterations to improve the spatial resolution of the displacement field, particularly in regions with large displacement gradients. We used four iterations with a final calculation spacing of 4×4×2 pixels and subset size of 64×64×16 pixels, which was larger than the typical feature size of the LC collagen structure (e.g. collagen beams and pores) to avoid decorrelation. The cross-correlation coefficient and components of the displacement field were exported for subsequent analysis of DVC error and uncertainty (Sec. 2.7).
The as-processed DVC displacement field typically contained regions of high correlation error. These were dark and over-saturated regions with low contrast. For example, the peripapillary sclera consistently appeared as an over-saturated region in the SHG images because it has a higher density of collagen than the LC. The more anterior z-slices of the LC appeared dark in the SHG images because of light attenuation through the LC. The more posterior z-slices also appeared dark because they contained the cut LC surface and had a sparser SHG signal. Regions of high error were excluded in subsequent strain analyses by setting a lower threshold value of 0.001 for the cross-correlation coefficient and an upper and lower threshold value of ±4 μm (1.5–2.0 pixels) for the DVC displacement absolute error (Sec. 2.7). The remaining volume, which spanned 150–200 μm in depth, was used for strain calculation and statistical analysis. Finally, a 3D Gaussian filter was applied to the displacement field to remove isolated points with sharp spikes in the displacement components. The details of the Gaussian filter are described in Appendix A.
2.6. Strain calculation
The components of Green-Lagrange strain tensor were calculated for the image volume from the DVC displacement components UX, UY, and UZ, at each pressure, for a grid of material points evenly spaced every 4 pixels along X and Y and by 2 pixels along Z. The deformation gradient and Green-Lagrange strain tensor at each grid point was calculated as,
where I is the identity tensor. The partial derivatives of the displacement components in eq. (1) were calculated by fitting a sixth-order polynomial function across X or Y and a linear function in Z and evaluating the derivative analytically. In preliminary studies, using higher order polynomials up to a 12th order to interpolate along X and Y did not significantly alter the results (Supplemental Materials, Sec. S3). In contrast, using a higher order interpolation along Z resulted in large fluctuations in EZZ along the thickness caused by the larger correlation error along Z than along X or Y (Sec. 2.7), which we attributed to the lower resolution and blurring in Z. The maximum principal strain and the maximum shear strain in the plane of the LC (X-Y plane) were calculated as,
For a given material point, the maximum principal strain and maximum shear strain denote the largest elongation of a material line and largest angle distortion between 2 material lines, respectively, over all orientations in the X—Y plane.
2.7. DVC error measurements
A detailed description of the methods and results of the DVC error analysis is provided in the Supplemental Materials (Sec. S1.1-S1.2). Below, we briefly summarize the methods and main results. To calculate the baseline positional error, DVC was applied to correlate the duplicate z-stacks acquired at 45 mmHg for each specimen. Because the two image volumes were acquired back-to-back at nominally the same conditions, the displacement field should be zero everywhere, and any non-zero displacements obtained by DVC provide an estimate of the baseline error in the volumes. The absolute baseline error, uncertainty, and bias was calculated at 45 mmHg for all eyes (Sec. S1.1) and the average over all 8 specimens was found to be less than 1/4 pixel in all 3 directions (Table S1).
The DVC displacement correlation error was also evaluated by numerically applying a translation and uniform triaxial strain field to one of the duplicate z-stacks at 5 mmHg and correlating with the other undeformed z-stack (Sec. S1.2). For all specimens, the average and standard deviation of the DVC displacement error were smaller than 1/2 a pixel in the in-plane (X,Y) directions and less than a pixel out-of-plane (Table S2). The average and standard deviation of the absolute strain error was less than 0.3% strain for the in-plane strain components (EXX, EYY, EXY) for all specimens; however, the average absolute strain error for the out-of-plane strain EZZ was found to be significantly higher at 3%−4% strain (Table S3). The larger error in the out-of-plane direction is likely caused by the decreased resolution and blurring in Z which resulted in high error in the displacement gradient calculation, ∂UZ/∂Z, even though the error for UZ was on average less than a pixel. Because of the large errors in EZZ, analyses in subsequent sections focused on the in-plane strain components and magnitudes, which exhibited low DVC displacement and strain errors over a significant portion of the imaged volume.
2.8. Comparison to 2D-DIC
A detailed description of the methods and results of the comparison between the results of the DVC and 2D digital image correlation (2D-DIC) analysis of the in-plane deformation is provided in the Supplemental Materials (Sec. S1.3). Below, we briefly summarize the methods and main results. The DVC in-plane displacement components were compared to those obtained from 2D-DIC of the maximum intensity projection of the SHG z-stacks. The 2D projections were imported into Vic-2D (Correlated Solutions, Irmo, SC US) to determine the displacement field for inflation from 5–10 mmHg and from 5–45 mmHg. The in-plane displacement fields for the pressure change of 5 to 45 mmHg differed on average by about a pixel; however, we found that strains computed from the 2D-DIC displacements differed by 1%−3% strain from those calculated from the DVC displacements (Tables S4-S5). The absolute error was largest for the shear strain EXY. The discrepancies may be caused by the fact that the 2D strain calculations exclude the effects of the out-of-plane displacement on the in-plane strains. In addition, distortion of the SHG signal from out-of-plane motion can increase the 2D-DIC correlation error. [60] Thus, while the UX and UY displacement components from DVC and 2D-DIC show good agreement, significant discrepancies were found for the in-plane strains, particularly for the EXY shear strains.
2.9. Statistical methods
To examine the regional variation in the pressure-induced strain response, the LC was divided into 9 regions centered about the CRAV (Fig. 3). The regions were defined by first separating the CRAV (r < 200μm), central (200μm< r < 550μm), and peripheral (r > 550μm) regions. The central and peripheral regions were further divided into 4 quadrants, superior (S), inferior (I), temporal (T) and nasal (N), using 45° and 135° bisectors.
Figure 3:
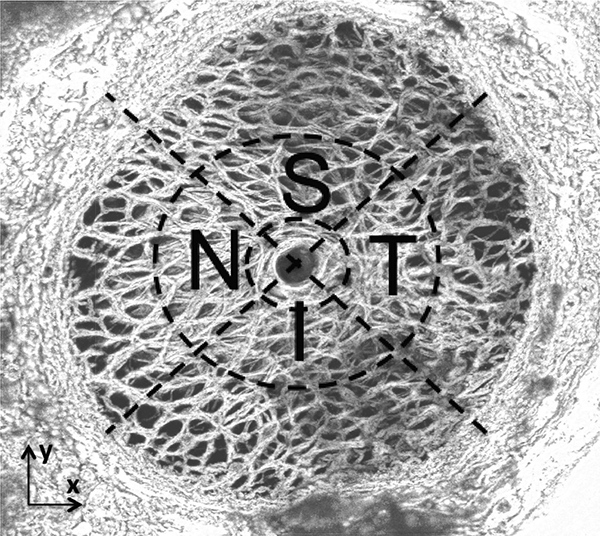
Quadrant and radial LC divisions for statistical analysis of the SHG signal of FC93 LE. The LC was divided into 9 regions centered about the CRAV. The regions were defined by first separating the CRAV (r < 200μm), central (200μm<r < 550μm), and peripheral (r > 550μm) regions. The central and peripheral regions were further divided into 4 quadrants, superior (S), inferior (I), temporal (T) and nasal (N), using 45° and 135° bisectors.
Multivariable, linear mixed regression models were used to compare: 1) the mean difference in the strain outcomes between these regions, 2) the effects of age, and 3) differences related to LC shape, defined as the ratio between the long and short axes of the LC opening. The LC opening was determined by importing the maximum intensity projection into FIJI [59] and manually picking points separating the LC from the denser peripapillary sclera, which appears over-saturated in the SHG images. An ellipse was fit to the points using the Matlab function fit_ellipse (Ohad Gal, 2003) to calculate the major (long) and minor (short) axes of the ellipse. The interactions between region, age, and LC shape were not examined in the multivariable model because of the small number of specimens. Strain outcomes from all 8 specimens were used in the statistical analysis, except for comparisons involving the central and peripheral regions. For two specimens, the left and right eyes of MC88, a significant portion of peripheral region was dark and failed to correlate (see Fig. S26 in the Supplemental Materials). The outcomes from these 2 specimens were excluded from statistical analysis comparing between the peripheral and central regions.
The linear mixed models take into account the repeated measurements within individual eyes and the clustering of two eyes from the same donor given sufficient data. After examining Spearman’s correlation and Akaike’s Information Criterion (AIC) for several plausible correlation structures for regional variables with more than 2 categories, repeat measurements from different regions within the LC were assumed to have an exchangeable correlation structure for all regional variables. For all models, least squares means were used to estimate mean strain, and the Tukey-Kramer method was used to adjust pairwise significance levels for multiple comparisons. Comparisons were considered significant if the p-value was less than 0.05. The statistical analyses were performed using the software SAS (version 9.2, SAS Institute Inc., Cary, NC).
2.10. LC thickness measurements
For the left and right eyes of FC93, the inflation-tested specimen was removed from the holder and fixed in 4% paraformaldehyde. A 4 × 4 mm square containing the LC and peripapillary sclera, centered about the LC, was removed from the posterior sclera and a portion of the anterior surface of the sclera was glued using cyanoacrylate to the cutting block of a Vibratome 1500 (Energy Beam Sciences, 11 Bowles Rd. Agawam, MA) without flattening the specimen. The block was immersed in a PBS bath. The Vibratome was used to cut 75 μm thick sections transverse to the optic nerve axis. The sections were lifted out of the bath onto glass slides and sealed under cover-slips for imaging. The slides were oriented under the microscope with the superior direction aligned with positive Y and temporal direction with positive X axes. Each section was imaged using backscattered SHG using the same settings as the inflation experiments (Sec. 2.2). The image volume for each section was rotated and translated within FIJI [59] to align with the others. The thickness of the LC was estimated by marking the Z-position in the image stacks where the LC beams first appeared in the most posterior sections and where they ended in successively anterior sections. A cubic spline surface was fit to the marked positions using the matlab fit function for the top and bottom of the LC, and thicknesses were calculated for a grid of points spaced every 10 μm in the plane by subtracting the difference in Z-position between the surfaces. The average thickness and standard deviation were calculated for the four quadrants of the LC defined in Fig. 3.
3. Results
3.1. The displacement and strain response under pressure
Figure 4 shows contour plots of the thickness-averaged displacement components, Green-Lagrange strain components, in-plane maximum principal strain, and in-plane maximum shear strain for the specimen FC93 in response to a pressure increase from 5–45 mmHg. The maximum-intensity projection of the SHG z-stack is overlaid on the contour plots for illustrative purposes. Plots of the displacement and strain fields for all specimens are included in Fig. S27-S34 in the Supplemental Material. The LC undergoes in-plane biaxial stretch (Fig. 4a, b) and significant posterior displacement, UZ, that for all specimens was larger than the in-plane displacement components UX and UY. The posterior displacement of the LC varied between specimens from 300–800 μm at 45 mmHg. However, the variation within each specimen was on average only 50 μm, which showed that the majority of the posterior displacement was caused by the inflation response of the posterior sclera. Most specimens exhibited regions that bulged posteriorly (Fig. 4c-d) resulting in large in-plane strains EXX and EYY and maximum principal strain E1. This occurred for the FC93 specimen in the peripheral inferior and peripheral superior regions (Fig. 4b,c, k). The shear strain components were on average an order of magnitude smaller than EXX and EYY for all specimens, and all strain components, including the shear strains, showed large variation in the X — Y plane. In contrast, all strain components showed little variation through Z (Sec. S3, M1-M5). The in-plane strain components EXX and EYY increased nonlinearly with the pressure (Fig. 5) in a J-shaped curve typical of soft collagenous tissues, and stiffened significantly with pressure at 10 mmHg.
Figure 4:

The full-field deformation response for inflation from 5–45 mmHg for the left eye of FC93 showing the thickness-averaged: a) UX, b)EXX, c)EYY, d)UY, e)EXY,f)EZZ, g)UZ, h)EXZ, i)EYZ, j) the UZ displacement surface contour, k) E1 maximum principal strain, and l) Гmax maximum shear strain.
Figure 5:
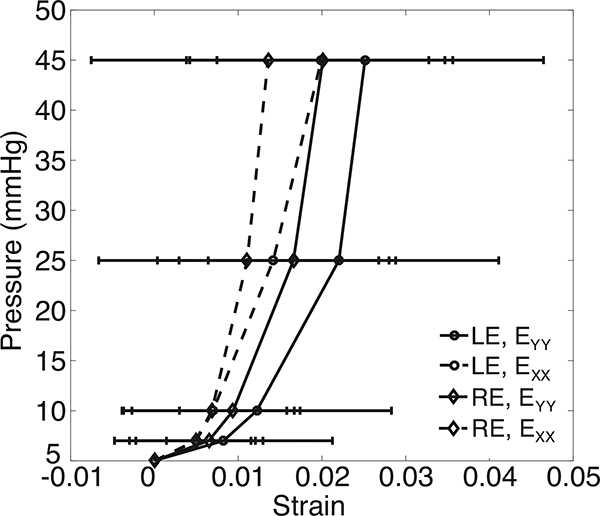
The pressure-strain response for the specimen-averaged EXX and EYY for the right and left eye of FC93. The error bars indicate ±1 standard deviation.
The average in-plane strain components were calculated for the 8 specimens. A multivariable mixed linear regression model was applied to compare EXX, EYY, and EXY and analyze for the effects of age and LC shape, as described in Sec. 2.9, accounting for repeated measures in each specimen and for the left and right eyes from the same donors (Table 2). The LC shape was quantified by the ratio of the major to the minor axis of the ellipse fit to the LC opening and treated as a continuous variable in the mixed linear model. Older age was predictive of smaller in-plane strains (p = 0.0004 for 10mmHg and p = 0.002 for 45 mmHg) and a more elliptical shape was predictive of larger in-plane strains (p = 0.003 for 10mmHg and p = 0.02 for 45 mmHg, n = 8).
Table 2:
Results of the multivariable mixed linear model comparing the in-plane strain components and variations with age and LC shape (n 8). The in-plane strain components EXX and EYY were significantly different then EXY, decreased significantly with age, and increased significantly with a more elliptical LC shape.
| 10 mmHg | 45 mmHg | |||
|---|---|---|---|---|
| Variable | Estimate (95% CI) | p-values | Estimate (95 % CI) | p-values |
| Age, years (%str ain/year) |
−0.017 (−0.025, −0.009) | 0.0004 | −0.021 (−0.035, −0.006) | 0.01 |
| Ratio of long and short axis of LC shape (%strain/axis ratio) |
6.55 (2.66, 10.44) | 0.003 | 8.04 (0.02, 16.05) | 0.05 |
| (%strain difference from reference, EXY) | ||||
| EXY | 1.864(1.193,2.534) | 3.484 (2.541, 4.427) | ||
| EXX | 1.496 (0.826,2.167) | 2.688 (1.745, 3.631) | ||
| EXY (reference) | 0 | 0 | ||
At 45 mmHg, the EYY (3.3%±1.3%) was larger than EXX (2.5%±1.4%) (Fig. 6). Moreover, the shear strain EXY (−0.21%±0.22%) was significantly smaller than both EXX (p < 0.0001) and EYY (Fig. 6, p < 0.0001, n = 8). This meant that the LC on average stretched more along the inferior-superior direction than along the nasal-temporal direction and experienced little shear distortion from its original shape. The long (major) axis of the LC was aligned along the inferior-superior (Y) direction for all but the FC26 specimen (Fig. 1g and Table S6 in the Supplemental Material), and a multivariable mixed linear regression model was applied to compare the strain along the long and short axes of the LC opening (Table 3). For each specimen, the strain along the long direction EMM was either EXX or EYY depending on whether the long axis was aligned with X or Y. The strain along the long axis EMM (3.4%±1.4% ) was significantly larger than along the short axis EPP (2.3%±1.1%) (p = 0.004 for 10mmHg and p = 0.003 for 45 mmHg, n = 8, Fig. 7, Table 3).
Figure 6:
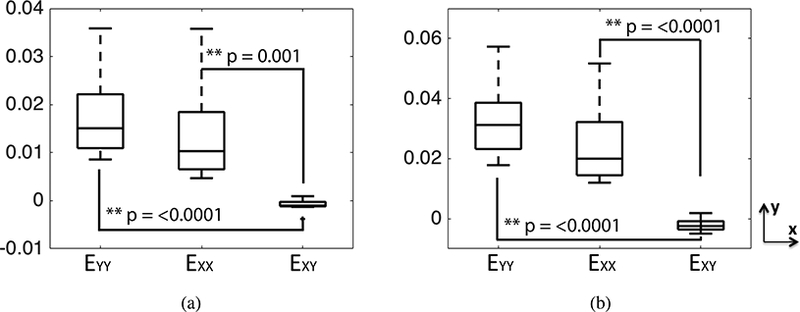
Comparison of the in-plane strain components EXX, EYY, and EXY at: a) 10 mmHg and b) 45 mmHg. The p-values were calculated in a post-hoc pairwise analysis of the multivariable mixed linear model. The superscript ** indicates p < 0.01.
Table 3:
Results of the multivariable mixed linear model comparing the strains in the longer and shorter axes of the LC shape (n = 8). The in-plane tensile strain along the long axis was larger than along the shorter axis. The strains decreased with age and were larger for more elliptical LC shape.
| 10 mmHg | 45 mmHg | |||
|---|---|---|---|---|
| Variable | Estimate (95% CI) | p-values | Estimate (95% CI) | p-values |
| Age, years (%strain/year) |
−0.026 (−0.039, −0.012) | 0.002 | −0.032 (−0.056, −0.007) | 0.02 |
| Ratio of long and short axes of the LC (%strain/axis ratio) |
9.08 (2.88, 15.28) | 0.01 | 12.37 (−0.52, 25.26) | 0.06 |
| In-Plane Component (%strain difference from reference, EPP) |
0.004 | 0.003 | ||
| EMM (longer) | 0.637 (0.267, 1.007) | 1.049 (0.484, 1.615) | ||
| EPP (shorter, reference) | 0 | 0 | ||
Figure 7:
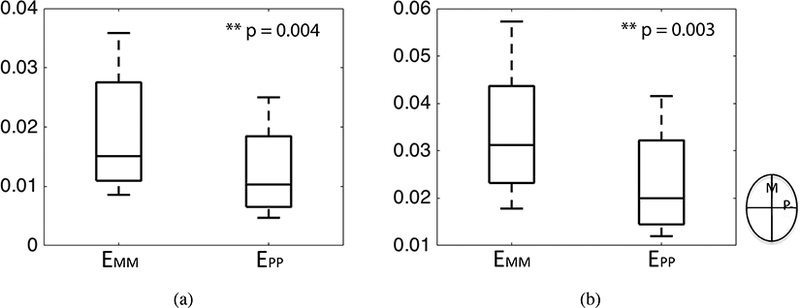
Comparison of the mean strain components EMM and EPP along the long and short directions of the LC for a) 10 mmHg and b) 45 mmHg. The p-values were calculated from a post-hoc analysis of the multivariable model. The superscript ** indicates p < 0.01.
3.2. Regional Variations
3.2.1. Quadrant variation in LC strains
We calculated the average in-plane maximum principal strain and maximum shear strain from eqs. (2) for the four quadrants in the full LC and in the central 200μm< r < 550μm region surrounding the CRAV, and applied a multivariable mixed linear regression model to analyze for variations with quadrant, age and LC shape. In the central region surrounding the CRAV, the maximum principal strain varied significantly among the different quadrants (p = 0.004 for 10 mmHg and p = 0.001 for 45 mmHg, Table 4). At 45 mmHg, the maximum principal strain was largest in the inferior quadrant followed closely by the temporal quadrant, and were lowest in the nasal and superior quadrants (Fig. 8). A post-hoc pairwise comparison (Fig. 8a) showed that the maximum principal strain in the inferior quadrant was significantly larger than in the superior quadrant (p = 0.002 for 45 mmHg, n = 8) and nasal quadrant (p = 0.003 for 45 mmHg, n = 8). The maximum principal strain in the temporal quadrant was also larger than in the superior (p = 0.10 for 45 mmHg, n = 8) and nasal (p = 0.11 for 45 mmHg, n = 8) quadrants but the comparisons were not statistically significant. The same trend were observed for 10 mmHg, but with lower statistical significance (Fig. 8a). The maximum shear strain in the central region did not vary significantly among the four quadrants (p > 0.1, n = 8).
Table 4:
Results of the multivariable mixed linear model for variations in the maximum principal strain in the central region with quadrant, age, and LC shape (n = 8). The maximum principal strain in the central region was statistically different among quadrants, and older age was nearly significantly associated with smaller strain.
| 10 mmHg | 45 mmHg | |||
|---|---|---|---|---|
| Variable | Estimate (95% CI) | p-values | Estimate (95% CI) | p-values |
| Age, years (%strain/year) | −0.029 (−0.064, 0.006) | 0.10 | −0.039 (−0.085, 0.008) | 0.10 |
| Ratio of length of LC axes Longer divided by shorter %strain/axis ratio) | 2.27 (−16.28,20.82) | 0.80 | −5.52 (−30.54, 19.50) | 0.65 |
| Quadrant (%strain difference from T) |
0.004 | 0.001 | ||
| I | 0.411 (−0.119, 0.941) | 0.590 (−0.143, 1.323) | ||
| N | −0.499 (−1.029,0.030) | −0.839 (−1.572, −0.105) | ||
| S | −0.497 (−1.026,0.033) | −0.863 (−1.596, −0.130) | ||
| T (reference) | 0 | 0 | ||
Figure 8:
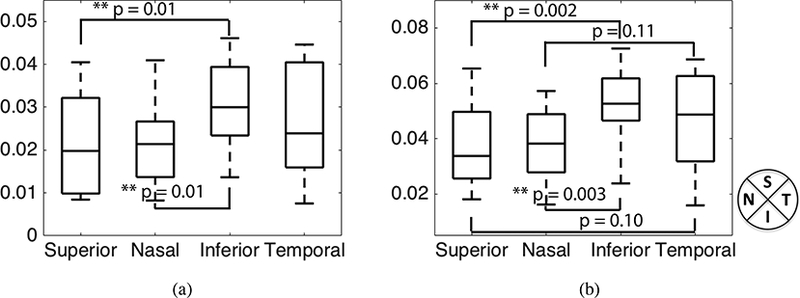
Comparing the maximum principal strain for the four quadrants in the central 200 < r < 550μm region surrounding the CRAV (n = 8). The p-values were calculated from post-hoc pairwise comparison. The superscript ** indicates p < 0.01 and * indicates p < 0.05.
We next compared the maximum principal strain and maximum shear strain averaged in the full quadrant, which included the central and peripheral regions. For 2 of the 8 specimens (the left and right eye for MC88), the SHG images had poor contrast in some of the peripheral quadrants and we were unable to obtain sufficiently accurate DVC displacement correlation. These were excluded in the statistical comparison. In the full quadrant comparison, we also found differences in the average value of the maximum principal strain at 45 mmHg (p = 0.06, n = 6, Table 5). The maximum principal strain was on average smaller in the nasal quadrant by 0.9%−1.1% strain compared to the other 3 quadrants. The maximum principal strain also depended on the LC shape, increasing with the ratio of the long and short axes. However, the maximum principal strains did not exhibit a significant dependence on the LC area (Fig. 10) defined as, A =πab, where a and b are the major and minor axes of the ellipse that was fit to the LC opening.
Table 5:
Results of the multivariable mixed linear model for variations in the maximum principal strain in full LC with quadrant, age, and LC shape (n = 6). Older age was significantly associated with smaller strain. The variation in maximum principal strain between quadrants at 45 mmHg may also be significant (p=0.06)
| 10 mmHg | 45 mmHg | |||
|---|---|---|---|---|
| Variable | Estimate (95% CI) | p-values | Estimate (95% CI) | p-values |
| Age, years (%strain/year) | −0.048 (−0.079, −0.017) | 0.02 | −0.062 (−0.104, −0.019) | 0.02 |
| Ratio of length of LC axes Longer divided by shorter (%strain/axis ratio) | 13.39 (−6.55, 33.33) | 0.12 | 20.88 (−6.44, 48.21) | 0.09 |
| Quadrant (%strain difference from T) |
0.73 | 0.06 | ||
| I | −0.055 (−0.759, 0.649) | −0.230 (−1.099, 0.640) | ||
| N | −0.276 (−0.980, 0.428) | −1.123 (−1.993,−0.254) | ||
| S | 0.085 (−0.619, 0.789) | −0.138 (−1.007, 0.732) | ||
| T (reference) | 0 | 0 | ||
Figure 10:
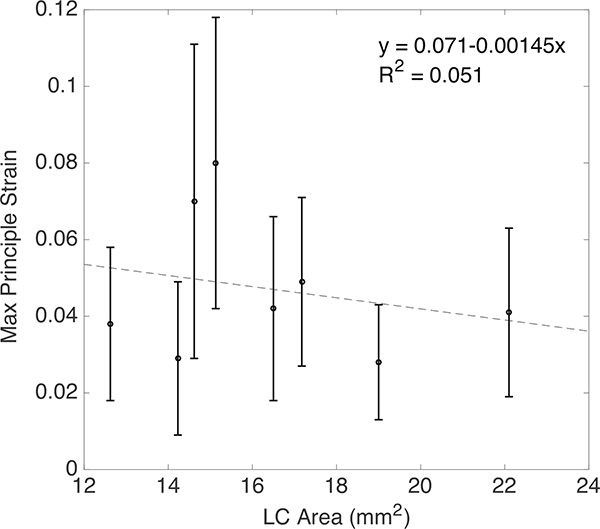
The maximum principal strain E1 at 45mmHg did not vary significantly with LC Area. The error bars indicate ± 1 standard deviation.
3.2.2. Radial variation in LC strains
To examine the radial variation in the strain magnitudes, we calculated the average maximum principal strain and maximum shear strain in the central and peripheral regions surrounding the CRAV and applied a multivariable mixed linear regression model to compare the 2 regions, adjusting for the effects of age and LC shape (Table 6, 7). The in-plane maximum shear strain was significantly larger in the peripheral than central region (p = 0.01 for 10 mmHg and p = 0.02 for 45 mmHg, n = 6, Fig. 12).
Table 6:
Results of the multivariable mixed linear model comparing the maximum principal strain in the central and peripheral regions considering the effect of age and LC shape (n = 6). Older age was significantly associated with smaller strain, but there was not a statistically significant variation in the maximum principal strain with region.
| 10 mmHg | 45 mmHg | |||
|---|---|---|---|---|
| Variable | Estimate (95% CI) | p-values | Estimate (95% CI) | p-values |
| Age, years (%strain/year) | −0.043 (−0.082, −0.004) | 0.04 | −0.056 (−0.110, −0.001) | 0.05 |
| Ratio of length of LC axes Longer divided by shorter (%strain/axis ratio) |
9.36 (−15.57, 34.29) | 0.32 | 13.34 (−21.84, 48.51) | 0.31 |
| Region (%strain difference from Peripheral) |
0.28 | 0.17 | ||
| Central | −0.607 (−1.907, 0.694) | −1.134 (−2.935, 0.668) | ||
| Peripheral (reference) | 0 | 0 | ||
Table 7:
Results of the multivariable mixed linear model comparing the maximum shear strain in the central and peripheral regions considering the effect of age and LC shape (n = 6). The maximum shear strain was significantly different in the central and peripheral regions.
| 10 mmHg | 45 mmHg | |||
|---|---|---|---|---|
| Variable | Estimate (95% CI) | p-values | Estimate (95% CI) | p-values |
| Age, years (%strain/year) | −0.015 (−0.036, 0.006) | 0.10 | −0.017 ( −0.042, 0.008) | 0.12 |
| Ratio of length of LC axes Longer divided by shorter (%strain/axis ratio) |
4.24 (−9.12, 17.59) | 0.39 | 4.44 (−11.62, 20.51) | 0.44 |
| Region (%strain difference from Peripheral) |
0.01 | 0.02 | ||
| Central | −0.405 (−0.682, −0.127) | −0.578 ( −1.022, −0.135) | ||
| Peripheral (reference) | 0 | 0 | ||
Figure 12:
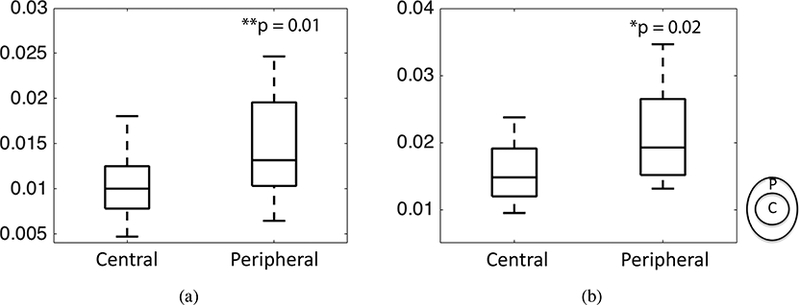
Comparing the maximum shear strain in the central and peripheral regions for a) 10 mmHg 45 mmHg (n = 6). The p-values were calculated from post-hoc pairwise comparison. The superscript indicates p < 0.01 and * indicates p < 0.05.
Contour plots of the maximum shear strain showed that the highest values occurred at the boundary between the more compliant LC and stiffer sclera (Fig. S27-S34 in the Supplemental Material). The maximum principal strain was not statistically different in the central and peripheral regions (p > 0.1, n = 6, Fig. 11) because of large variations in each region. The strains for all specimens showed large radial variation, but the trends in the radial variation were different among different specimens. To examine the radial variations in more detail, we compared the maximum principal strain averaged in the CRAV, central, and peripheral regions for all 6 specimens (Fig. 13a-f). For 5 of the 6 specimens, the maximum principal strain increased radially from the CRAV to the peripheral region (Fig. 13).
Figure 11:
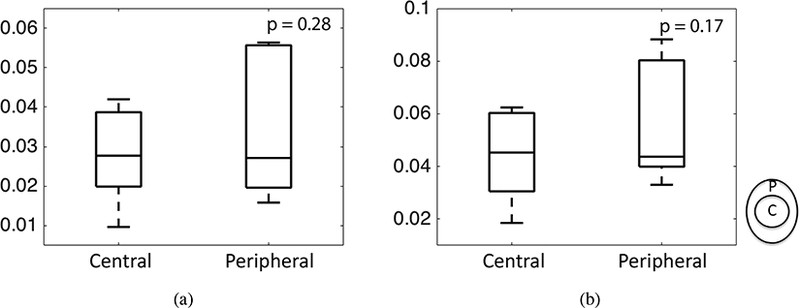
Comparing the maximum principal strain in the central and peripheral regions for a) 10 mmHg b) 45 mmHg (n=6). The p-values were calculated from post-hoc pairwise comparison.
Figure 13:
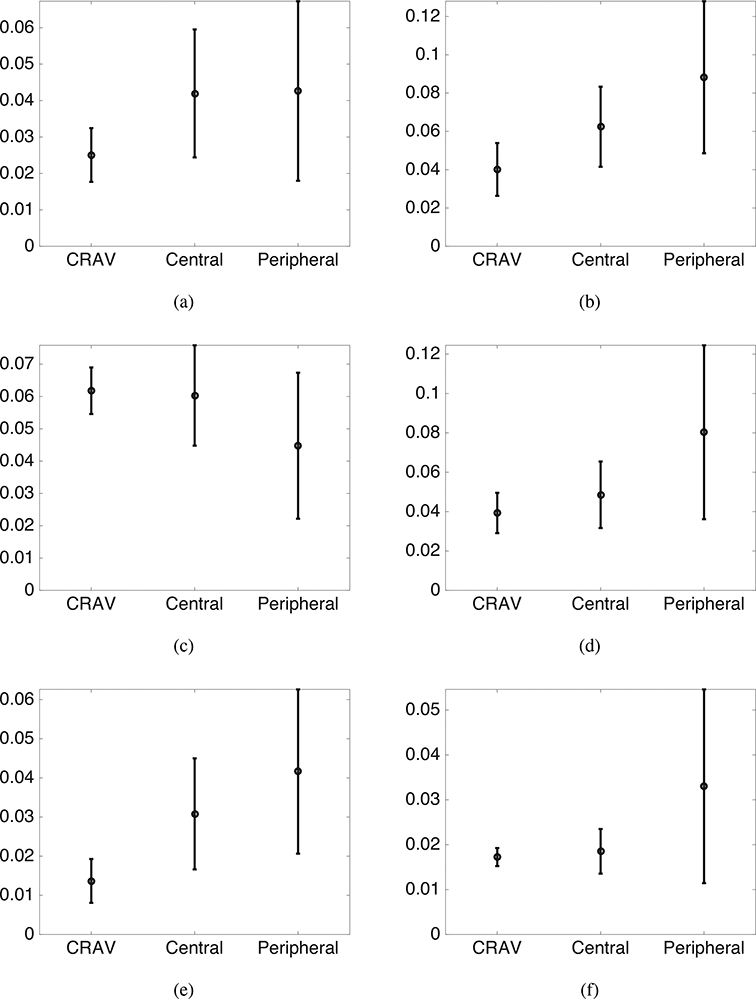
Radial variation of average maximum principal strain at 45 mmHg for a) FC49, b) MH42, c) MC57, d) FC26, e) left eye of FC93, and f) right eye of FC93. The regions are defined as, peripheral: r > 550μm, central: 200 < r < 550μm, and the CRAV r < 200μm. The error bars indicate ±1 standard deviation.
3.3. Age related variations
Older age was predictive of a decrease in all of the LC strain outcomes. The quadrant-averaged maximum principal strain decreased by 0.048% strain per year at 10 mmHg and 0.062% strain per year at 45 mmHg (p = 0.02 for 10 mmHg and p = 0.02 for 45 mmHg, n = 6, Table 5), which is nearly 1% strain per 20 years. A similar rate of decrease was calculated for the specimen averaged (Fig. 14) and the radial region averaged strains (p = 0.04 for 10 mmHg and p=0.05 for 45 mmHg, n = 6, Table 6). It should be noted that though the analysis shows statistically significant variation in the maximum principal strain with age, the comparison included only 8 eyes from six donors. Moreover, 4 of the eyes are from the oldest donors, aged 86 and 93. More eyes between the ages of 60 and 85 are needed to further investigate the effects of age.
Figure 14:
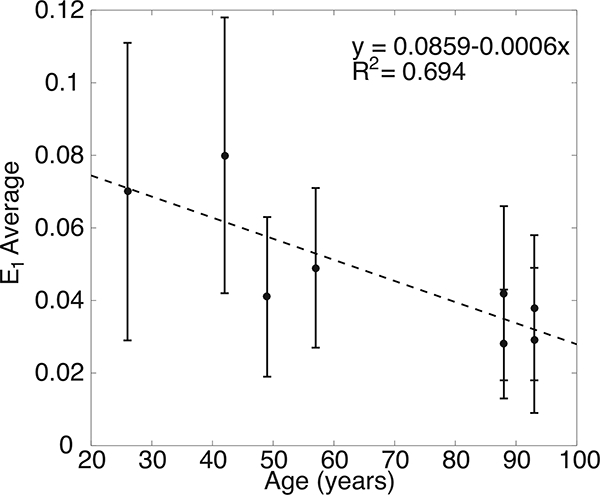
The maximum principal strain E\ at 45mmHg decreased with age. The error bars indicate E1 standard deviation.
3.4. Thickness Measurements
Figure 15 a-d shows the maximum intensity projection of each 75 μm section of the left eye of specimen FC93. The anterior most section, which was nearly devoid of collagen, contained primarily the pre-LC tissue. The collagen beams of the LC were apparent in the posterior most section, which indicated that a small portion of the LC was removed during specimen preparation and the volume analyzed in the inflation test contained mainly the LC. The thickness was calculated as described in Sec. 2.10 and plotted in Fig. 16 for both specimens. The thickness of the LC was on average 328.6±57.4 μm for the left eye and 351.0 ± 72.5 μm for the right eye, which confirmed that the specimen-preparation method left most of the LC intact. The thickness varied by 100 μm in both specimens. The quadrant averaged LC thickness for the left eye was 376.9 ±41.7 μm in the temporal, 317.1 ±50.3 μm in the inferior, 312.9 ±55.2 μm in the superior, and 297.0 ± 44.5 μm in the nasal quadrant. For the right eye, the quadrant averaged thickness was 412.3 ± 67.5 μm in the superior, 405.9 ± 56.6 μm in the temporal, 340.4 ±48.9 μm in the nasal, and 294.6 ± 55.0 μm in the inferior.
Figure 15:
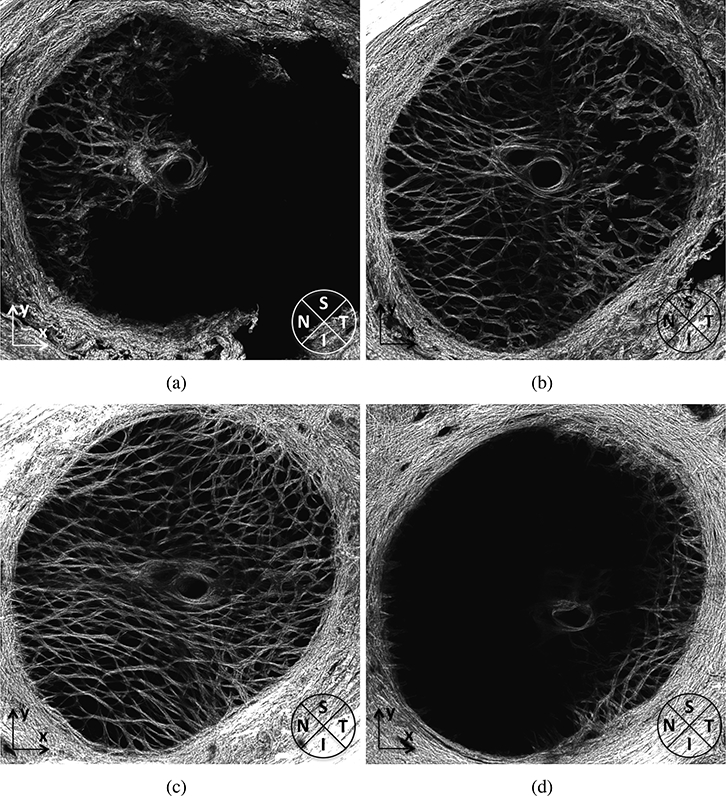
Maximum intensity projections of 75 μm sections in the FC93 LE LC at a) 1–75 μm, b) 151225 μm, c) 301–375 μm, and d) 451–525 μm anterior to the posterior surface of the LC, showing structure variation with depth
Figure 16:
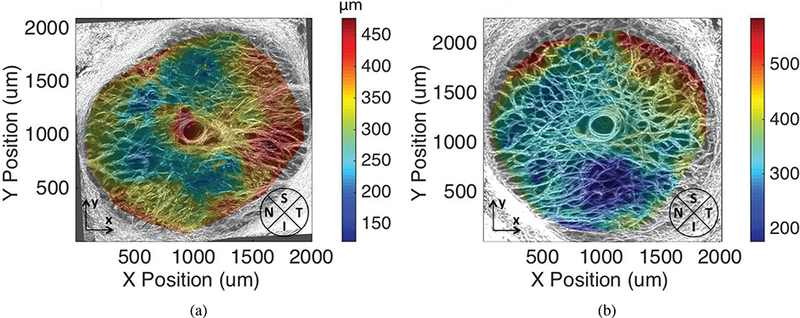
LC thickness maps for specimen FC93 a) left eye and b) right eye
4. Discussion
The LC undergoes a significant posterior translation, caused by the inflation response of the sclera, as well as posterior bulging and in-plane biaxial stretch, caused by the widening of the LC opening (i.e., scleral canal). All shear strain components were on average an order of magnitude smaller than the in-plane tensile strains. The biaxial stretch ratio depended on the elliptical shape of the LC. The larger in-plane strain component was along the longer axis of the LC, and the difference between the in-plane strains increased with the ratio of the long to short axis of the LC. Thus, the initially oval-shaped human LC becomes more oval under pressure but does not undergo significant distortion from shear. Gloster [61] measured the shape of the optic cup and found that glaucomatous eyes with visual field defects had the most oval cup shape, where the long axis was along the inferior-superior direction, followed by those of ocular hypertensives with no visual field defects, then those of non-glaucomatous eyes with full visual fields. These findings are consistent with the present study, and suggest that the LC becomes more oval with higher IOP. The increased oval shape produces higher strains in the inferior and superior regions, which may lead to the development of axon damage in these regions in early glaucoma. Previous studies have also found a larger optic disk area in open angle glaucoma [62, 63]. However, we did not find an association between the maximum principal strain and the LC area.
The strains were nearly uniform through the thickness of the posterior volume of the LC, but showed large variations in the plane. The maximum shear strain was larger in the peripheral region than the central region, and for most specimens, the maximum shear strain was largest at the boundary with the significantly stiffer sclera. The peripapillary sclera has an anisotropic collagen structure, where the degree of fiber alignment varies circumferentially around the optic nerve head. Wide angle x-ray scattering measurements show that the degree of collagen fiber alignment for all specimens was lowest in the nasal quadrant [64]. The circumferential variation in the anisotropic properties of the peripapillary sclera may lead to the larger shear strain in the peripheral region of the LC. The maximum principal strain in the LC varied radially from the CRAY to the peripheral region. In 5 out of 6 specimens, the maximum principal strain was smallest at the CRAV and increased from the CRAV to the peripheral region. The finding that the maximum shear and tensile strains were largest in the peripheral region is consistent with the initial loss of peripheral vision in clinical glaucoma. The histological studies of Minkler [65] showed that the peripheral retinal ganglion cells occupy the more peripheral positions of the optic nerve, and the larger shear and tensile strains measured in these regions may cause glaucoma damage to initiate in the peripheral axons.
An analysis for quadrant variation, both among 6 specimens in which we had data for the full LC, and the central region for all 8 specimens, showed that the maximum principal strain was lower in the nasal quadrant and higher in the inferior and temporal quadrants. In the full quadrant comparison, we found differences in the average value of the maximum principal strain. The average value of the maximum principal strain was smallest in the nasal quadrant by 0.9%−1.1% strain compared to the other 3 quadrants. The superior quadrant had a low average value of the maximum principal strain in the central region but a high value in the peripheral region, and this caused the average value of the entire superior quadrant to be similar to that of the inferior quadrant. Overall, the regional variation in the strain magnitude appears compatible with the progression of axonal damage in glaucoma, which begins in the inferotemporal and superotemporal regions [4, 6]. The optic nerve axons in the nasal region are the last to be damaged [4]. Further studies are needed to examine the association between eye-specific spatial distribution of high tensile and shear strains and the pattern of axonal damage.
Finally, all strain outcomes decreased with age. This suggests that the LC stiffened with age, which is expected for collagenous tissues. However, the posterior sclera also stiffens with age [66–70]. The measured behavior of the LC depends both on its own properties and those of the surrounding sclera. To take account of both features requires knowledge of the eye-specific properties of the LC and the sclera. The mechanical behavior of the sclera of the inflation tested specimen will be estimated in future work using a specimen-specific computational model from the large posterior translation of the LC in response to an increase in pressure.
Regional variations in LC strains may be caused by variations in the LC beam structure, such as volume fraction and anisotropy, variations in LC thickness and shape, and variations in peripapillary structure. In this study, we fixed specimens from the left and right eye of FC93 after inflation testing, cut 75 μm thick sections transverse to optic axis, and imaged the sections using backscattered SHG. Results showed that the volumes analyzed by DVC for strain were entirely within the LC. The thickness varied regionally for both specimens. For the left eye, the average thickness of the superior, nasal, and inferior quadrants were similar, within 20 μm of each other, while the temporal quadrant was 60–80 μm thicker. The thickness variation did not correspond in general to the variation in the maximum principal strain for these two specimens. In the left eye, the thinnest quadrant was the nasal followed closely by inferior and superior. The temporal quadrant was noticeably the thickest. The maximum principal strain was highest for the superior and inferior regions and lower in temporal, which was consistent with the thickness variation; however, the smallest strain was in the nasal quadrant, which was thinnest. Likewise for the right eye, the largest maximum strain occurred in superior, which was the thickest quadrant. These results indicate that the LC thickness can influence the strain fields, but that the variations in the LC beam structure and peripapillary scleral structure and properties may also have significant contributions. In future studies, we will section all specimens after inflation testing, image the sections with SHG, and analyze for variations in thickness and connective tissue structure. This data will also be vital to developing specimen-specific computational models to determine the mechanical properties and further study the effect of variations in the LC, peripapillary structure, and mechanical properties on the stress and strain state in the optic nerve tissues.
Previous studies have also applied 2D-DIC and DVC to measure the deformation response of the LC to pressure. Compared to Sigal et al. [44], which used 2D-DIC to analyze the maximum intensity projections of SHG volumes of the human LC, we also found significant in-plane variations in strain. We compared the 2D-DIC displacement and strain fields with the thickness-averaged in-plane displacement and strain fields from DVC. The in-plane displacement fields from the 2 analyses for the pressure change of 5 to 45 mmHg differed on average by about a pixel. However, the differences in the in-plane strain were large, where the strains computed from the 2D-DIC displacements were smaller by 1–3% strain than those calculated from the DVC displacements. (Sec. 2.8) The 2D-DIC analysis does not capture the effect of posterior bowing (out-of-plane displacement) on the in-plane strains, thus yielding smaller strain magnitudes than DVC. Sigal et al. [44] reported that the average maximum principal strain varied between 2.5–4.5% for inflation from 10–45 mmHg. The magnitude of the average principal strain was similar, though smaller, to those measured in this study, which varied between 2.8–8.0% for a 5 to 45 mmHg pressure increase. The authors also showed that the strain state for some specimens near the CRAV region was mainly biaxial tension, while shear and in-plane compression became more prominent at the periphery. We also measured some localized regions of in-plane compression near the peripapillary sclera and the maximum shear strain increased towards the periphery. However, the magnitude of both shear and in-plane compression strains were significantly smaller than the in-plane tensile strains.
Girard et al [46] developed an in vivo test using spectral domain optical coherence tomography (SD-OCT) and DVC to measure the IOP-induced deformation field. They reported average maximum principal strains in the LC of the order of 0.7–1.3% after a mean IOP lowering from 25.3 mmHg to 13.5 mmHg, which is consistent with the strain magnitudes reported here. OCT has lower spatial resolution than SHG imaging and significant portions of the LC can be obscured by blood vessels.
Coudrillier et al. [47] used phase contrast micro-CT and DVC to calculate the 3D deformations and strains in the pig LC between 6 and 30 mmHg. He reported large posterior displacement, high compressive out-of-plane strains in the LC of the order of 20% or more, and maximum in-plane tensile strains averaging 5.5%. The magnitude of the average principal strain was similar to those measured here, which varied between 2.8–8.0% for a 5 to 45 mmHg pressure increase. We also observed the same large posterior displacement of the lamina and localized bulging of the LC surface. However, we measured a significantly smaller magnitude for the out-of-plane compression strain because the larger spacing and blurring in the Z direction produced larger error and uncertainty in the out-of-plane gradient calculation. In contrast to the phase contrast micro-CT, SHG was unable to penetrate through the entire LC thickness, thus we were able to measure strains in a 150 — 200μm thick volume. However, SHG imaging has higher spatial resolution. Phase-contrast micro-CT also requires the capabilities of a third generation synchrotron facility. For human donor tissues, the limited user time at a synchrotron facility would necessitate freezing the specimens, which may alter the collagen structure and mechanical response.
Several limitations should be considered when interpreting the results of this study. First, SHG suffers from significant blurring in the out-of-plane Z direction and has lower spatial resolution in Z than in-plane. The method was unable to image the entire LC volume. The SHG signal gradually faded with Z depth and disappeared entirely after 200 — 300μm in depth. The DVC error analysis showed that we obtained accurate displacement correlations for 150–200 μm thick volumes. The method also required removing the post-LC myelinated optic nerve to expose the beams of the LC. This was done by multiple thin cuts, with the specimen imaged after each cut under a dissecting microscope, to ensure that we did not remove a significant portion of the LC. Thickness measurements for 2 inflation-tested specimens showed that only a small portion of the posterior LC volume was removed in this process. The thickness of the fixed specimens were on average 328 μm and 350 μm. The LC in advanced glaucoma eyes has a more cupped shape, and the process of cutting off the nerve may either remove too much of the LC or too little of the post-LC tissue to image deep into the LC. In future studies, we will section all specimens for thickness measurements and microstructural evaluations after inflation testing.
The deformation mapping method developed here uses SHG to image the collagen beams of the LC to provide a natural speckle pattern for DVC. However, SHG cannot be used image the optic nerve disk of mouse models of glaucoma and other small animals that have no or little connective tissue in the lamina. SHG also cannot be used for in vivo measurement of LC deformation and properties. However, DVC can be used with a variety of imaging methods. For example, we are developing an inflation method to map the deformation of the astrocytic lamina of GFP-glutamate transporter-GLT1 CD1 mice [71]. The method uses two-photon fluorescence, a nonlinear optical microscopy method, to provide a natural speckle pattern for DVC correlation. For in vivo deformation measurements of the lamina cribrosa, Girard et al. [46] applied spectral domain optical coherence tomography to image the lamina cribrosa for DVC.
The method used to calculate the displacement gradients could be improved upon in the future. We applied a 6th-order polynomial to fit the in-plane displacements before computing the displacement gradients. While we showed negligible differences in the average strain calculation for smoothing with higher order polynomials, the method may have obscured sharp strain gradients. We will investigate interpolation methods with smoothing constraints (e.g. Hashima et al. [72]) to improve the accuracy of the strain calculations in future studies. In addition, we will develop methods to calculate the circumferential and radial strain components, which are more consistent with the shape of the LC, as well as strains along the laminar beams.
For statistical analysis of regional strain variations, we chose to separate the quadrants using 45° and 135° bisectors to be consistent with previous histological evaluations of optic nerve axon damage [6]. The peripheral and central regions were divided using a fixed 550μm radius from the CRAV, which was half the average radius of the LC. We excluded a 200 μm radius area, which corresponded to the average radius of CRAV, from the central region because the denser CRAV tissues were likely stiffer than the surrounding LC tissues. This division allowed the central quadrants of the different specimens to be the same size and shape for statistical comparisons of the strain outcomes. However, the LC of most specimens were elliptical in shape and the CRAV in general was not centrally located. Thus, the peripapillary quadrants differed significantly in size and shape among the different specimens. Alternately, the LC can be divided by an inner ellipse defined by a 50% area fraction or by the half radial distance between the CRAV and the LC opening. However, the current division produced quadrant variations and radial variations in the strain magnitudes that were consistent with the pattern of optic nerve axon damage in early glaucoma.
Finally, segmentation of the LC from the peripapillary sclera can be challenging. Though the area projection of the LC could be approximated as ellipsoidal, the shape of the LC was irregular and varied slightly through the thickness. Thus, were unable to separate the LC from the peripapillary sclera by masking alone. Instead, we used the DVC displacement correlation error calculation to segment the LC from PPS. Filtering out points with displacement correlation error greater than 4 μm (1.5–2 pixels) removed most of the PPS and also some points near the LC and PPS interface. This may affect the regionally averaged strain calculation and statistical comparisons. For the comparisons between peripheral and central and between full quadrants, we only used 6 out of 8 specimens, where the volume with missing displacement data was small compared to the volume in which the regional averages were calculated. For the same reason, we compared averages of the central and full quadrants only and not of the peripheral quadrants.
5. Conclusions
We developed an ex vivo inflation test that directly measures the full-field deformation response of the human LC. The main findings of this work were that older age was correlated with a stiffer LC response to pressure. There was a significant difference in magnitude between the in-plane tensile and shear strain components. All shear strain components including the in-plane EXY, were an order of magnitude smaller than the in-plane tensile components. The tensile strain along the longer axis of the elliptically-shaped LC was significantly larger than along the shorter axis. However, there was no association between the maximum principal strain and the LC area. The maximum principal strain was larger in the inferior, superior and temporal quadrants and smallest in the nasal quadrant. For most of the specimens the maximum principal strain was smallest in the CRAV region and largest in the peripheral region.The maximum shear strain was also higher in the peripheral than central region.
Overall, the regional variation in strain appears consistent with the pattern of optic nerve damage in early glaucoma. The thickness variation may have contributed to but was insufficient to explain the regional variations in the LC strains. Variations in the connective tissue structure of the LC and peripapillary sclera may also contribute significantly the measured variations in LC strains.
Supplementary Material
Figure 9:
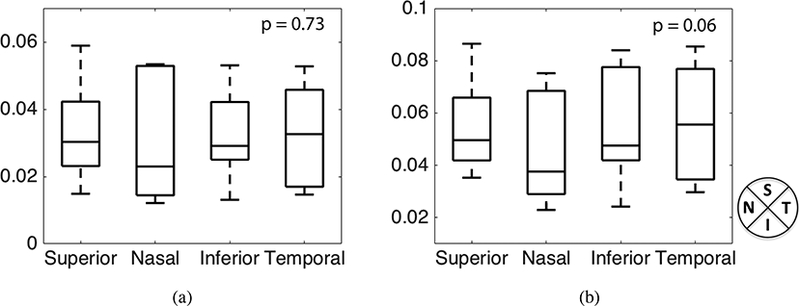
Comparing the maximum principal strain (n = 6) for the four full quadrants including the central and peripheral regions. The p-values were calculated from post-hoc pairwise comparison. The superscript ** indicates p < 0.01 and * indicates p < 0.05.
Acknowledgements
The authors DEM and TDN would like to acknowledge Martha Whiting who designed and manufactured the pressure chamber with tilt correcting gears used in this study for inflation testing while she was an undergraduate student in the Mechanical Engineering Department of The Johns Hopkins University. This work was supported by: NSF CAREER Award 1253453; Public Health Service Research Grants EY021500, EY02120, and EY01765; and Brightfocus Foundation grant G2015132. Funding sources and sponsors had no involvement in the design of these studies, the collection and analysis of the data, or the writing of this manuscript.
Appendix A. Gaussian Filter
A 3D Gaussian filter of kernel size 11 was applied to smooth the X, Y, and Z displacements and remove isolated points with sharp spikes in the displacement components. The smoothed displacement UIS (Xl,Ym,Zn) at a given grid point (l,m,n) was calculated from the DVC displacement field UI as,
where the index I indicates the X, Y, or Z component. The K (i, j, k) is the value of the Gaussian filter evaluated over the neighborhood of grid points i, j,k = −5…5 about the point l,m,n, where the standard deviation σ was set to 3, and the sum was only evaluated for points where the DVC displacement was not a NaN. The Gaussian filter was normalized by the sum Ksum (Xl, Ym, Zn) over the neighborhood of points with non-NaN displacement components.
Footnotes
Disclosures
The authors declare that they have no conflicts of interest.
References
- [1].Quigley HA, Neuronal death in glaucoma, Prog. Ret. Eye Res 18:39–57(1998). [DOI] [PubMed] [Google Scholar]
- [2].Drance SM, The glaucomatous visual field, Br. J. Ophthalmol 56:186–200(1972). [DOI] [PMC free article] [PubMed] [Google Scholar]
- [3].Quigley HA, Addicks EM, Regional differences in the structure of the lamina cribrosa and their relation to glaucomatous optic nerve damage, Arch. Ophthalmol 99:137–143(1981). [DOI] [PubMed] [Google Scholar]
- [4].Jonas JB, Fernandez MC, Stürmer J, Pattern of glaucomatous neuroretinal rim loss, Ophthalmol. 100:63–8(1993). [DOI] [PubMed] [Google Scholar]
- [5].Jonas JB, Budde WM, Panda-Jonas S, Ophthalmoscopic evaluation of the optic nerve head, Surv. Ophthalmol 43:293–320(1999). [DOI] [PubMed] [Google Scholar]
- [6].Quigley HA, Addicks EM, Green WR, Optic nerve damage in human glaucoma III. Quantitative correlation of nerve fiber loss and visual field defect in glaucoma, ischemic neuropathy, papilledema, and toxic neuropathy, Arch. Ophthalmol 100:135–146(1982). [DOI] [PubMed] [Google Scholar]
- [7].Quigley HA, Addicks EM, Regional differences in the structure of the lamina cribrosa and their relation to glaucomatous optic-nerve damage, Arch. Ophthalmol 99:137–143(1981). [DOI] [PubMed] [Google Scholar]
- [8].Glovinsky Y, Quigley HA, Dunkelberger GR, Retinal ganglion cell loss is size dependent in experimental glaucoma, Invest. Ophthalmol. Vis. Sci 32:484–491(1991). [PubMed] [Google Scholar]
- [9].Quigley HA, Dunkelberger GR, Green WR, Retinal ganglion cell atrophy correlated with automated perimetry in human eyes with glaucoma, Am. J. Ophthalmol 107:453–464(1989). [DOI] [PubMed] [Google Scholar]
- [10].Leske MC, Open-angle glaucoma - An epidemiologic overview, Ophthalmic Epidemilogy 14:166– 172(2007). [DOI] [PubMed] [Google Scholar]
- [11].Boland MV, Quigley HA, Risk factors and open-angle glaucoma: classification and application, J. Glaucoma 16:406–18(2007). [DOI] [PubMed] [Google Scholar]
- [12].Nouri-Mahdavi K, Hoffman D, Coleman AL, Liu G, Li G, Gaasterland D, Caprioli J, Predictive factors for glaucomatous visual field progression in the Advanced Glaucoma Intervention Study, Ophthalmol. 111:1627–1635(2004). [DOI] [PubMed] [Google Scholar]
- [13].Bengtsson B, Heijl A, Diurnal IOP fluctuation: Not an independent risk factor for glaucomatous visual field loss in high-risk ocular hypertension, Graefe’s Arch. Clin. Exp. Ophthalmol 243:513– 518(2005). [DOI] [PubMed] [Google Scholar]
- [14].Caprioli J, Coleman AL, Intraocular pressure fluctuation. A risk factor for visual field progression at low intraocular pressures in the advanced glaucoma intervention study, Ophthalmol. 115:1123– 1129(2008). [DOI] [PubMed] [Google Scholar]
- [15].Gaasterland DE, Ederer F, Beck A, Costarides A, Leef D, Closek J, Banks J, Jackson S, Moore K, Vela A, Brown RH, Lynch M, Gunsby J, Lober K, Marsh T, Stepka C, Montgomery R, Clagett D, Ashburn F, Schacht K, Coyle E, Garland MK, Lauber S, Michelitsch K, Plavnieks S, Vayer L, Burt E, Hundley M, Rae A, Allen RC, Miller E, Sporn A, Fendley CK, Hoyle LS, Weber PA, Derick R, McKinney K, Moore D, Lauderbaugh T, Baker ND,Kapetansky F, Lehmann D, Black L, Gloeckner B, Coleman K, Cassady M, Sharf LJ, Romans B, Satterwhite Y, Simmons L, Vela MA, Harbin J, Brannon TSL, Wright J, LaSalle J,Degenhardt G, Bridgman SA, Ozment RR, Hooper M, Goldstein S, Butler L, Perry M, Eckel A, Martin A, Session C, Nummerdor D, Wille L, Cyrlin MN, Dubay H, Fazio R, Corbin PS, Wilensky JT, Lindenmuth K, Hillman D, Carroll CA, Hatton J, Sonty S, Higginbotham EJ, Scholes G, Uva R, Fiene J, Frohlichstein D, Gates V, Pappas L, Rathbone D, Tadelman M, Hopkins G, Lichter PR, Bergstrom TJ, Moroi SE, Pollack-Rundle CJ, Standardi C, Abt L, Van Heck T, Skuta GL, Schertzer RM, Wicker D, Van Veldhuisen PC, The Advanced Glaucoma Intervention Study (AGIS): 7. The relationship between control of intraocular pressure and visual field deterioration, Am. J. Ophthalmol 130:429–440(2000). [DOI] [PubMed] [Google Scholar]
- [16].Heijl A, Reduction of intraocular pressure and glaucoma progression, Arch. Ophthalmol 120:1268(2002). [DOI] [PubMed] [Google Scholar]
- [17].Quigley HA, Anderson DR, Distribution of axonal transport blockade by acute intraocular pressure elevation in the primate optic nerve head, Invest. Ophthalmol. Vis. Sci 16:640–646(1977). [PubMed] [Google Scholar]
- [18].Minckler DS, Correlations between anatomic features and axonal transport in primate optic nerve head, Trans. Am. Ophthalmol. Soc 84:429–452(1986). [PMC free article] [PubMed] [Google Scholar]
- [19].Dandona L, Hendrickson A, Quigley HA, Selective effects of experimental glaucoma on axonal transport by retinal ganglion cells to the dorsal lateral geniculate nucleus, Invest. Ophthalmol. Vis. Sci 32:484–491(1991). [PubMed] [Google Scholar]
- [20].Quigley HA, McKinnon SJ, Zack DJ, Pease ME, Kerrigan-Baumrind LA, Kerrigan DF, Mitchell RS, Retrograde axonal transport of BDNF in retinal ganglion cells is blocked by acute IOP elevation in rats, Invest. Ophthalmol. Vis. Sci 41:3460–6(2000). [PubMed] [Google Scholar]
- [21].Pease ME, McKinnon SJ, Quigley HA, Kerrigan-Baumrind LA, Zack DJ, Obstructed axonal transport of BDNF and its receptor TrkB in experimental glaucoma, Invest. Ophthalmol. Vis. Sci 41:764–74(2000). [PubMed] [Google Scholar]
- [22].Martin KR, Quigley HA, Valenta D, Kielczewki J, Pease ME, Optic nerve dynein motor protein distribution changes with intraocular pressure elevation in a rat model of glaucoma, Exp. Eye Res 83:255–262(2006). [DOI] [PubMed] [Google Scholar]
- [23].Hernandez MR, Yang J, Ye H, Activation of elastin mRNA expression in human optic nerve heads with primary open-angle glaucoma, J. Glaucoma 3:214–25(1994). [PubMed] [Google Scholar]
- [24].Clark AF, Browder S, Steely HT, Wilson K, Cantu-Crouch D, McCartney MD, Cell biology of the human lamina cribrosa, in: Drance SM, Anderson DR (Eds.), Opt. Nerve Glaucoma, Kugler Publications, 1995, pp. 79–105. [Google Scholar]
- [25].Quigley HA, New paradigms in the mechanisms and management of glaucoma, Eye 19:1241– 1248(2005). [DOI] [PubMed] [Google Scholar]
- [26].Sommer A, Tielsch JM, Quigley HA, Gottsch JD, Javitt J, Singh K, Relationship between intraocular pressure and primary open angle glaucoma among white and black Americans: The Balti more Eye Survey, Arch. Ophthalmol 109:1090–1095(1991). [DOI] [PubMed] [Google Scholar]
- [27].Kass MA, Heuer DK, Higginbotham EJ, Johnson CA, Keltner JL, Miller JP, Parrish RK, Wilson MR, Gordon MO, The ocular hypertension treatment study: a randomized trial determines that topical ocular hypotensive medication delays or prevents the onset of primary open-angle glaucoma, Arch. Ophthalmol 120:701–713(2002). [DOI] [PubMed] [Google Scholar]
- [28].Ethier CR, Scleral biomechanics and glaucoma-a connection?, Can. J. Ophthalmol 41:9–11(2006). [DOI] [PubMed] [Google Scholar]
- [29].Burgoyne CF, Downs JC, Bellezza AJ, Suh JF, Hart RT, The optic nerve head as a biomechanical structure: a new paradigm for understanding the role of IOP-related stress and strain in the pathophysiology of glaucomatous optic nerve head damage, Prog. Retin. Eye Res 24:39–73(2005). [DOI] [PubMed] [Google Scholar]
- [30].Coudrillier B, Boote C, Quigley HA, Nguyen TD, Scleral anisotropy and its effects on the mechanical response of the optic nerve head, Biomech. Model. Mechanobiol 12:941–63(2013). [DOI] [PMC free article] [PubMed] [Google Scholar]
- [31].Sigal IA, Yang H, Roberts MD, Grimm JL, Burgoyne CF, Demirel S, Downs JC, IOP-induced lamina cribrosa deformation and scleral canal expansion: independent or related?, Invest. Ophthalmol. Vis. Sci 52:9023–32(2011). [DOI] [PMC free article] [PubMed] [Google Scholar]
- [32].Sigal IA, Flanagan JG, Ethier CR, Factors influencing optic nerve head biomechanics, Invest. Ophthalmol. Vis. Sci 46:4189–99(2005). [DOI] [PubMed] [Google Scholar]
- [33].Levy NS, Crapps EE, Bonney RC, Displacement of the optic nerve head. Response to acute intraocular pressure elevation in primate eyes, Arch. Ophthalmol 99:2166–2174(1981). [DOI] [PubMed] [Google Scholar]
- [34].Levy NS, Crapps EE, Displacement of optic nerve head in response to short-term intraocular pressure elevation in human eyes, Arch. Ophthalmol 102:782–786(1984). [DOI] [PubMed] [Google Scholar]
- [35].Zeimer RC, Ogura Y, The relation between glaucomatous damage and optic nerve head mechanical compliance, Arch. Ophthalmol 107:1232–1234(1989). [DOI] [PubMed] [Google Scholar]
- [36].Coleman AL, Quigley HA, Vitale S, Dunkelberger G, Displacement of the optic nerve head by acute changes in intraocular pressure in monkey eyes, Ophthalmol. 98:35–40(1991). [DOI] [PubMed] [Google Scholar]
- [37].Yan DB, Coloma FM, Metheetrairut A, Trope GE, Heathcote JG, Ethier CR, Deformation of the lamina cribrosa by elevated intraocular pressure, Br. J. Ophthalmol 78:643–648(1994). [DOI] [PMC free article] [PubMed] [Google Scholar]
- [38].Albon J, Purslow PP, Karwatowski WS, Easty DL, Age related compliance of the lamina cribrosa in human eyes, Br. J. Ophthalmol 84:318–23(2000). [DOI] [PMC free article] [PubMed] [Google Scholar]
- [39].Bellezza AJ, Rintalan CJ, Thompson HW, Downs JC, Hart RT, Burgoyne CF, Deformation of the lamina cribrosa and anterior scleral canal wall in early experimental glaucoma, Invest. Ophthalmol. Vis. Sci 44:623–637(2003). [DOI] [PubMed] [Google Scholar]
- [40].Yang H, Downs JC, Sigal IA, Roberts MD, Thompson H, Burgoyne CF, Deformation of the normal monkey optic nerve head connective tissue after acute IOP elevation within 3-D histomorpho-metric reconstructions, Invest. Ophthalmol. Vis. Sci 50:5785–99(2009). [DOI] [PMC free article] [PubMed] [Google Scholar]
- [41].Agoumi Y, Sharpe GP, Hutchison DM, Nicolela MT, Artes PH, Chauhan BC, Laminar and prelaminar tissue displacement during intraocular pressure elevation in glaucoma patients and healthy controls, Ophthalmol. 118:52–59(2011). [DOI] [PubMed] [Google Scholar]
- [42].Fatehee N, Yu PK, Morgan WH, Cringle SJ, Yu DY, The impact of acutely elevated intraocular pressure on the porcine optic nerve head, Invest. Ophthalmol. Vis. Sci 52:6192–8(2011). [DOI] [PubMed] [Google Scholar]
- [43].Strouthidis NG, Fortune B, Yang H, Sigal IA, Burgoyne CF, Effect of acute intraocular pressure elevation on the monkey optic nerve head as detected by spectral domain optical coherence tomography, Invest. Ophthalmol. Vis. Sci 52:9431–7(2011). [DOI] [PMC free article] [PubMed] [Google Scholar]
- [44].Sigal IA, Grimm JL, Jan NJ, Reid K, Minckler DS, Brown DJ, Eye-specific IOP-induced displacements and deformations of human lamina cribrosa, Invest. Ophthalmol. Vis. Sci 55:1–15(2014). [DOI] [PMC free article] [PubMed] [Google Scholar]
- [45].Girard MJA, Strouthidis NG, Desjardins A, Mari JM, Ethier CR, In vivo optic nerve head biomechanics: performance testing of a three-dimensional tracking algorithm, J. R. Soc. Interface 10:20130459(2013). [DOI] [PMC free article] [PubMed] [Google Scholar]
- [46].Girard MJA, Beotra MR, Chin KS, Sandhu A, Clemo M, Nikita E, Kamal DS, Papadopoulos M, Mari JM, Aung T, Strouthidis NG, In Vivo 3-Dimensional Strain Mapping of the Optic Nerve Head Following Intraocular Pressure Lowering by Trabeculectomy, Ophthalmol. 123:1190– 1200(2016). [DOI] [PubMed] [Google Scholar]
- [47].Coudrillier B, Geraldes DM, Vo NT, Atwood R, Reinhard C, Campbell IC, Raji Y, albon J, Abel RL, Ethier CR, Phase-contrast micro-computed tomography measurements of the intraocular pressure-induced deformation of the porcine lamina cribrosa, IEEE 35:988–999(2016). [DOI] [PMC free article] [PubMed] [Google Scholar]
- [48].Bar-Kochba E, Toyjanova J, Andrews E, Kim K, Franck C, A fast iterative digital volume correlation algorithm for large deformations, Exp. Mech 55:261–274(2015). [Google Scholar]
- [49].Vendroux G, Knauss WG, Submicron deformation field measurements: part 2. improved digital image correlation, Exp. Mech 38:86–92(1998). [Google Scholar]
- [50].Sutton MA, Cheng MQ, Peters WH, Chao YJ, McNeill SR, Application of an optimized digital correlation method to planar deformation analysis, Image Vis. Comput 4:143–150(1986). [Google Scholar]
- [51].Bay BK, Smith TS, Fyhrie DP, Saad M, Digital volume correlation: Three-dimensional strain mapping using x-ray tomography, Exp. Mech 39:217–226(1999). [Google Scholar]
- [52].Zauel R, Yen Y, Bay B, Dong X, Fyhrie D, Comparison of the linear finite element prediction of deformation and strain of human cancellous bone to 3d digital volume correlation measurements, J. Biomech. Eng. Trans. ASME 128:1–6(2006). [DOI] [PubMed] [Google Scholar]
- [53].Forsberg F, Mooser R, Arnold M, Hack E, Wyss P, 3d micro-scale deformations of wood in bending: synchrotron radiation muct data analyzed with digital volume correlation, J. Struct. Biol 164:255– 262(2008). [DOI] [PubMed] [Google Scholar]
- [54].Roeder B, Kokini K, Robinson J, Voytik-Harbin S, Local, three dimensional strain measurements within largely deformed extracellular matrix constructs, J. Biomech. Eng. Trans. ASME 126:699– 708(2004). [DOI] [PubMed] [Google Scholar]
- [55].Franck C, Hong S, Maskarinec SA, Tirrell DA, Ravichandran G, Three-dimensional full-field measurements of large deformations in soft materials using confocal microscopy and digital volume correlation, Exp. Mech 47:427–438(2007). [Google Scholar]
- [56].Huang J, Pan X, Li S, Peng X, Xiong C, Fang J, A digital volume correlation technique for 3-d deformation measurements of soft gels, Int. J. App. Mech 3:335–354(2011). [Google Scholar]
- [57].Keyes JT, Yan D, Rader JH, Utzinger U, Vande Geest JP, A gimbal-mounted pressurization chamber for macroscopic and microscopic assessment of ocular tissues, J. Biomech. Eng 133:95001(2011). [DOI] [PMC free article] [PubMed] [Google Scholar]
- [58].Cox G, Kable E, Jones A, Fraser I, Manconi F, Gorrell MD, 3-dimensional imaging of collagen using second harmonic generation, J. Struc. Biol 141:53–62(2003). [DOI] [PubMed] [Google Scholar]
- [59].Schindelin J, Arganda-Carreras I, Frise E, Kaynig V, Longair M, Pietzsch T, Preibisch S, Rueden C, Saalfeld S, Schmid B, Tinevez J, White D, Hartenstein V, Eliceiri K, Tomancak P, Cardona A, Fiji: an open-source platform for biological-image analysis, Nature Methods 9:676–682(2012). [DOI] [PMC free article] [PubMed] [Google Scholar]
- [60].Sutton M, Yan J, Tiwari V, Schreier H, Orteu J, The effect of out-of-plane motion on 2D and 3D digital image correlation measurements, Opt. Lasers Eng 46:746–757(2008). [Google Scholar]
- [61].Gloster J, Vertical ovalness of glaucomatous cupping., Br. J. Ophthalmol 59:721–4(1975). [DOI] [PMC free article] [PubMed] [Google Scholar]
- [62].Quigley HA, Varma R, Tielsch JM, Katz J, Sommer A, Gilbert DL, The relationship between optic disc area and open-angle glaucoma: the Baltimore Eye Survey, J. Glaucoma 8:347–52(1999). [PubMed] [Google Scholar]
- [63].Healey PR, Mitchell P, The relationship between optic disc area and open-angle glaucoma, J. Glaucoma 9:203–204(2000). [PubMed] [Google Scholar]
- [64].Pijanka JK, Coudrillier B, Ziegler K, Sorensen T, Meek KM, Nguyen TD, Quigley HA, Boote C, Quantitative mapping of collagen fiber orientation in non-glaucoma and glaucoma posterior human sclerae, Invest. Ophthalmol. Vis. Sci 53:5258–70(2012). [DOI] [PMC free article] [PubMed] [Google Scholar]
- [65].Minkler DS, The organization of nerve fiber bundles in the primate optic nerve head, Arch. Ophthalmol 98:1630–1636(1980). [DOI] [PubMed] [Google Scholar]
- [66].Coudrillier B, Tian J, Alexander S, Myers KM, Quigley HA, Nguyen TD, Biomechanics of the human posterior sclera: age- and glaucoma-related changes measured using inflation testing, Invest. Ophthalmol. Vis. Sci 53:1714–28(2012). [DOI] [PMC free article] [PubMed] [Google Scholar]
- [67].Coudrillier B, Pijanka J, Jefferys J, Sorensen T, Quigley HA, Boote C, Nguyen TD, Collagen structure and mechanical properties of the human sclera: analysis for the effects of age, J. Biomech. Eng 137:041006(2015). [DOI] [PMC free article] [PubMed] [Google Scholar]
- [68].Coudrillier B, Pijanka JK, Jefferys J, Sorensen T, Quigley HA, Boote C, Nguyen TD, Effects of age and diabetes on scleral stiffness, J. Biomech. Eng 137. [DOI] [PMC free article] [PubMed] [Google Scholar]
- [69].Fazio MA, Grytz R, Morris JS, Bruno L, Gardiner SK, Girkin C. a. Downs JC, Age-related changes in human peripapillary scleral strain, Biomech. Model. Mechanobiol 13:551–63(2014). [DOI] [PMC free article] [PubMed] [Google Scholar]
- [70].Grytz R, Fazio MA, Libertiaux V, Bruno L, Gardiner S, Girkin CA, Downs JC, Age- and race-related differences in human scleral material properties, Invest. Ophthalmol. Vis. Sci 55:8163– 72(2014). [DOI] [PMC free article] [PubMed] [Google Scholar]
- [71].Nguyen C, Midgett DE, Kimball EC, Steinhart MR, Nguyen TD, Pease ME, Oglesby EN,Quigley HA, Measuring Deformation in the Mouse Optic Nerve Head and Peripapillary Sclera, IOVS. Under Review (2016). [DOI] [PMC free article] [PubMed] [Google Scholar]
- [72].Hashima AR, Young AA, McCulloch AD, Waldman LK, Nonhomogeneous analysis of epicardial strain distributions during acute myocardial ischemia in the dog, J. Biomech 26:19–35(1993). [DOI] [PubMed] [Google Scholar]
Associated Data
This section collects any data citations, data availability statements, or supplementary materials included in this article.