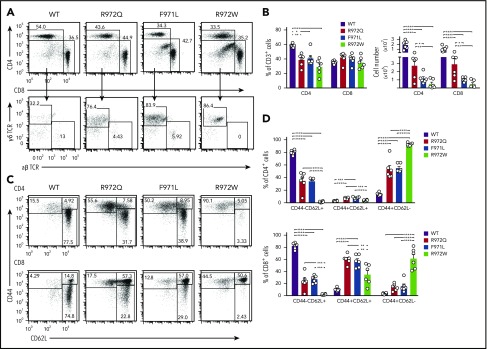
Figure 3.
Distribution and phenotype of splenic T-cell subsets in Rag1-mutant mice. (A) Representative example of CD4+ and CD8+ T cells (top) and of CD4−CD8− cells expressing the γδ form of the TCR (bottom) among splenic CD3+ cells. Percentages (among CD3+ cells) (B) and absolute count of CD4+ and CD8+ cells (C). (C) Gating strategy for naïve (CD62L+CD44−), central memory (CD44+CD62L+), and effector memory T cells (CD44+CD62L−) among CD4+ (top) and CD8+ (bottom) T cells. (D) Distribution of naïve, central memory, and effector memory T cells among total splenic CD4+ (top) and CD8+ (bottom) cells (n = 6 per group). Error bars represent standard error of the mean. (B,D) One-way analysis of variance: *P ≤ .05, **P ≤ .01, ***P ≤ .001, ****P ≤ .0001.

