Figure 6.
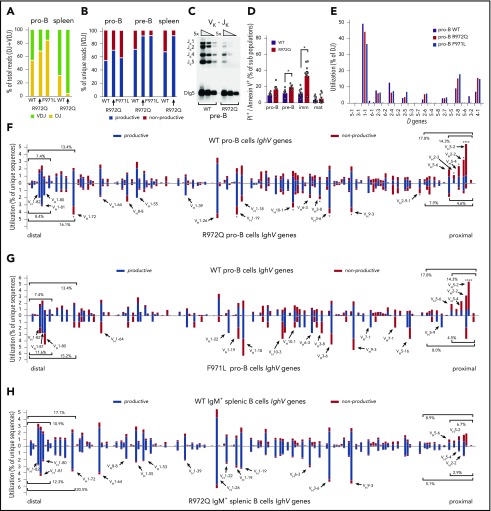
Abnormalities of Igh repertoire in Rag1-mutant mice. (A) Bar graph of Igh VDJ (green) and DJ (yellow) rearrangements as a percentage of total rearrangements recovered in pro-B cells and IgM+ splenocytes. (B) Bar graph of productive (blue) vs nonproductive (red) reads of total unique Igh VDJ rearrangements in pro-B cells, pre-B cells, and IgM+ splenic B cells. (C) Fivefold dilution of input DNA was polymerase chain reaction amplified for Vκ-Jκ LC rearrangements in pre-B cells with loading control (Dlg5). (D) Apoptotic B cells through development were analyzed by flow cytometry using PI and annexin. (E) Frequency of D gene utilization of Igh DJ rearrangements in pro-B cells. (F) Frequency of V gene utilization in unique Igh VDJ rearrangements in pro-B cells. Top shows WT mice; bottom shows R972Q mice. (G) Frequency of V gene utilization in unique Igh VDJ rearrangements in pro-B cells. Top shows WT mice (data as in panel F); bottom shows F971L mice. (H) Utilization of V genes in unique Igh VDJ rearrangements in splenic IgM+ B cells. Top shows WT mice; bottom shows R972Q mice. Mann-Whitney U test (D) and χ2 test (comparing individual V gene usage) (F-G): *P ≤ .05, ****P ≤ .0001. imm, immature; mat, mature.

