Abstract
We evaluated two dual-energy cone-beam computed tomography (DE-CBCT) methodologies for a bench-top micro-CBCT system to reduce metal artifacts on reconstructed images. Two filter-based DE-CBCT methodologies were tested: (i) alternative spectral switching and (ii) simultaneous beam splitting. We employed filters of 0.6-mm-thick tin and 0.1-mm-thick tungsten to generate high- and low-energy spectra from 120 kVp X-rays, respectively. The spectral switching method was imitated by two half scans with different filters (pseudo-switching). Filters were placed and between the X-ray tube and a phantom (‘1-u,’ ‘2-u’), a phantom and a flat panel detector (‘1-d,’ ‘2-d’), and compared with (iii) two half scans at 80 and 140 kVp [pseudo-(80,140)]. For the splitting method, two half-width filters were aligned along a rotating axis. Projections were separated into halves and merged with corresponding areas of opposed projections after one full rotation. A solid 30-mm-diameter acrylic phantom and an acrylic phantom with four 5-mm-diameter titanium rods were used. DE images were generated by weighted summation of the high- and low-energy images. The blending factor was changed from 0 to +5 in increments of 0.01. Relative errors (REs) of the linear attenuation coefficients of the two phantoms and the contrast-to-noise ratios (CNRs) between the titanium and acrylic regions were compared. All methods showed zero REs except for the method (2-d). CNRs for pseudo-switching with upstream placement were 1.4-fold larger than CNRs for the pseudo-(80,140) method. CNRs for the downstream placements were small. It was concluded that the pseudo-switching method with upstream placement is appropriate for reducing metal artifacts.
Keywords: dual-energy, cone-beam computed tomography, filtration, radiotherapy
INTRODUCTION
Computed tomography (CT) technology is important in radiation therapy; for instance, treatment planning for individual patients is based on CT images acquired by multidetector CT (MDCT) [1]. Also, at the time of treatment, the patient set-up can be based on cone-beam CT (CBCT) images for the purpose of image guidance [2]. CBCT images are acquired by a kilovolt X-ray source and a flat panel detector (FPD) mounted on an L-shaped linac perpendicular to the MV beam.
Artifacts in planning CT and CBCT images may lessen treatment accuracy and potentially cause severe side effects for the patient [3]. Especially in CBCT images, metal artifacts produced by metal implants inside a patient may cause inaccuracy in CT numbers and the poor visualization of tumors and internal organs [4]. CT number inaccuracy is a critical problem if the CBCT image is used to calculate the dose of the treatment day. Poor visualization of the tumor may cause unnecessary dose to organs at risk (OARs). Therefore, reduction of metal artifacts is highly desired.
Since the metal artifact produced by metal implants inside a patient, which are, for instance, made of titanium, is caused by the beam-hardening effect for continuous X-ray spectra, one of the metal artifact reduction (MAR) methods is use of a pseudo-monoenergetic X-ray image generated by dual-energy (DE) imaging. A pseudo-monoenergetic X-ray image is generated by using high- and low-energy X-rays. To obtain high- and low-energy data, several methods have been developed and implemented in clinical MDCT scanners: dual-source [5, 6], kVp switching [7], dual-layer detectors [8], and photon-counting detectors [9]. For instance, kVp switching is achieved by rapidly switching high and low X-ray tube voltages over <0.2 ms. Eighty and 140 kVp X-rays are one of the possible tube voltage combinations for DE imaging on MDCT.
Although DE imaging on MDCT has been introduced to treatment planning [10], dual-source or special kV source and detectors, such as mentioned above, have not been implemented in the CBCT system on L-shaped linacs. Also, the maximum gantry speed of an L-shaped linac is slow compared with that of MDCT, and is limited to 6°/s, or 1 rpm, whereas that of MDCT is 1300°/s, or 216.7 rpm. Thus, two full gantry rotations with different kV X-ray energies is a time-consuming method. High- and low-energy data should be collected during one gantry rotation.
The purpose of this study was to propose and demonstrate a new concept of DE imaging methodology for the CBCT system, which can be applied under the existing conditions of kV source and detector specifications, and gantry rotation speed. Thus, we proposed a filter-based DE method in which one X-ray spectrum is divided into high- and low-energy spectra by metal filters. We demonstrated two filter-based DE methods by our bench-top micro-CBCT system, which has a kV-range X-ray tube and 50 × 50 mm2 FPD. CT images of a 30-mm-diameter acrylic phantom with four 5-mm-diameter titanium rods and a solid acrylic phantom were used in both methods. For comparison, the two phantoms were also used in DE imaging, imitating the kVp switching method.
MATERIALS AND METHODS
Image-based dual-energy imaging with spectral filtering methodologies
We used an image-based dual-energy imaging method in this study [5]. CTLow and CTHigh represent CT images that were reconstructed from low- and high-energy projections, respectively. A mixed dual-energy image (CTMix), can be generated as follows:
| (1) |
where w ∈ R+ is a blending factor. R+ is a set of non-negative real numbers. Since optimal blending factors for each of the DE methods might be dependent on each DE geometry, these can be determined by the following experiment and MAR evaluation. The blending factor w used in this study ranged from 0 to +5 with discrete increments of 0.01.
We evaluated two spectral filtering methods: an alternative spectral switching method (Method 1) and a simultaneous beam-splitting method that divides one X-ray spectrum using two separate metal filters (Method 2). In both spectral filtering methods, 0.1-mm-thick tungsten (W) and 0.6-mm-thick tin (Sn) plates (The Nilaco Corporation, Tokyo, Japan) were used as the filters [11]. The purity of the W and Sn plates were 99.95% and 99.9%, respectively. W and Sn plates generated low- and high-energy spectra, respectively.
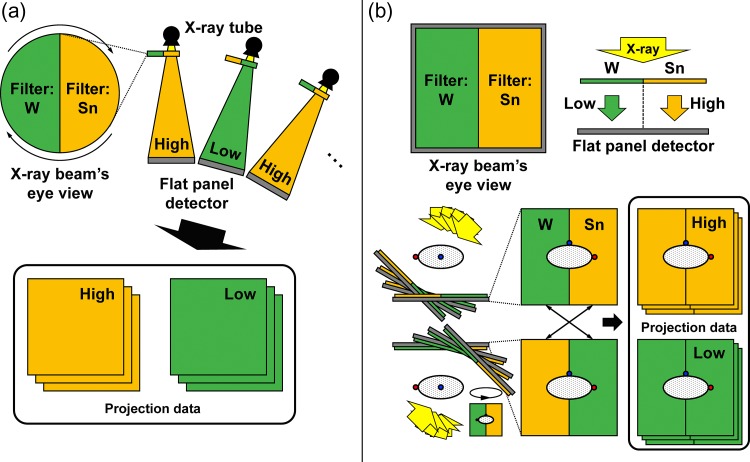
Schematic drawing of the alternative spectral switching method is shown in Fig. 1a. One X-ray spectrum can be filtered to generate low- and high-energy spectra by alternately inserting W and Sn filters between the X-ray source and the detector, ensuring that the alternation of the two filters is fast compared with the maximum gantry rotation speed (6°/s for an L-shaped linac).
Fig. 1.
Schematic drawing for (a) alternative spectral switching and (b) simultaneous beam-splitting methods.
Schematic drawing of the simultaneous beam-splitting method is shown in Fig. 1b. Basically, only half of a gantry rotation is necessary in order to reconstruct the full data of the volume of interest if the beam is parallel. Thus, full gantry rotation gives two full datasets of the volume of interest, and projections at θ and θ + 180° are identical. In the simultaneous beam-splitting method, half-width W and Sn filters are aligned side-by-side along the rotating axis of the gantry. Complete low- or high-energy projections can be obtained by flipping the projection at θ + 180° horizontally and merging each half area to the corresponding half areas of projection at θ, respectively.
Experiment
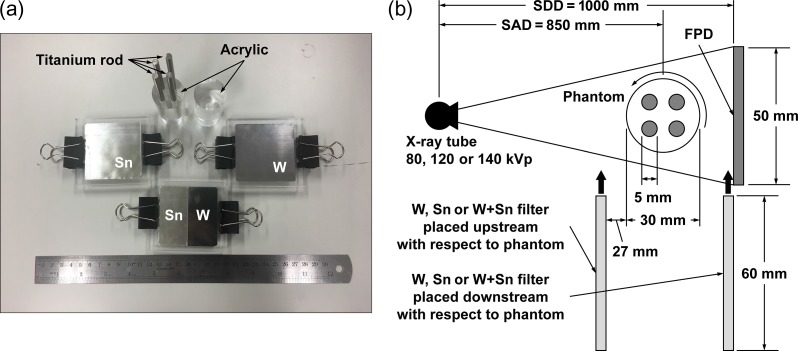
To demonstrate MAR by the different methods, we used W, Sn and W + Sn filters, which are shown in Fig. 2a. W and Sn filters are made of 0.1-mm-thick W and 0.6-mm-thick Sn plates with 60 × 60 mm2 areas, and are sandwiched between two 75 × 70 mm2 acrylic plates (5 mm thick). The W + Sn filter was made of half-width W and Sn plates with 60 × 30 mm2 areas. Two plates were placed next to each other to make a 60 × 60 mm2 plate, which was sandwiched between two 75 × 70 mm2 acrylic plates. One side of the acrylic plate with 60 × 60 mm2 area was machined to a thickness corresponding to W or Sn plate thickness to make a flat surface. Experiments were performed by the in-house bench-top micro-CBCT imaging system, which consists of an X-ray tube (ERESCO 42 MF4, General Electric Co., Ahrensburg, Germany) with a tungsten target and built-in filters made from 0.8-mm-thick beryllium and 2-mm-thick aluminum, an FPD (Remote RadEye2, Teledyne Rad-icon Imaging, Sunnyvale CA, USA) and a rotating stage. The active area of the FPD was ~50 × 50 mm2 (1024 × 1024 pixel2). Pixel size was 48 × 48 μm2. Incident X-ray photons are absorbed by a Gd2O2S scintillator plate, and scintillation photons are detected by a 2D CMOS photodiode array. We used a 30-mm-diameter solid acrylic phantom (acrylic-only phantom) as a reference phantom and a 30-mm-diameter acrylic phantom with four 5-mm-diameter titanium rods located concentrically (acrylic-titanium phantom). A schematic drawing of the experimental set-up is shown in Fig. 2b. The source-to-detector distance was 1000 mm, and the source-to-rotation axis distance was 850 mm. Since the bench-top micro-CBCT system could not rotate the X-ray tube and the FPD, the phantom was rotated.
Fig. 2.
(a) Phantoms and metal filters used for this study. (b) Experimental set-up for in-house bench-top cone-beam CT system. FPD = flat panel detector. SDD = source-to-detector distance. SAD = source-to-rotation axis distance.
In this study, we developed a ‘pseudo-switching’ method to imitate the alternative spectral switching method using W and Sn filters. First, the acrylic-titanium phantom and the acrylic-only phantom were scanned every 1° from 0° to 180° using the W filter. Then, they were scanned every 1° from 0° to 180° using the Sn filter. Thus, projection data were collected by W and Sn filters at each projection angle. Both filters were placed upstream (42 mm before the rotation axis of the phantom, [Method (1-u)]) and downstream (in front of the FPD, [Method (1-d)]) with respect to the phantom.
For the simultaneous beam-splitting method, or simply ‘splitting method’, the two phantoms were scanned every 1° from 0° to 360° using the W + Sn filter placed upstream [Method (2-u)] or downstream [Method (2-d)] with respect to the phantom. As mentioned in Subsection 2.1, the projection at θ was split into half. The projection at θ + 180° was flipped horizontally and merged to the corresponding half areas of the projection at θ to obtain full high- and low-energy projection data.
For comparison, DE imaging with X-ray tube voltages of 80 and 140 kVp was performed. To imitate the kVp switching method, the two phantoms were scanned every 1° from 0° to 180° by 80 kVp X-rays. Then, the same scan was repeated with 140 kVp X-rays. Thus, projection data were scanned by 80 and 140 kVp X-rays at each projection angle. No additional metal filters were employed. We called this CT measurement the pseudo-(80,140) method [Method (3)]. Thus, five DE-CBCT methods were performed. In addition, single-energy CBCT (SE-CBCT) scanning was performed with120 kVp X-rays.
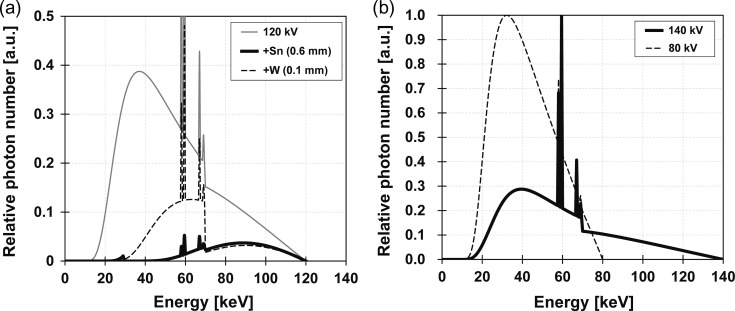
X-ray tube conditions for each DE-CBCT method and SE-CBCT method are shown in Table 1. X-ray tube currents and exposure times were selected as pixel values of projection not to be saturated. In addition, the maximum tube current for the X-ray tube was 9.40 mA. Effective X-ray energies of the 120 kVp X-ray spectrum filtered by W and Sn filters were 64.2 and 84.5 keV, respectively, while mean X-ray energies for 80, 120 or 140 kVp were 41.4, 53.3 and 58.9 keV, respectively. X-ray spectra were calculated by Birch’s formula [12], as shown in Fig. 3. Pixels at the center column of the FPD in the horizontal direction were extracted from each high- or low-energy projection to make high- or low-energy sinograms. No smoothing, beam-hardening, or other corrections were applied for the sinogram. High- and low-energy CT images for the pseudo-switching, the splitting and the pseudo-(80,140) methods were reconstructed using the maximum-likelihood expectation-maximization algorithm [13]. Linear attenuation coefficients (LACs), μ [cm−1], were used as the pixel values of the reconstructed CT images in this study. The mixed dual-energy images were created using equation (1).
Table 1.
X-ray tube conditions for each dual-energy cone-beam computed tomography (CT) method and single-energy cone-beam CT method
| Dual-energy cone-beam CT method | Energy or filter placement | Tube voltage [kVp] | Tube current [mA] | Exposure time [s] | Estimated delivered dose ratio to pseudo-(80,140) method |
|---|---|---|---|---|---|
| Pseudo-(80,140) | Low/High | 80/140 | 7.50/2.50 | 1.00/1.00 | 1.00 |
| Pseudo-switching | Upstream | 120 | 7.50 | 1.00 | 0.24 |
| Downstream | 120 | 3.90 | 0.85 | 0.99 | |
| Splitting | Upstream | 120 | 7.50 | 1.00 | 0.25 |
| Downstream | 120 | 3.90 | 0.85 | 0.99 | |
| Single-energy cone-beam CT | 120 | 2.50 | 1.00 | 0.36 |
pseudo-(80,140) = the method imitating the kVp switching method with 80 and 140 kVp.
Fig. 3.
X-ray spectra for (a) 120 kVp and 120 kVp filtered by 0.6-mm-thick tin plate or 0.1-mm-thick tungsten plate and (b) 80 and 140 kVp.
To compare the difference between DE-CBCT methods and SE-CBCT methods, the delivered dose at the phantom position should be the same as that for all CBCT methods. The following measurements were demonstrated prior to the experiments. To estimate the delivered dose at the phantom position, dose rates [mGy/min] at the rotation axis of the phantom were measured by an EXRADIN A3 REF chamber (Standard Imaging, Middleton, WI, USA) and a RAMTECH 1000plus electrometer (TOYO MEDIC, Tokyo, Japan) in dose rate mode with the phantom being removed. From the dose rate and the exposure time of each set of X-ray tube conditions, delivered doses for each CBCT method were estimated. Therefore, delivered dose ratios to the pseudo-(80,140) method for each CBCT method were obtained and summarized in Table 1.
MAR evaluation
An artifact index (AI) was usually used to quantify the MAR performance, which can be defined as the difference between the squares of the standard deviations (SDs) of the LACs in the MAR region and the background region of the same CT image obtained in clinical practice [14]. However, AI was the compromise indicator of the MAR, since the reference image (which contains no metal material) cannot be obtained in clinical practice. The MAR should be evaluated from the difference between the LAC of the artifact region in the artifact image and that of the corresponding region in the reference image. In this study, the acrylic-titanium and acrylic-only phantoms were scanned using each DE-CBCT method. Thus, the MAR was evaluated from the relative error of the LACs in the artifact region of the acrylic-titanium phantom image compared with that of the corresponding region of the acrylic-only phantom image. In addition, a contrast-to-noise ratio (CNR) between the titanium and acrylic regions in the acrylic-titanium phantom was also calculated.
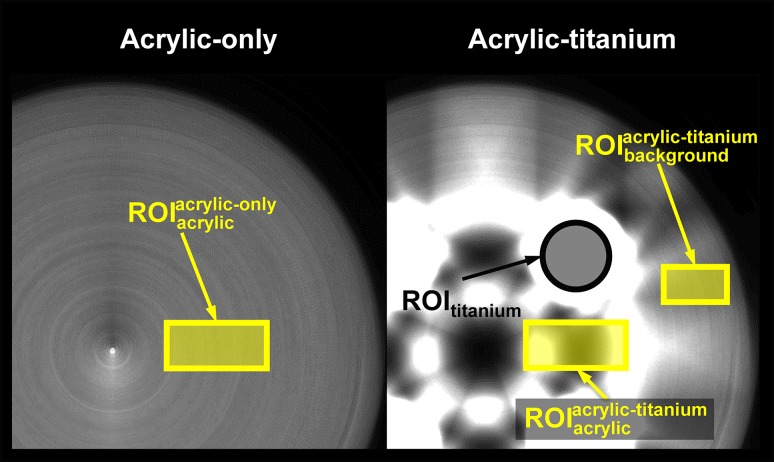
To calculate the relative error, rectangular regions of interest (ROIs) of 150 × 52 pixel2 were set on the reconstructed DE images with a blending factor of w, and they are shown in Fig. 4. and were set on the acrylic between two titanium rods on the acrylic-titanium phantom, in which a metal artifact was generated, and on the corresponding region of the acrylic-only phantom, respectively. Let and , and and be the averaged acrylic LACs and SDs in and on the DE images with a blending factor of w, respectively. A relative error of and for each DE-CBCT method was calculated (), which was defined as
| (2) |
Fig. 4.
Regions-of-interest (ROIs) for titanium and acrylic areas in acrylic-titanium and acrylic-only phantoms.
The blending factor, which showed zero relative error wRE = 0, was determined for each DE-CBCT method.
To consider the contrast between metal and acrylic regions, a CNR between the titanium and acrylic regions was calculated for each DE-CBCT method. A circular ROI of 100 pixels in diameter (ROItitanium) was set across the titanium rod in the acrylic-titanium phantom (Fig. 4). and , and ROItitanium had nearly the same area. Let and be the averaged titanium LACs and SDs in ROItitanium; the CNR of the DE image of the blending factor of w for each DE-CBCT method was defined as
| (3) |
The blending factor, which showed maximum CNR wMaxCNR, was determined for each DE-CBCT method.
To quantify the MAR performance accurately and quantitatively, the relative error and CNR were necessary to be taken into account simultaneously. Thus, we proposed a specific figure-of-merit (FoM) for this study. The proposed FoM of the DE image of blending factor of w for each DE-CBCT method was defined as
| (4) |
σ was the standard deviation of the Gaussian distribution. We assumed that ±2.5% of relative error value ((Range of REacrylic)/100 = 0.05) was expected to have >90% probability of a Gaussian distribution (Pexpect = 0.9). Thus, σ was set as 0.11 in this study. The exponential term in equation (4) shows the proposed FoM should have the highest value at REacrylic = 0 [%], and a non-zero value only around REacrylic = 0 [%]. Thus, the FoM had a small value if the difference between wMaxCNR and wRE = 0 was large. The blending factor, which showed maximum FoM wMaxFoM, was determined for each DE-CBCT method. FoM was a dimensionless quantity and we considered that larger FoM values showed higher MAR performance.
Moreover, the AI was also calculated as a conventional MAR evaluation. The ROI of 100 × 52 pixel2 were set on the background region in the acrylic-titanium phantom (, Fig. 4). Let be the standard deviations in . AIs were calculated for the DE images of the blending factor of w, which was defined as
| (5) |
The blending factor, which showed the minimum AI wMinAI, was determined for each DE-CBCT method.
Due to the limitation of the maximum current of the X-ray tube used in this study, the delivered dose ratios of the pseudo-switching (0.24) and the splitting (0.25) method with filter placed upstream, and that for the SE-CBCT method (0.36), were lower than that of the pseudo-(80,140) method (1.00). Thus, we adjusted the measured standard deviations (multiplied by , and for the pseudo-switching, the splitting, and SE-CBCT methods, respectively) to take the lower dose into account [5, 6].
RESULTS
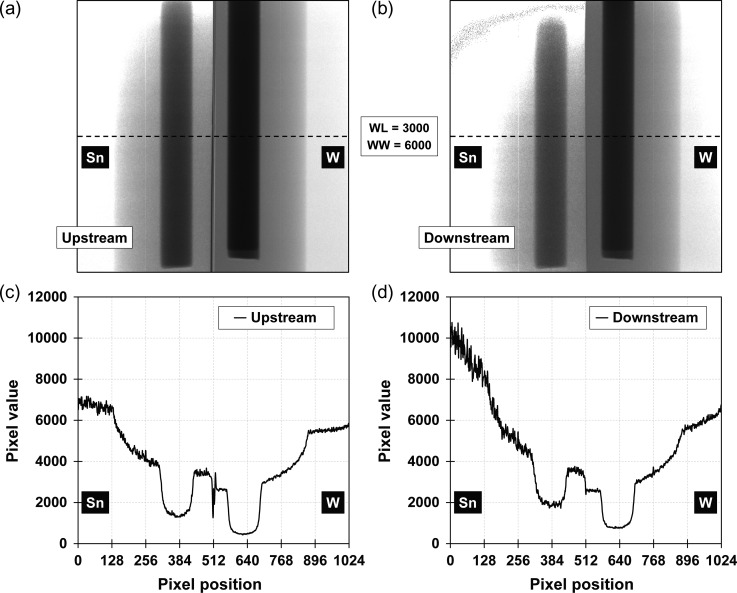
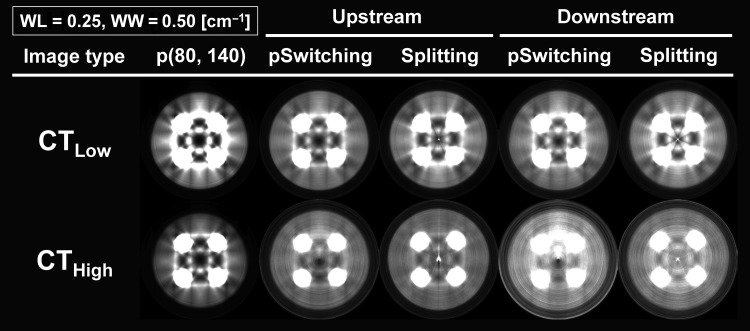
Projections at 0° obtained by the splitting method with the W + Sn filter placed up- and downstream with respect to the phantom are shown in Fig. 5a and b, respectively. The W + Sn filter had an overlapping region at the boundary. Pixel value profiles along the dotted lines for the up- and downstream filter placement are shown in Fig. 5c and d, respectively. The effect of the overlapping region was large for the W + Sn filter placed upstream, since the size of the overlapping region size was magnified by 1.18. This effect would cause the artifact in the center of a reconstructed CT image. In addition, the fluctuations of the pixel value profile obtained in the Sn filter region were larger than those obtained in the W filter region. Fluctuations of the pixel value profile obtained by the downstream filter placement was enhanced due to scattered X-rays from the W + Sn filter. CTLow and CTHigh images for each DE-CBCT method are shown in Fig. 6.
Fig. 5.
Projections at 0° with the filter placed (a) upstream and (b) downstream with respect to the phantom. Although, saturations of pixel value were observed on the upper left corner of each projection, only pixel values on dotted lines of each projections were extracted for the image reconstruction. Pixel profiles on the dotted line of projections for (c) upstream and (d) downstream filter placement. WL = window level, WW = window width.
Fig. 6.
CT images that were reconstructed from low- and high-energy projections (CTLow and CTHigh, respectively) for each filter-based dual-energy cone-beam CT method. p(80,140) = the method imitating the kVp switching method with 80 and 140 kVp, pSwitching = pseudo-switching method, WL = window level, WW = window width.
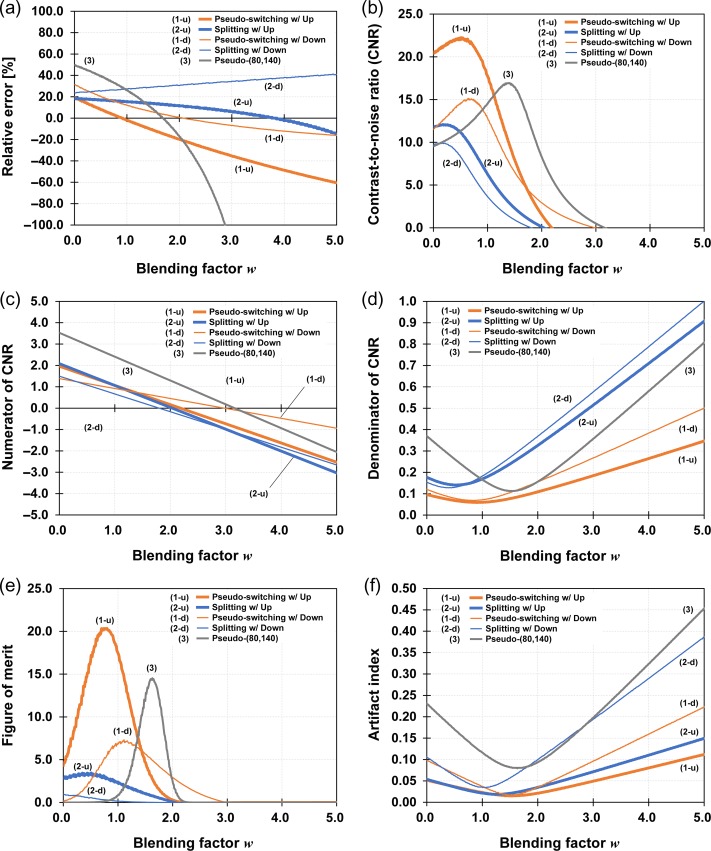
Relative errors given by equation (2) for each DE-CBCT method are shown in Fig. 7a. All methods had the blending factor, which shows zero relative error, wRE = 0, in this range, except for the splitting method with the downstream filter placement. The value wRE = 0 for the method would exist out of range. The value wRE = 0 was high with the use of the splitting method and the downstream filter placement. CNRs, and numerators and denominators of CNRs for each DE-CBCT method, are shown in Fig. 7b–d. CNRs had local maxima for each DE-CBCT method. Each wMaxCNR was nearly the same blending factor, which showed local minima of denominator of CNRs. The CNR for the pseudo-switching method with upstream filter placement was 1.4-fold larger than that for the pseudo-(80,140) method, while other methods had smaller values than that for the pseudo-(80,140) method. CNRs for the upstream filter placement were larger than those for the downstream filter placement. FoMs for each DE-CBCT method are shown in Fig. 7e. Considering the relative errors and CNRs simultaneously, the pseudo-switching method with upstream filter placement had the largest FoM of 20.4, while pseudo-(80,140) method had a FoM of 14.5. The minimum AIs for each DE-CBCT method were 0.02–0.03, except for the pseudo-(80,140), for which AI was 0.08, and they are shown in Fig. 7f. wRE = 0, wMaxCNR and maximum CNR values, wMaxFoM and maximum FoM values, and wMinAI and minimum AI for each DE-CBCT method are summarized in Table 2. Those were optimal blending factors for each evaluation and for each DE-CBCT method in this study.
Fig. 7.
(a) Relative errors, (b) contrast-to-noise ratio (CNR), (c) numerator and (d) denominator of CNR, (e) figure-of-merit and (f) artifact index for each dual-energy cone-beam CT method.
Table 2.
Blending factors that show the zero relative error of the acrylic linear attenuation coefficient (REacrylic), or wMinRE, for each dual-energy cone-beam CT method
| Upstream | Downstream | |||||
|---|---|---|---|---|---|---|
| Evaluation index | p(80,140) | pSwitching | Splitting | pSwitching | Splitting | |
| REacrylic = 0 [%] | w RE = 0 | 1.68 | 0.91 | 3.80 | 2.07 | – |
| CNR | w MaxCNR | 1.41 | 0.51 | 0.18 | 0.65 | 0.13 |
| Maximum | 16.9 | 22.3 | 12.1 | 15.3 | 9.92 | |
| FoM | w MaxFoM | 1.63 | 0.80 | 0.51 | 1.11 | 0.02 |
| Maximum | 14.5 | 20.4 | 3.45 | 7.32 | 0.93 | |
| AI | w MinAI | 1.63 | 1.48 | 1.23 | 1.49 | 1.06 |
| Minimum | 0.08 | 0.02 | 0.02 | 0.02 | 0.03 | |
CNR, FoM and AI had maximum values with blending factors of wMaxCNR, wMaxFoM and wMinAI. wMaxCNR, wMaxFoM or wMinAI are the blending factors that showed maximum CNR, maximum FoM or minimum AI, respectively. p(80,140) = the method imitating the kVp switching method with 80 and 140 kVp, pSwitching = pseudo-switching method, CNR = contrast-to-noise ratio, FoM = figure-of-merit, AI = artifact index.
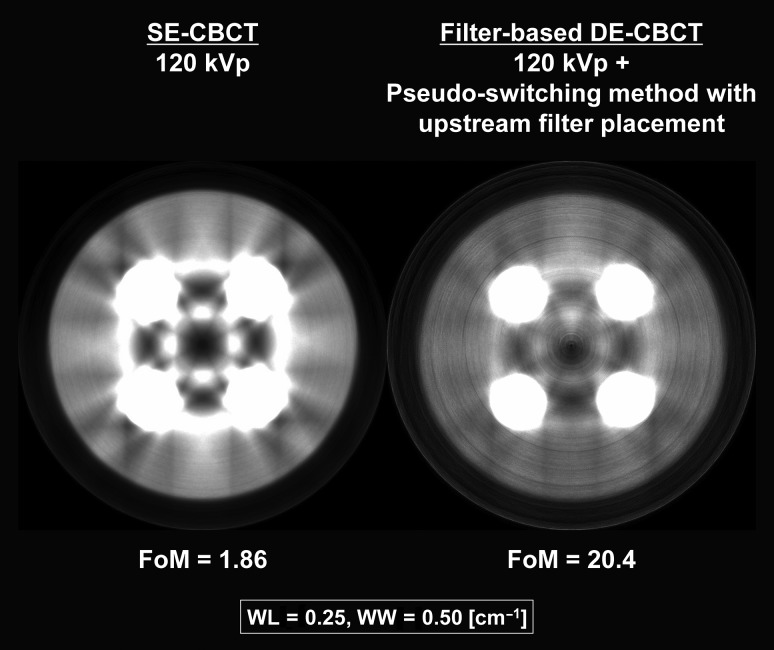
Figure 8 shows the CT images of SE-CBCT and the pseudo-switching method with upstream filter placement, which showed maximum FoM. A metal artifact was evident in the SE-CBCT image. Relative error, CNR, FoM and AI for the SE-CBCT method were 27.0%, 39.6, 1.86 and 0.05, respectively. The metal artifact was visibly and greatly reduced by the pseudo-switching method with upstream filter placement.
Fig. 8.
Images for the single-energy cone-beam CT (SE-CBCT) method and the filter-based dual-energy cone-beam CT (DE-CBCT) method, which showed the maximum figure-of-merit (FoM). WL = window level, WW = window width.
DISCUSSION
The purpose of this study was to propose and prove the new concept of the DE-CBCT method. Therefore, we proposed two filter-based DE-CBCT methodologies and demonstrated those experimentally, comparing them with the DE imaging method imitating the conventional kVp switching method. MAR performances for each method were evaluated from the relative error of acrylic LACs in two phantom images, the CNR between titanium and acrylic LACs, and the combined indicator, FoM. To our knowledge, there were no studies that used such values to evaluate MAR performance. In this study, the pseudo-switching method with upstream filter placement had the largest FoM compared with others, due to the small difference between and wRE = 0 and wMaxCNR. Therefore, the pseudo-switching method with upstream filter placement would be appropriate for MAR. In addition, compared with the SE-CBCT method, the metal artifact was drastically reduced in the pseudo-switching method with upstream filter placement (Fig. 8).
From the results, large changes in the relative errors for the pseudo-(80,140) method were observed, while the relative error changes for the two filter-based DE-CBCT methods were small. This was because the change in the LAC gradually declined as the X-ray spectrum became harder. Note that the effective energies of low- and high-energy components for 120 kVp X-rays filtered by W and Sn plates were 64.2 and 84.5 keV, respectively, whereas those for 80 and 140 kVp were 41.4 and 58.9 keV, respectively. Also, the number of high-energy scattered X-rays from the filter was increased when the metal filters were placed downstream with respect to the phantom. Thus, the relative error change became small in the case of the downstream filter placement. Moreover, since the X-ray beam was split in half in the splitting method, high- and low-energy data were softened and hardened, respectively, by scattered X-rays from the Sn and W plates. The effect described above resulted in the smaller difference between the effective energies after passing W and Sn filters. Thus, the relative error change became small by using the splitting method.
The maximum CNR for the pseudo-switching method with the upstream filter placement was larger than that for the pseudo-(80,140) method, while those for the other proposed methods were small. The numerator of the CNR depends on the X-ray energy, since the difference between the LACs is large when the X-ray energy is low. Thus, the numerator of the CNR for the pseudo-(80,140) method had larger values than those for other methods in almost all the blending factor range. However, the definition of the CNR contains the square-root of the sum of squares of standard deviations in the denominator and highly depends on the denominator. Local minima of the denominator for the pseudo-(80,140) and the pseudo-switching methods with the upstream filter placement were 0.12 and 0.06, respectively. Thus, the pseudo-switching methods with the upstream filter placement had a larger CNR value than other DE-CBCT methods. In addition, CNR values for the splitting methods were small. That was because the amount of scattered X-rays was large, thus making the denominator of CNR large. Note that the CNR for the SE-CBCT method showed the highest value, even when a metal artifact was produced. MAR should not be evaluated only with CNR values. Thus, the FoM was recommended.
Moreover, the AI was also calculated for comparison purposes. In Fig. 7f, the difference between the proposed filter-based DE-CBCT methods and the pseudo-(80,140) method could be detected. However, differences between each filter-based DE-CBCT method could not be detected, since the sensitivity of the AI was small. In addition to the above, especially, from the point of view of the definition, the FoM was a good indicator for accurate and quantitative MAR performance evaluation.
Several authors developed the DE-CBCT methodology [15–18]. However, they collected high- and low-energy projections by scanning the inspected subject twice. As mentioned above, since the maximum gantry rotation speed of an L-shaped linac is limited to 6°/s, two scans is time-consuming. Yamazaki et al. developed the asymmetric-filter DE-CBCT methodology [19]. They considered DE-CBCT methodologies such as the simultaneous beam-splitting method, which can give high- and low-energy projection data in one gantry rotation. However, the asymmetric-filter DE-CBCT methodology was only demonstrated in silico. With the results of this study, we proved that the simultaneous beam-splitting method can reduce a metal artifact on CBCT images. However, this method will produce additional artifacts in the center of the CT image if an overlapping region between the two filters exists.
One way to achieve the alternative spectral switching method on a clinical CBCT system is to use a rotating disk attached to two half-filters. For instance, to obtain each high- and low-energy projection, for every one-degree gantry rotation with 6°/s, the filter rotation speed should be ~1080°/s, or 180 rpm, and can be achieved easily. In addition, one should note that the differences between the bench-top micro-CBCT system and the clinical CBCT system for the L-shaped linac are the size of a FPD and the existence of a couch for setting a phantom or a patient. The size of a typical FPD mounted on an L-shaped linac is 300 × 400 mm2, whereas the size of an FPD for the bench-top micro-CBCT system is 50 × 50 mm2. Also, patients are always on the couch; thus, not only the patient but also the couch is projected to all projections.
Two limitations existed in this study. First, the reconstruction of pseudo-(80,140) data and pseudo-switching data were based on ideal conditions that did not consider the angle gap between high- and low-energy projections. For the use of the rotating disk filter, such sparseness of projection angles should be considered. Second, the proposed filter-based DE-CBCT methods were not demonstrated by an anthropomorphic phantom and clinical CBCT system, but by a bench-top micro-CBCT system. Since the purpose of this study was to propose and prove the new concept of the DE-CBCT method, the filter-based DE-CBCT was demonstrated by the simple phantom. In addition, several modifications were required in order to demonstrate the proposed methods on the clinical CBCT system for linac, as follows: (i) it is difficult to remove the external housing of the kilovolt source and detector and attach the metal filters directly, and (ii) the system cannot irradiate kilovolt X-rays with flexible tube conditions. Demonstration of the proposed DE-CBCT method on a clinical CBCT system is a future work.
CONCLUSION
We proposed and proved filter-based DE-CBCT methodologies on a bench-top micro-CBCT system. Two filter-based methods were tested for their ability to reduce a metal artifact generated by four titanium rods inserted in an acrylic phantom. Based on the experiment and its evaluation, switching metal filters alternatively between the X-ray tube and the phantom would result in substantial MAR.
ACKNOWLEDGEMENTS
We thank Libby Cone, MD, MA, from Edanz Group Japan (www.edanzediting.com/ac) for editing a draft of this manuscript.
CONFLICT OF INTEREST
The authors declare that there are no conflicts of interest.
FUNDING
This research was supported, in part, by the Japan Society for the Promotion of Science (JSPS) Grant-in-Aid for JSPS Fellows (No. 16J08928).
REFERENCES
- 1. Hobday P, Hodson NJ, Husband J et al. Computed tomography applied to radiotherapy treatment planning: techniques and results. Radiology 1979;133:477–82. [DOI] [PubMed] [Google Scholar]
- 2. Jaffray DA, Siewerdsen JH, Wong JW et al. Flat-panel cone-beam computed tomography for image-guided radiation therapy. Int J Radiat Oncol Biol Phys 2002;53:1337–49. [DOI] [PubMed] [Google Scholar]
- 3. Barrett JF, Keat N. Artifacts in CT: recognition and avoidance. Radographics 2004;24:1679–91. [DOI] [PubMed] [Google Scholar]
- 4. Korpics M, Johnson P, Patel R et al. Metal artifact reduction in cone-beam computed tomography for head and neck radiotherapy. Technol Cancer Res Treat 2016;15:NP88–94. [DOI] [PubMed] [Google Scholar]
- 5. Yu L, Primak AN, Liu X et al. Image quality optimization and evaluation of linearly mixed images in dual-source dual-energy CT. Med Phys 2009;36:1019–24. [DOI] [PMC free article] [PubMed] [Google Scholar]
- 6. Yu L, Christner JA, Leng S et al. Virtual monochromatic imaging in dual-source dual-energy CT: radiation dose and image quality. Med Phys 2011;38:6371–9. [DOI] [PMC free article] [PubMed] [Google Scholar]
- 7. Matsumoto K, Jinzaki M, Tanami Y et al. Virtual monochromatic spectral imaging with fast kilovoltage switching: improved image quality as compared with that obtained with conventional 120-kVp CT. Radiology 2011;259:257–62. [DOI] [PubMed] [Google Scholar]
- 8. Carmi R, Naveh G, Altman A. Material separation with dual-layer CT. IEEE Nucl Sci Symp Conf Rec 2005;4:1876–78. [Google Scholar]
- 9. Schlomka JP, Roessl E, Dorscheid R et al. Experimental feasibility of multi-energy photon-counting K-edge imaging in pre-clinical computed tomography. Phys Med Biol 2008;53:4031–47. [DOI] [PubMed] [Google Scholar]
- 10. van Elpmt W, Landry G, Das M et al. Dual energy CT in radiotherapy: current applications and future outlook. Radiother Oncol 2016;119:137–44. [DOI] [PubMed] [Google Scholar]
- 11. Almeida IP, Schyns LEJR, Öllers MC et al. Dual-energy CT quantitative imaging: a comparison study between twin-beam and dual-source CT scanners. Med Phys 2017;44:171–9. [DOI] [PubMed] [Google Scholar]
- 12. Birch R, Marchall M. Computation of Bremsstrahlung X-ray spectra and comparison with spectra measured with a Ge(Li) detector. Phys Med Biol 1979;24:505–17. [DOI] [PubMed] [Google Scholar]
- 13. Shepp LA, Vardi Y. Maximum likelihood reconstruction for emission tomography. IEEE Trans Med Imaging 1982;1:113–22. [DOI] [PubMed] [Google Scholar]
- 14. Kuya K, Shinohara Y, Kato A et al. Reduction of metal artifacts due to dental hardware in computed tomography angiography: assessment of the utility of model-based iterative reconstruction. Neuroradiology 2017;59:231–5. [DOI] [PubMed] [Google Scholar]
- 15. Gang GJ, Zbijewski W, Stayman JW et al. Cascaded systems analysis of noise and detectability in dual-energy cone-beam CT. Med Phys 2012;39:5145–56. [DOI] [PMC free article] [PubMed] [Google Scholar]
- 16. Li H, Giles W, Ren L et al. Implementation of dual-energy technique for virtual monochromatic and linearly mixed CBCTs. Med Phys 2012;39:6056–64. [DOI] [PubMed] [Google Scholar]
- 17. Zbijewski W, Gang GJ, Xu J et al. Dual-energy cone-beam CT with a flat-panel detector: effect of reconstruction algorithm on material classification. Med Phys 2014;41:021908. [DOI] [PMC free article] [PubMed] [Google Scholar]
- 18. Zhao W, Xing L, Zhang Q et al. Segmentation-free x-ray energy spectrum estimation for computed tomography using dual-energy material decomposition. J Med Imaging 2017;4:023506. [DOI] [PMC free article] [PubMed] [Google Scholar]
- 19. Yamazaki Y, Toda N. Asymmetric-filter cone-beam dual-energy computed tomography. IEEE Nucl Sci Symp Conf Rec 2012;4:1876–78. [Google Scholar]


