

Abstract
A better understanding of the genetic underpinning of total energy, carbohydrate, and fat intake is a prerequisite to develop personalized dietary recommendations. For this purpose, we systematically reviewed associations between single nucleotide polymorphisms (SNPs) and total energy, carbohydrate, and fat intakes. Four databases were searched for studies that assessed an association between SNPs and total energy, carbohydrate, and fat intakes. Screening of articles and data extraction was performed independently by 2 reviewers. Articles in English or German language, published between 1994 and September 2017, on human studies in adults and without specific populations were considered for the review. In total, 39 articles, including 86 independent loci, met the inclusion criteria. The fat mass and obesity–associated (FTO) gene as well as the melanocortin 4 receptor (MC4R) locus were most frequently studied. Limited significant evidence of an association between the FTO SNP rs9939609 and lower total energy intake and between the MC4R SNP rs17782313 and higher total energy intake was reported. Most of the other identified loci showed inconsistent results. In conclusion, there is no consistent evidence that the investigated SNPs are associated with and predictive for total energy, carbohydrate, and fat intakes.
Keywords: genetic variant, single nucleotide polymorphism, carbohydrate intake, fat intake, energy intake, nutrigenomic
Introduction
Overweight and obesity have become a worldwide health problem. Between 1975 and 2014, the prevalence of obesity has more than doubled (1, 2). According to the WHO, 39% of adults were overweight and 13% were obese in 2014 (3). The obesity epidemic is mainly due to the modern lifestyle, which is characterized by low physical activity and a high consumption of energy-dense food (4). However, genetic factors also play a substantial role in the pathogenesis of obesity (5). To date, >100 loci have been identified for an association with BMI (6, 7), but the causal genetic variants and their underlying biological mechanisms are largely unknown. Furthermore, a modification of eating behaviors by genetic variants has been described (8).
In addition, studies have shown a considerable interindividual variation in metabolic responses to defined meal challenges (9, 10). This variability may be partly explained by genetic influences, and there is growing interest to better understand the gene-diet associations. The identification of associations as well as interactions between loci and dietary intake may help to elucidate the molecular pathways that link them with body weight. More research on these interactions has been recently promoted by an NIH Working Group (11). There are currently major efforts to investigate the association between genetic factors and dietary intake. For instance, loci associated with obesity are expressed in the brain (12, 13), assuming a potential role in eating behavior and food preferences. A recent genomewide association study (GWAS) suggested that genetic variants are associated with macronutrient consumption in observational studies (14). In addition, in 3 independent populations a gene-diet interaction on obesity has been shown for an APOA2 polymorphism and saturated fat intake (15). In that context, most of the literature tackles the fat mass and obesity–associated (FTO) gene or consists of single findings from candidate gene studies without any replication. Further challenges include imprecise assessment of dietary intake, a high heterogeneity in study design, as well as the loss of standardized statistical models.
The general vision of these research activities is that genotype-based dietary recommendations may become a more effective approach for weight management and disease prevention. So far, the Food4Me project provided evidence that the personalized intervention groups lost more weight than the control group. However, integrating the information on different genetic variants into the personalized dietary recommendations had no benefit for weight loss (16, 17). Against this background, several commercially available genetic tests (direct-to-consumer tests) are currently offered with the promise to provide reliable information for better prevention or treatment of obesity and related metabolic disturbances (18). However, a strong evidence base for these tests is currently lacking.
Therefore, the aim of this study was to perform a systematic literature search to study potential associations between genetic variants and total energy, carbohydrate, and fat intakes and to provide a better knowledge base for future direct-to-consumer tests. The results will be beneficial for hypotheses of clinical trials on gene-diet interactions. They should also serve to develop more robust personalized dietary recommendations and, finally, to improve the prevention and treatment of obesity and metabolic diseases.
Methods
This systematic review was performed according to the guidelines on systematic reviewing methodology (19) and the Preferred Reporting Items for Systematic Reviews (PRISMA) have been considered (20). This review was registered in the International Prospective Register of Systematic Reviews (PROSPERO; registration no. CRD42015025738).
Search Strategy
The 4 electronic databases the Cochrane Library, Web of Science, PubMed, and Embase were searched for articles published between 1994 and September 2017. The search terms used were “genetic variant,” “gene variant,” “genotype,” “single nucleotide polymorphism,” “SNP,” “FTO,” “FABP,” “PPARG,” “ADRB,” “APOA2,” and “APOA5.” Due to biological knowledge [e.g., PPAR γ (PPARG) (21)] as well as due to application in direct-to-consumer tests (e.g., bodykey by NUTRILITE, Amway GmbH, Puchheim, Germany), the search terms included some selected gene names. In particular, the FTO locus as the genomic region with the strongest effect on body weight was specifically included in the literature search (7, 22). Furthermore, due to gene-diet interactions in clinical research studies, APOA2 and APOA5 were specifically included (15). For the search strategy, the genetic terms were combined with the Boolean operator “OR.” The second search terms related to nutrition included “diet,” “energy intake,” “macronutrient intake,” “carbohydrate intake,” and “fat intake.” The nutritional search terms were combined with the Boolean operator “OR.” The genetic and nutritional search terms were combined with the Boolean operator “AND.” Depending on the database, plural forms of the search terms as well as quotation marks were used (Supplemental Material). Additional articles were identified through a hand-search of the reference lists of relevant publications.
Article Screening and Selection
All of the records identified through the electronic database search were imported into the reference management software EndNote X7 (Thomsen Reuters). After the removal of duplicates, 2 independent reviewers (TD and JG) assessed titles, abstracts, and full-text articles for eligibility according to the following inclusion criteria: articles in English or German language, published between 1994 and September 2017, and in adults. Animal studies as well as studies focusing on specific populations such as pregnant or breastfeeding women or patients with cancer or other severe diseases were excluded. Furthermore, articles investigating the association between single nucleotide polymorphisms (SNPs) and the intake of food groups or the adherence to a specific diet without analyzing the association with total energy, carbohydrate, or fat intakes were not considered. Publications on copy number variations, dietary patterns, or interaction terms with no clear analysis of SNPs and energy, carbohydrate, or fat intakes were not included in this systematic review. Because protein intake accounts for fewer calories than carbohydrate and fat intakes, it has a minor contribution to energy balance. Furthermore, dietary recommendations for weight loss usually do not refer to protein intake (23, 24). Thus, protein intake was not considered. Reasons for excluding articles were documented. Throughout the article screening, discrepancies between the 2 reviewers were discussed with a third reviewer (CH). The review team contacted authors if additional information was required.
Data Extraction
Two independent reviewers extracted the data from relevant articles into an Excel spreadsheet in order to synthesize results narratively and in a tabular form. Data extraction included the study design, study participants, intervention, primary and secondary outcomes, sample size, statistical methods, and assessment of total energy, carbohydrate, and fat intakes. Results for an association between SNPs and total energy, carbohydrate, and fat intakes were documented. Inconsistencies during data extraction were discussed with the third reviewer. Furthermore, the linkage disequilibrium (LD) based on the genotype data for the CEU population (i.e. Utah residents with Northern and Western European ancestry) was used in order to summarize and interpret findings (25, 26). LD plots for the FTO and MC4R SNPs are shown in Supplemental Figures 1 and 2.
The results were reported in a tabular synthesis, separately for each genotype according to the number of publications per single locus. In the narrative synthesis, each SNP was discussed for an association with total energy, carbohydrate, and fat intakes without quality assessment of the articles. Loci
published in only 1 article are listed in Supplemental Table 1.
Results
Articles Identified
The initial database search identified 14,692 articles (Figure 1). Thirty-nine articles reported findings on the association between SNPs and total energy, carbohydrate, or fat intakes. These articles met the inclusion criteria according to the PICOS (Participants, Intervention, Comparator, Outcome, Study design) statement for systematic literature search (Participants: adults without severe diseases and nonpregnant or nonbreastfeeding women; Intervention: not described; Comparator: SNPs and loci; Outcome: total energy, carbohydrate, and fat intakes; Study design: all kind of studies). Twenty articles presented loci that were described only in a single study (Supplemental Table 1). SNPs that were investigated in >1 study were reviewed according to the number of articles and the analyzed SNPs.
FIGURE 1.

Flow chart of the systematic literature search according to Moher et al. (20).
Characteristics of Included Studies
The publication dates of articles ranged between 2000 and 2017. More than 80% of the articles (n = 32) represented cross-sectional, cohort, or case-control studies. Two postprandial studies and 5 meta-analyses were included in the current review. The sample sizes ranged from 20 to 29,480
subjects and ≤213,173 individual participants in the meta-analyses. FFQs, food records, or dietary recalls were applied for the assessment of dietary intake. However, most studies (n = 25) used FFQs. The included studies differed in terms of population characteristics such as BMI, sex distribution, disease status, and ethnicity, as well as statistical methods applied (Tables 1–3, Supplemental Table 1). Furthermore, FTO and MC4R SNPs differed in low and high LD values (Supplemental Figures 1 and 2).
TABLE 1.
Association between SNPs within FTO locus and total energy, carbohydrate, and fat intakes1
| SNP and study type | Study population | Study characteristics according to methods and results sections | n (M/F) | Dietary assessment | Dietary data | P | Results | First author (year) (ref) |
|---|---|---|---|---|---|---|---|---|
| rs99396092 | ||||||||
| Case-control study | Not specified (Nigerian study) | Study in 103 people with obesity estimated as BMI ≥ 25 and 98 controls; mean age: 22.64 ± 3.6 y; mean BMI: 25.96 ± 3.1 | 201 (99/102) | FFQ | Energy (kcal/d) | <0.0013 | 354.4 kcal/d more energy intake per risk A allele (estimated change per unit A allele ß = 354.40 kcal/d) | Oyeyemi et al. (2017) (27) |
| Cross-sectional study | European | Mean age: 40.4 ± 13.0 y; mean BMI: 25.5 ± 4.8 | 1277 (536/741) | FFQ, online food habit questionnaire | Energy (kJ) | 0.9274 | Livingstone et al. (2016) (28) | |
| Carbohydrate (%E) | 0.9594 | |||||||
| Fat (%E) | 0.5954 | |||||||
| Systematic review and meta-analysis | White, Asian, Hispanic, African American, mixed | Mean age: 53.0 ± 9.6 y; mean BMI: 26.6 ± 2.5 (19.4–36.3) | 213,173 | FFQ, dietary recall, food diaries | Energy (kcal/d) | 0.0285 | Lower total energy intake in FTO risk genotype (ß = –0.158 kcal/kg body weight per day); without adjustment: 6.46 kcal/d for each copy of the risk allele | Livingstone et al. (2015) (29) |
| Carbohydrate (%E) | 0.0055 | FTO risk allele carriers consumed less carbohydrates (ß = –0.002) | ||||||
| Fat (%E) | 0.0045 | FTO risk allele carriers consumed less fat (ß = –0.003) | ||||||
| Cross-sectional study (meta-analysis) | White, African American, Asian | Age range: 31–75 y; BMI range: 22.1–31.6 | 177,330 (62,275/115,055) | FFQ, dietary record, recall | Energy (kcal/d) | 0.0026 | FTO A risk allele associated with lower total energy intake (ß = –5.9 kcal/d) | Qi et al. (2014) (30) |
| Carbohydrate (g/d) | 0.0707 | |||||||
| Carbohydrate (%E) | 0.0806 | |||||||
| Fat (g/d) | 0.3007 | |||||||
| Fat (%E) | 0.6906 | |||||||
| White | NA | 154,439 | Energy (kcal/d) | <0.0016 | Lower energy intake per A risk allele (ß = –7.2 kcal/d) | |||
| Carbohydrate (g/d) | 0.1007 | |||||||
| Carbohydrate (%E) | 0.1006 | |||||||
| Fat (g/d) | 0.4407 | |||||||
| Fat (%E) | 0.8506 | |||||||
| African American | NA | 5776 | Energy (kcal/d) | 0.7006 | ||||
| Carbohydrate (g/d) | 0.4307 | |||||||
| Carbohydrate (%E) | 0.7706 | |||||||
| Fat (g/d) | 0.6807 | |||||||
| Fat (%E) | 0.9206 | |||||||
| Asian | NA | 17,115 | Energy (kcal/d) | 0.2006 | ||||
| Carbohydrate (g/d) | 0.5307 | |||||||
| Carbohydrate (%E) | 0.5306 | |||||||
| Fat (g/d) | 0.3207 | |||||||
| Fat (%E) | 0.3906 | |||||||
| Postprandial study | Not specified (English study) | Mean age: 32.1 ± 9.1 y; mean BMI: 26.8 ± 1.6 | 40 (40/0) | Ad libitum lunch | Energy (kJ/d) | 0.3358 | Dougkas et al. (2013) (31) | |
| Cross-sectional study | Not specified (Swedish Study) | Mean age: 58.0 ± 7.6 y; mean BMI: 25.8 ± 4.1 | 29,480 (11,754/17,726) | 7-d menu book, FFQ | Energy (kcal/d) | 0.0019 | A risk allele associated with lower total energy intake (ß = –17.62 kcal/d) | Rukh et al. (2013) (32) |
| Carbohydrate (%E) | 0.2209 | |||||||
| Fat (%E) | 0.6909 | |||||||
| Cross-sectional study | Not specified (Brazilian study) | Patients with type 2 diabetes; mean age according to genotype: TT = 57.8 ± 10.3 y, AT = 60.7 ± 12.3 y, AA = 58.3 ± 13.8 y; mean BMI according to genotype: TT = 28.8 ± 3.8, AT = 28.8 ± 4.6, AA = 29.5 ± 4.9 | 126 (0/126) | 3-d weighed diet record | Energy (kJ/d) | 0.629 | Steemburgo et al. (2013) (33) | |
| Carbohydrate (%E) | 0.409 | |||||||
| Fat (%E) | 0.019 | AA genotype higher fat intake | ||||||
| Patients with type 2 diabetes; mean age according to genotype: TT = 59.0 ± 8.9 y, AT = 63.1 ± 7.6 y, AA = 59.9 ± 8.7 y; mean BMI according to genotype: TT = 28.3 ± 4.1, AT = 28.1 ± 3.9, AA = 28.8 ± 4.7 | 110 (110/0) | Energy (kJ/d) | 0.047 | AA genotype higher energy intake | ||||
| Carbohydrate (%E) | 0.072 | |||||||
| Fat (%E) | 0.823 | |||||||
| Cohort study | Finnish | Mean age of intervention group: 55.4 ± 7.2 y; mean BMI: 31.4 ± 4.6; mean age of control group: 54.9 ± 6.9 y; mean BMI: 31.0 ± 4.4 | 479 (160/319) | 3-d food record | Energy (kJ/d) | 0.7263 | Lappalainen et al. (2012) (34) | |
| Carbohydrate (%E) | 0.51010 | |||||||
| Fat (%E) | 0.65010 | |||||||
| Cross-sectional study | African American, American Indian/Alaska Native, Asian/Pacific Islander, white, other | Patients with type 2 diabetes: mean age: 57.6 ± 7.2 y; mean BMI: 36.3 ± 6.1 | 2075 (912/1163) | FFQ | Energy (kcal/d) | 0.15811 | McCaffery et al. (2012) (35) | |
| Carbohydrate (%E) | 0.58712 | |||||||
| Fat (%E) | 0.13212 | |||||||
| Cross-sectional study | Aboriginal Canadian, Chinese, European, South Asian | Age range between 30 and 65 y | 706 (351/355) | Dietary records | Energy (kcal/d) | 0.0453 | Higher energy intake per minor A allele (ß = 4.2 kcal/d) | Lear et al. (2011) (36) |
| Carbohydrate (%E) | 0.3453 | |||||||
| Fat (%E) | 0.3803 | |||||||
| Aboriginal Canadian | Mean age: 45.4 ± 8.1 y; mean BMI: 29.6 ± 5.3 | 131 (66/65) | Energy (kcal/d) | 0.3123 | ||||
| Carbohydrate (%E) | 0.0493 | Lower carbohydrate intake per minor A allele (ß = –2.2%E) | ||||||
| Fat (%E) | 0.1503 | |||||||
| Chinese | Mean age: 48.0 ± 8.1 y; mean BMI: 25.7 ± 3.5 | 202 (92/110) | Energy (kcal/d) | 0.4573 | ||||
| Carbohydrate (%E) | 0.4403 | |||||||
| Fat (%E) | 0.3223 | |||||||
| European | Mean age: 50.8 ± 9.1 y; mean BMI: 27.8 ± 5.1 | 184 (93/91) | Energy (kcal/d) | 0.3873 | ||||
| Carbohydrate (%E) | 0.0073 | Higher carbohydrate intake per minor A allele (ß = 2.3%E) | ||||||
| Fat (%E) | 0.0843 | |||||||
| South Asian | Mean age: 45.0 ± 8.4 y; mean BMI: 27.9 ± 5.0 | 189 (100/89) | Energy (kcal/d) | 0.4383 | ||||
| Carbohydrate (%E) | 0.1883 | |||||||
| Fat (%E) | 0.1873 | |||||||
| Cross-sectional study | Scottish | Mean age according to genotype: TT 43.8 ± 1.6 y, AT 43.8 ± 1.4 y, AA 43.6 ± 2.1 y; mean BMI according to genotype: TT 26.4 ± 0.9, AT 26.8 ± 0.7, AA 25.9 ± 1.2 | 150 (43/107) | 7-d weighed food record, food diary | Energy (kJ/d) | 0.024 | AT/AA genotypes have higher daily energy intake (AT: 10.2 MJ/d; AA: 9.5 MJ/d) than TT genotype (9.0 MJ/d) | Speakman et al. (2008) (37) |
| Carbohydrate (g/d) | 0.095 | |||||||
| rs142108513 | ||||||||
| Cross-sectional study | Diverse racial and ethnic groups (non-Hispanic white, African American, Hispanic, Asian/Pacific Islander, American Indian) | Participants with impaired glucose tolerance and at high risk of diabetes; mean age: 50.8 ± 10.6 y; mean BMI: 34.0 ± 6.6 | 3180 (1047/2133) | FFQ | Energy (kcal/d) | 0.29814 | McCaffery et al. (2017) (38) | |
| Carbohydrate (%E) | NS | |||||||
| Fat (%E) | NS | |||||||
| Non-Hispanic white | 1796 (56.5% female) | FFQ | Energy (kcal/d) | 0.03214 | Significant higher energy intake per copy of minor allele C (ß = 47.54 kcal/d) | |||
| Fat (%E) | 0.04214 | Nominal association between minor allele and greater fat intake (ß = 0.37%E) | ||||||
| Cross-sectional study | African American, American Indian/Alaska Native, Asian/Pacific Islander, white, other | Patients with type 2 diabetes: mean age: 57.6 ± 7.2 y; mean BMI: 36.3 ± 6.1 | 2075 (912/1163) | FFQ | Energy (kcal/d) | 0.06711 | Each copy of the risk C allele associated with higher percentage of energy derived from fat (ß = 0.522%E) | McCaffery et al. (2012) (35) |
| Carbohydrate (%E) | 0.14712 | |||||||
| Fat (%E) | 0.01912 | |||||||
| rs805013615 | ||||||||
| Cross-sectional study (meta-analysis) | African American, Asian American, Latino, Pacific Islander, European American, other | NA | 36,973 | FFQ, 24-h dietary recall | Energy (kcal/d) | 0.38016 | Park et al. (2013) (39) | |
| Carbohydrate (%E) | <0.00116 | Lower carbohydrate intake per-allele change (A allele) (ß = –0.2796%E) | ||||||
| Fat (%E) | <0.00116 | Higher fat intake per-allele change (A allele) (ß = 0.2244%E) | ||||||
| African American, Asian American, Latino, Pacific Islander, European American (MEC) | Mean age: 68 y (62–74 y); mean BMI: 26.1 (23.6–29.2) | 19,529 (10,096/9433) | FFQ | Energy (kcal/d) | 0.90016 | |||
| Carbohydrate (%E) | 0.00516 | Lower carbohydrate intake per-allele change (A allele) (ß = –0.2624%E) | ||||||
| Fat (%E) | 0.00316 | Higher fat intake per allele change (A allele) (ß = 0.2206%E) | ||||||
| African American, European American (CALiCo: ARIC) | Mean age: 54 y (49–59 y); mean BMI: 26.4 (23.7–29.8) | 11,114 (4957/6157) | FFQ | Energy (kcal/d) | 0.03016 | Lower energy intake per-allele change (ß = –0.0103 kcal/d) | ||
| Carbohydrate (%E) | 0.00316 | Lower carbohydrate intake per-allele change (ß = –0.3716%E) | ||||||
| Fat (%E) | 0.02016 | Higher fat intake per allele change (ß = 0.2071%E) | ||||||
| African American, Latino, European American (EAGLE-NHANES III) | Mean age: 36 y (23–56 y); mean BMI: 25.7 (22.3–29.8) | 6347 (2767/3580) | 24-h dietary recall | Energy (kcal/d) | 0.14016 | |||
| Carbohydrate (%E) | 0.61016 | |||||||
| Fat (%E) | 0.07016 | |||||||
| Cross-sectional study | German | Nondiabetic participants; mean age according to genotype: CC = 40 ± 1y, CA = 42 ± 1y, AA = 38 ± 1 y; mean BMI according to genotype: CC = 27.0 ± 0.4, CA = 28.4 ± 0.4, AA = 29.0 ± 0.9 | 151 (58/93) | Food diary | Energy (kcal/d) | 0.01017 | C allele revealed lower energy intake compared with subjects with the minor A allele | Haupt et al. (2009) (40) |
| Carbohydrate (%E) | 0.65017 | |||||||
| Fat (%E) | 0.60017 | |||||||
| rs10163409 | ||||||||
| Meta-analysis | European ancestry | NA | 71,326 | FFQ | Carbohydrate (%E) | 0.00118 | Genetic variant associated with higher carbohydrate intake (ß = 0.166%E) | Chu et al. (2013) (41) |
| Discovery-cohort: DietGen: population-based study (n = 3 cohorts) | Type 2 diabetes cases and controls; HPFS: mean age range: 48.7–56.4 y; mean BMI range: 25.3–27.6; NHS: mean age range: 52.0–56.1 y; mean BMI range: 24.0–27.8; WGHS: mean age: 54.7 y; mean BMI: 25.9 | 33,355 (4076/29,455) | Carbohydrate (%E) | <0.00118 | Genetic variant associated with higher carbohydrate intake (ß = 0.420%E) | |||
| Fat (%E) | <0.00118 | Genetic variant associated with lower fat intake (ß = –0.22%E) | ||||||
| Recovery-cohort: CHARGE (n = 12 cohorts) | NA | 38,360 | Carbohydrate (%E) | 0.46018 | ||||
| rs375181219 | ||||||||
| Cross-sectional study | African American, American Indian/Alaska Native, Asian/Pacific Islander, white, other | Patients with type 2 diabetes; mean age: 57.6 ± 7.2 y; mean BMI: 36.3 ± 6.1 | 2075 (912/1163) | FFQ | Energy (kcal/d) | 0.06611 | McCaffery et al. (2012) (35) | |
| Carbohydrate (%E) | 0.27612 | |||||||
| Fat (%E) | 0.05412 | |||||||
| rs992270820 | ||||||||
| Cross-sectional study | African American, American Indian/Alaska Native, Asian/Pacific Islander, white, other | Patients with type 2 diabetes; mean age: 57.6 ± 7.2 y; mean BMI: 36.3 ± 6.1 | 2075 (912/1163) | FFQ | Energy (kcal/d) | 0.06811 | ||
| Carbohydrate (%E) | 0.77812 | |||||||
| Fat (%E) | 0.26412 | |||||||
| rs993540121 | ||||||||
| Cross-sectional study | German | Mean age: 49.4 ± 14.0 y; mean BMI: 27.0 ± 4.5 | 12,462 (6271/6191) | FFQ | Carbohydrate (score) | 0.69022 | Holzapfel et al. (2010) (42) | |
| Fat (score) | 0.91022 | |||||||
| rs1121980 | ||||||||
| Cross-sectional study | Dutch | Mean age: 57.2 ± 6.1 y; mean BMI: 25.9 ± 4.0 | 1700 (0/1700) | FFQ | Energy (kcal/d) | 0.200 | Bauer et al. (2009) (43) | |
| Carbohydrate (g/d) | 0.08023 | |||||||
| Fat (g/d) | 0.12023 | |||||||
Values are means ± SDs unless otherwise indicated; in Haupt et al., values are means ± SEMs. BMI unit: kg/m2. Main results of studies concerning the association between FTO and total energy, carbohydrate, and fat intakes are shown. SNPs are sorted by number of publications and publication date. Details in the table are stated as mentioned in the main article. Some SNPs are in a high LD (r2 > 0.8) to each other. The LD values described by r² were calculated by using a Web-tool (25); the LD plot is shown in Supplemental Figure 1. CALiCo: ARIC, Causal Variants Across the Life Course and Atherosclerosis Risk in Communities Study Consortium; CHARGE, Cohorts for Heart and Aging Research in Genomic Epidemiology Consortium; EAGLE, Epidemiologic Architecture for Genes Linked to Environment; FTO, fat mass and obesity associated; GWAS, genomewide association study; HPFS, Health Professionals Follow-Up Study; LD, linkage disequilibrium; MEC, Multi-Ethnic Cohort; NA, not available ( P values/statistics not shown); NHS, Nurses’ Health Study; ref, reference; SNP, single nucleotide polymorphism; WGHS, Women in Global Health Study; %E, percentage of energy.
r² to rs1421085 = 0.90; r² to rs8050136 = 1.00; r² to rs3751812 = 1.00; r² to rs9922708 = 0.84; r² to rs9935401 = 1.00; r² to rs1121980 = 0.81.
Adjusted for age and sex.
Adjusted for age, sex, physical activity, BMI, country, and smoking status.
Adjusted for body weight.
Adjusted for age, geographical region (if available), physical activity (if available), eigenvectors (GWAS data only), and BMI.
Adjusted for age, geographical region (if available), physical activity (if available), eigenvectors (GWAS data only), total energy intake, and BMI.
Adjusted for age, BMI, baseline appetite scores, visit, and treatment.
Adjusted for age, sex, season, and diet assessment method (values for carbohydrate and fat intake are additionally adjusted for energy).
Adjusted for age, sex, and energy intake.
Adjusted for age, sex, study site, population stratification, and weight.
Adjusted for age, sex, study site, and population stratification.
r² to rs8050136 = 0.90; r² to rs3751812 = 0.90; r² to rs9922708 = 0.81; r² to rs9935401 = 0.90; r² to rs112190 = 0.91.
Adjusted for age, sex, study site, weight, and principal components reflecting genetic ancestry.
r² to rs3751812 = 1.00; r² to rs9922708 = 0.84; r² to rs9935401 = 1.00; r² to rs1121980 = 0.81.
Adjusted for age at blood draw, sex, and race/ethnicity.
Adjusted for sex, age, and BMI.
Adjusted for age, sex (CHARGE), location, subpopulation stratification, and BMI.
r² to rs9922708 = 0.84; r² to rs9935401 = 1.00; r² to rs1121980 = 0.81.
r² to rs9935401 = 0.84; r² to rs1121980 = 0.90.
r² to rs1121980 = 0.81.
Adjusted for age, sex, and survey.
Adjusted for energy.
TABLE 3.
Association between SNPs within other loci and total energy, carbohydrate, and fat intakes1
| Gene locus, SNP, and study type | Study population | Study characteristics according to methods and results sections | n (M/F) | Dietary assessment | Dietary data | P | Results | First author (year) (ref) |
|---|---|---|---|---|---|---|---|---|
| BDNF | ||||||||
| rs62652 | ||||||||
| Cross-sectional study (meta-analysis) | African American, Asian American, Latino, Pacific Islander, European American, other | NA | 36,973 | FFQ, 24-h dietary recall | Energy (kcal/d) | 0.6503 | Park et al. (2013) (39) | |
| Carbohydrate (%E) | 0.1903 | |||||||
| Fat (%E) | 0.9203 | |||||||
| Cross-sectional study | African American, American Indian/Alaska Native, Asian/Pacific Islander, white, other | Patients with type 2 diabetes; mean age: 57.6 ± 7.2 y, mean BMI: 36.3 ± 6.1 | 2075 (912/1163) | FFQ | Energy (kcal/d) | 0.0074 | GG genotype consumed on average > 100 kcal/d more than did carriers of the less common genotypes (ß = –103.37 kcal/d) | McCaffery et al. (2012) (35) |
| Carbohydrate (%E) | 0.5135 | |||||||
| Fat (%E) | 0.5215 | |||||||
| rs20303236 | ||||||||
| Cross-sectional study | Diverse racial and ethnic groups (non-Hispanic white, African American, Hispanic, Asian/Pacific Islander, American Indian) | Participants with impaired glucose tolerance and at high risk of diabetes; mean age: 50.8 ± 10.6 y; mean BMI: 34.0 ± 6.6 | 3180 (1047/2133) | FFQ | Energy (kcal/d) | 0.0067 | Fewer total caloric intake per copy minor T allele (ß = –96.75 kcal/d) | McCaffery et al. (2017) (38) |
| Carbohydrate (%E) | NS | |||||||
| Fat (%E) | NS | |||||||
| Non-Hispanic white | 1796 (56.5% female) | Energy (kcal/d) | <0.0017 | Fewer total caloric intake per copy minor T allele (ß = –140.49 kcal/d) | ||||
| rs49234618 | ||||||||
| Cross-sectional study | Not specified (Swedish study) | Mean age: 58.0 ± 7.6 y; mean BMI: 25.8 ± 4.1 | 29,480 (11,754/17,726) | 7-d menu book, FFQ | Energy (kcal/d) | 0.3609 | Rukh et al. (2013) (32) | |
| Carbohydrate (%E) | 0.6709 | |||||||
| Fat (%E) | 0.8309 | |||||||
| rs1076766410 | ||||||||
| Cross-sectional study | African American, American Indian/Alaska Native, Asian/Pacific Islander, white, other | Patients with type 2 diabetes; mean age: 57.6 ± 7.2 y; mean BMI: 36.3 ± 6.1 | 2075 (912/1163) | FFQ | Energy (kcal/d) | 0.0074 | AA genotype consumed on average > 100 kcal/d more than did carriers of the less common genotypes (ß = –103.10 kcal/d) | McCaffery et al. (2012) (35) |
| Carbohydrate (%E) | 0.3895 | |||||||
| Fat (%E) | 0.2895 | |||||||
| rs140163511 | ||||||||
| Cross-sectional study | African American, American Indian/Alaska Native, Asian/Pacific Islander, white, other | Patients with type 2 diabetes; mean age: 57.6 ± 7.2 y, mean BMI: 36.3 ± 6.1 | 2075 (912/1163) | FFQ | Energy (kcal/d) | 0.3594 |
McCaffery et al. (2012) (35) |
|
| Carbohydrate (%E) | 0.3545 | |||||||
| Fat (%E) | 0.3215 | |||||||
| rs1488830 | ||||||||
| Cross-sectional study | Dutch | Mean age: 57.2 ± 6.1 y; mean BMI: 25.9 ± 4.0 | 1700 (0/1700) | FFQ | Energy (kcal/d) | 0.580 | Bauer et al. (2009) (43) | |
| Carbohydrate (g/d) | 0.91012 | |||||||
| Fat (g/d) | 0.58012 | |||||||
| rs925946 | ||||||||
| Cross-sectional study | Dutch | Mean age: 57.2 ± 6.1 y; mean BMI: 25.9 ± 4.0 | 1700 (0/1700) | FFQ | Energy (kcal/d) | 0.940 | Bauer et al. (2009) (43) | |
| Carbohydrate (g/d) | 0.59012 | |||||||
| Fat (g/d) | 0.55012 | |||||||
| TMEM18 | ||||||||
| rs654823813 | ||||||||
| Cross-sectional study (meta-analysis) | African American, Asian American, Latino, Pacific Islander, European American, other | NA | 36,973 | FFQ, 24-h dietary recall | Energy (kcal/d) | 0.3303 | Park et al. (2013) (39) | |
| Carbohydrate (%E) | 0.2603 | |||||||
| Fat (%E) | 0.1703 | |||||||
| Cross-sectional study | Not specified (Swedish study) | Mean age: 58.0 ± 7.6 y; mean BMI: 25.8 ± 4.1 | 29,480 (11,754/17,726) | 7-d menu book, FFQ | Energy (kcal/d) | 0.5809 | Rukh et al. (2013) (32) | |
| Carbohydrate (%E) | 0.3909 | |||||||
| Fat (%E) | 0.0929 | |||||||
| Cross-sectional study | German | Mean age: 49.4 ± 14.0 y; mean BMI: 27.0 ± 4.5 | 12,462 (6271/6191) | FFQ | Carbohydrate (score) | 0.32014 | Holzapfel et al. (2010) (42) | |
| Fat (score) | 0.03014 | Trend toward an association with fat score (OR = 1.081) | ||||||
| Cross-sectional study | Dutch | Mean age: 57.2 ± 6.1 y; mean BMI: 25.9 ± 4.0 | 1700 (0/1700) | FFQ | Energy (kcal/d) | 0.670 | Bauer et al. (2009) (43) | |
| Carbohydrate (g/d) | 0.73012 | |||||||
| Fat (g/d) | 0.31012 | |||||||
| rs2867125 | ||||||||
| Cross-sectional study | Diverse racial and ethnic groups (non-Hispanic white, African American, Hispanic, Asian/Pacific Islander, American Indian) | Participants with impaired glucose tolerance and at high risk of diabetes; mean age: 50.8 ± 10.6 y; mean BMI: 34.0 ± 6.6 | 3180 (1047/2133) | FFQ | Energy (kcal/d) | 0.0947 | McCaffery et al. (2017) (38) | |
| Carbohydrate (%E) | NS | |||||||
| Fat (%E) | NS | |||||||
| Non-Hispanic white | 1796 (56.5% female) | FFQ | Energy (kcal/d) | 0.3497 | ||||
| KCTD15 | ||||||||
| rs29941 | ||||||||
| Cross-sectional study | Diverse racial and ethnic groups (non-Hispanic white, African American, Hispanic, Asian/Pacific Islander, American Indian) | Participants with impaired glucose tolerance and at high risk of diabetes; mean age: 50.8 ± 10.6 y; mean BMI: 34.0 ± 6.6 | 3180 (1047/2133) | FFQ | Energy (kcal/d) | 0.5027 | McCaffery et al. (2017) (38) | |
| Carbohydrate (%E) | NS | |||||||
| Fat (%E) | NS | |||||||
| Non-Hispanic White | 1796 (56.5% female) | FFQ | Energy (kcal/d) | 0.6187 | ||||
| Cross-sectional study | Not specified (Swedish study) | Mean age: 58.0 ± 7.6 y; mean BMI: 25.8 ± 4.1 | 29,480 (11,754/17,726) | 7-d menu book, FFQ | Energy (kcal/d) | 0.8609 | Rukh et al. (2013) (32) | |
| Carbohydrate (%E) | 0.9509 | |||||||
| Fat (%E) | 0.9809 | |||||||
| rs1108475315 | ||||||||
| Cross-sectional study (meta-analysis) | African American, Asian American, Latino, Pacific Islander, European American, other | NA | 36,973 | FFQ, 24-h dietary recall | Energy (kcal/d) | 0.8203 | Park et al. (2013) (39) | |
| Carbohydrate (%E) | 0.7303 | |||||||
| Fat (%E) | 0.6303 | |||||||
| Cross-sectional study | German | Mean age: 49.4 ± 14.0 y; mean BMI: 27.0 ± 4.5 | 12,462 (6271/6191) | FFQ | Carbohydrate (score) | 0.16014 | Holzapfel et al. (2010) (42) | |
| Fat (score) | 0.03014 | Trend toward an association with fat score (OR = 1.066) | ||||||
| rs368794 | ||||||||
| Cross-sectional study | Dutch | Mean age: 57.2 ± 6.1 y; mean BMI: 25.9 ± 4.0 | 1700 (0/1700) | FFQ | Energy (kcal/d) | 0.640 | Bauer et al. (2009) (43) | |
| Carbohydrate (g/d) | 0.02012 | Carriers of the risk T allele ate more total carbohydrates (per allele effect: 2.50 g/d) | ||||||
| Fat (g/d) | 0.11012 | |||||||
| NEGR1 | ||||||||
| rs281575216 | ||||||||
| Cross-sectional study | Diverse racial and ethnic groups (non-Hispanic white, African American, Hispanic, Asian/Pacific Islander, American Indian) | Participants with impaired glucose tolerance and at high risk of diabetes; mean age: 50.8 ± 10.6 y; mean BMI: 34.0 ± 6.6 | 3180 (1047/2133) | FFQ | Energy (kcal/d) | 0.0787 | McCaffery et al. (2017) (38) | |
| Carbohydrate (%E) | NS | |||||||
| Fat (%E) | NS | |||||||
| Non-Hispanic white | 1796 (56.5% female) | FFQ | Energy (kcal/d) | 0.0427 | Higher total caloric intake per copy minor C allele (ß = 39.58 kcal/d) | |||
| Cross-sectional study (meta-analysis) | African American, Asian American, Latino, Pacific Islander, European American, other | NA | 36,973 | FFQ, 24-h dietary recall | Energy (kcal/d) | 0.1703 | Park et al. (2013) (39) | |
| Carbohydrate (%E) | 0.6103 | |||||||
| Fat (%E) | 0.1303 | |||||||
| Cross-sectional study | Not specified (Swedish study) | Mean age: 58.0 ± 7.6 y; mean BMI: 25.8 ± 4.1 | 29,480 (11,754/17,726) | 7-d menu book, FFQ | Energy (kcal/d) | 0.0049 | Obesity-risk T allele associated with lower total energy intake (ß = –12.15 kcal/d) | Rukh et al. (2013) (32) |
| Carbohydrate (%E) | <0.0019 | Obesity-risk T allele associated with higher carbohydrate intake (ß = 0.23%E) | ||||||
| Fat (%E) | <0.0019 | Obesity-risk T allele associated with lower fat intake (ß = –0.21%E) | ||||||
| rs1078933617 | ||||||||
| Cross-sectional study | German | Mean age: 49.4 ± 14.0 y; mean BMI: 27.0 ± 4.5 | 12,462 (6271/6191) | FFQ | Carbohydrate (score) | 0.22014 | Holzapfel et al. (2010) (42) | |
| Fat (score) | 0.96014 | |||||||
| rs2568958 | ||||||||
| Cross-sectional study | Dutch | Mean age: 57.2 ± 6.1 y; mean BMI: 25.9 ± 4.0 | 1700 (0/1700) | FFQ | Energy (kcal/d) | 0.900 | Bauer et al. (2009) (43) | |
| Carbohydrate (g/d) | 0.49012 | |||||||
| Fat (g/d) | 0.12012 | |||||||
| SH2B1 | ||||||||
| rs749866518 | ||||||||
| Cross-sectional study | Not specified (Swedish study) | Mean age: 58.0 ± 7.6 y; mean BMI: 25.8 ± 4.1 | 29,480 (11,754/17,726) | 7-d menu book, FFQ | Energy (kcal/d) | 0.8509 | Rukh et al. (2013) (32) | |
| Carbohydrate (%E) | 0.8009 | |||||||
| Fat (%E) | 0.4909 | |||||||
| Cross-sectional study | German | Mean age: 49.4 ± 14.0 y; mean BMI: 27.0 ± 4.5 | 12,462 (6271/6191) | FFQ | Carbohydrate (score) | 0.46014 | Holzapfel et al. (2010) (42) | |
| Fat (score) | 0.35014 | |||||||
| Cross-sectional study | Dutch | Mean age: 57.2 ± 6.1 y; mean BMI: 25.9 ± 4.0 | 1700 (0/1700) | FFQ | Energy (kcal/d) | 0.550 | Bauer et al. (2009) (43) | |
| Carbohydrate (g/d) | 0.34012 | |||||||
| Fat (g/d) | 0.00312 | Risk G allele associated with increased total fat intake (per allele effect: 1.08 g/d) | ||||||
| rs735939719 | ||||||||
| Cross-sectional study | Diverse racial and ethnic groups | Participants with impaired glucose tolerance and at high risk of diabetes; mean age: 50.8 ± 10.6 y; mean BMI: 34.0 ± 6.6 | 3180 (1047/2133) | FFQ | Energy (kcal/d) | 0.5687 | McCaffery et al. (2017) (38) | |
| Carbohydrate (%E) | NS | |||||||
| Fat (%E) | NS | |||||||
| Non-Hispanic white | 1796 (56.5% female) | FFQ | Energy (kcal/d) | 0.4527 | ||||
| rs4788099 | ||||||||
| Cross-sectional study | African American, American Indian/Alaska Native, Asian/Pacific Islander, white, other | Patients with type 2 diabetes; mean age: 57.6 ± 7.2 y; mean BMI: 36.3 ± 6.1 | 2075 (912/1163) | FFQ | Energy (kcal/d) | 0.3984 | McCaffery et al. (2012) (35) | |
| Carbohydrate (%E) | 0.7425 | |||||||
| Fat (%E) | 0.8455 | |||||||
| MTCH2 | ||||||||
| rs1083873820 | ||||||||
| Cross-sectional study | Not specified (Swedish study) | Mean age: 58.0 ± 7.6 y; mean BMI: 25.8 ± 4.1 | 29,480 (11,754/17,726) | 7-d menu book, FFQ | Energy (kcal/d) | 0.4109 | Rukh et al. (2013) (32) | |
| Carbohydrate (%E) | 0.7509 | |||||||
| Fat (%E) | 0.5709 | |||||||
| Cross-sectional study | German | Mean age: 49.38 ± 13.97; mean BMI: 26.97 ± 4.49 | 12,462 (6271/6191) | FFQ | Carbohydrate (score) | 0.47014 | Holzapfel et al. (2010) (42) | |
| Fat (score) | 0.54014 | |||||||
| Cross-sectional study | Dutch | Mean age: 57.2 ± 6.1 y; mean BMI: 25.9 ± 4.0 | 1700 (0/1700) | FFQ | Energy (kcal/d) | 0.890 | Bauer et al. (2009) (43) | |
| Carbohydrate (g/d) | 0.74012 | |||||||
| Fat (g/d) | 0.38012 | |||||||
| rs3817334 | ||||||||
| Cross-sectional study | Diverse racial and ethnic groups (non-Hispanic white, African American, Hispanic, Asian/Pacific Islander, American Indian) | Participants with impaired glucose tolerance and at high risk of diabetes; mean age: 50.8 ± 10.6 y; mean BMI: 34.0 ± 6.6 | 3180 (1047/2133) | FFQ | Energy (kcal/d) | 0.9367 | McCaffery et al. (2017) (38) | |
| Carbohydrate (%E) | NS | |||||||
| Fat (%E) | NS | |||||||
| Non-Hispanic white | 1796 (56.5% female) | FFQ | Energy (kcal/d) | 0.4627 | ||||
| ETV5/SFRS10 | ||||||||
| rs7647305 | ||||||||
| Cross-sectional study | Not specified (Swedish study) | Mean age: 58.0 ± 7.6 y; mean BMI: 25.8 ± 4.1 | 29,480 (11,754/17,726) | 7-d menu book, FFQ |
Energy (kcal/d) | 0.2809 | Rukh et al. (2013) (32) | |
| Carbohydrate (%E) | 0.5409 | |||||||
| Fat (%E) | 0.8709 | |||||||
| Cross-sectional study | Dutch | Mean age: 57.2 ± 6.1 y; mean BMI: 25.9 ± 4.0 | 1700 (0/1700) | FFQ | Energy (kcal/d) | 0.820 | Bauer et al. (2009) (43) | |
| Carbohydrate (g/d) | 0.52012 | |||||||
| Fat (g/d) | 0.97012 | |||||||
| rs9816226 | ||||||||
| Cross-sectional study | Diverse racial and ethnic groups (non-Hispanic white, African American, Hispanic, Asian/Pacific Islander, American Indian) | Participants with impaired glucose tolerance and at high risk of diabetes; mean age: 50.8 ± 10.6 y; mean BMI: 34.0 ± 6.6 | 3180 (1047/2133) | FFQ | Energy (kcal/d) | 0.1127 | McCaffery et al. (2017) (38) | |
| Carbohydrate (%E) | NS | |||||||
| Fat (%E) | NS | |||||||
| Non-Hispanic white | 1796 (56.5% female) | FFQ | Energy (kcal/d) | 0.0137 | Higher total caloric intake per copy minor A allele (ß = 86.85 kcal/d) | |||
| GNPDA2 | ||||||||
| rs1093839721 | ||||||||
| Cross-sectional study | Not specified (Swedish study) | Mean age: 58.0 ± 7.6 y; mean BMI: 25.8 ± 4.1 | 29,480 (11,754/17,726) | 7-d menu book, FFQ | Energy (kcal/d) | 0.0399 | Obesity-risk G allele associated with lower total energy intake (ß = –10.97 kcal/d) | Rukh et al. (2013) (32) |
| Carbohydrate (%E) | 0.7009 | |||||||
| Fat (%E) | 0.8409 | |||||||
| Cross-sectional study | Dutch | Mean age: 57.2 ± 6.1 y; mean BMI: 25.9 ± 4.0 | 1700 (0/1700) | FFQ | Energy (kcal/d) | 0.370 | Bauer et al. (2009) (43) | |
| Carbohydrate (g/d) | 0.79012 | |||||||
| Fat (g/d) | 0.63012 | |||||||
| rs12641981 | ||||||||
| Cross-sectional study | Diverse racial and ethnic groups (non-Hispanic white, African American, Hispanic, Asian/Pacific Islander, American Indian) | Participants with impaired glucose tolerance and at high risk of diabetes; mean age: 50.8 ± 10.6 y; mean BMI: 34.0 ± 6.6 | 3180 (1047/2133) | FFQ | Energy (kcal/d) | 0.5597 | McCaffery et al. (2017) (38) | |
| Carbohydrate (%E) | NS | |||||||
| Fat (%E) | NS | |||||||
| Non-Hispanic white | 1796 (56.5% female) | FFQ | Energy (kcal/d) | 0.6067 | ||||
| FGF21 | ||||||||
| rs83813322 | ||||||||
| Meta-analysis | European ancestry | NA | 71,326 | FFQ | Carbohydrate (%E) | <0.00123 | Genetic variant associated with increased carbohydrate intake (ß = 0.23%E) | Chu et al. (2013) (41) |
| Fat (%E) | <0.00123 | Genetic variant associated with decreased fat intake (ß = –0.21%E) | ||||||
| rs838147 | ||||||||
| Meta-analysis | Multi-ethnic | FFQ | Carbohydrate (%E) | <0.00124 | Minor allele associated with higher carbohydrate intake (ß = 0.25%E) | Tanaka et al. (2013) (14) | ||
| GWA cohort (CHARGE) | Multi-ethnic | 37,537 | <0.00124 | Minor allele associated with higher carbohydrate intake (ß = 0.30%E) | ||||
| Replication cohort (DietGen) | US population–based cohorts | 33,533 | 0.00624 | Minor allele associated with higher carbohydrate intake (ß = 0.18%E) | ||||
| PPARG | ||||||||
| rs1801282 | ||||||||
| Cross-sectional study | White | Mean age according to sex: women = 38.3 ± 11.7 y, men = 37.5 ± 10.7 y; mean BMI according to sex: women = 27.3 ± 6.0, men = 28.6 ± 5.4 | 700 (290/410) | FFQ | Energy (kcal/d) | 0.81025 | Bouchard-Mercier et al. (2012) (47) | |
| Fat (g/d) | 0.04026 | Ala12 carriers had higher total fat intake than Pro12/Pro12 carriers | ||||||
| Fat (%E) | 0.03025 | Ala12 carriers had higher relative fat intake than Pro12/Pro12 carriers | ||||||
| Cross-sectional study | African American, American Indian/Alaska Native, Asian/Pacific Islander, white, other | Patients with type 2 diabetes; mean age: 57.6 ± 7.2 y; mean BMI: 36.3 ± 6.1 | 2075 (912/1163) | FFQ | Energy (kcal/d) | 0.0704 | McCaffery et al. (2012) (35) | |
| Carbohydrate (%E) | 0.9625 | |||||||
| Fat (%E) | 0.5275 | |||||||
| BCDIN3D/FAIM2 | ||||||||
| rs7138803 | ||||||||
| Cross-sectional study | Diverse racial and ethnic groups (non-Hispanic white, African American, Hispanic, Asian/Pacific Islander, American Indian) | Participants with impaired glucose tolerance and at high risk of diabetes; mean age: 50.8 ± 10.6 y; mean BMI: 34.0 ± 6.6 | 3180 (1047/2133) | FFQ | Energy (kcal/d) | 0.3437 | McCaffery et al. (2017) (38) | |
| Carbohydrate (%E) | NS | |||||||
| Fat (%E) | NS | |||||||
| Non-Hispanic white | 1796 (56.5% female) | FFQ | Energy (kcal/d) | 0.6487 | ||||
| Cross-sectional study | Not specified (Swedish study) | Mean age: 58.0 ± 7.6 y; mean BMI: 25.8 ± 4.1 | 29,480 (11,754/17,726) | 7-d menu book, FFQ | Energy (kcal/d) | 0.9609 | Rukh et al. (2013) (32) | |
| Carbohydrate (%E) | 0.5709 | |||||||
| Fat (%E) | 0.6409 | |||||||
| CB1-R/CNR-1 | ||||||||
| rs1049353 | ||||||||
| Cross-sectional study | Not specified (Spanish study) | Mean age: 45.8 ± 11.3 y; mean BMI: 36.9 ± 6.1 | 896 (0/896) | 3-d food record | Energy (kcal/d) | NS | de Luis et al. (2016) (48) | |
| Carbohydrate (g/d) | NS | |||||||
| Fat (g/d) | NS | |||||||
| Cross-sectional study | Not specified (Italian study) | Elderly subjects; mean age according to genotype: GG = 69.7 ± 3.4 y, AA/AG = 70.4 ± 3.2 y; mean BMI according to genotype: GG = 28.9 ± 5.7, AA/AG = 27.8 ± 6.4 | 118 (60/58) | FFQ | Carbohydrate (g/d) | 0.15027 | Caruso et al. (2012) (49) | |
| Fat (g/d) | 0.25027 | |||||||
| CD36 | ||||||||
| rs1761667 | ||||||||
| Cross-sectional study | White, African, West Asian, East Asian | Two age groups: AGE-1, 18–29 y; AGE-2, 30–55 y; mean BMI: 22.9 ± 0.3 | 136 (41/95) | FFQ, 3-d food diary | Energy (kcal/d) | NS | Shen et al. (2017) (50) | |
| Fat (g/d) | NS | |||||||
| Cross-sectional study | Mestizos | Normal-weight subjects; mean age: 40.2 ± 15.1 y; mean BMI: 22.4 ± 1.9 | 132 (68/64) | 3-d food record | Energy (kcal/d) | 0.160 | Ramos-Lopez et al. (2015) (51) | |
| Carbohydrate (g/d) | 0.100 | |||||||
| Fat (g/d) | 0.380 | |||||||
| Overweight subjects; mean age: 43.2 ± 13.9 y; mean BMI: 27.5 ± 1.4 | 163 (78/85) | Energy (kcal/d) | <0.001 | AA genotype had higher intake of calories than the other genotypes | ||||
| Carbohydrate (g/d) | 0.070 | |||||||
| Fat (g/d) | <0.001 | AA genotype had higher intake of total fat than the other genotypes | ||||||
| Obese subjects; mean age: 42.5 ± 12.4 y; mean BMI: 34.5 ± 4.6 | 146 (56/90) | Energy (kcal/d) | 0.510 | |||||
| Carbohydrate (g/d) | 0.180 | |||||||
| Fat (g/d) | 0.980 | |||||||
| MAP2K5 | ||||||||
| rs224142328 | ||||||||
| Cross-sectional study | Diverse racial and ethnic groups (non-Hispanic white, African American, Hispanic, Asian/Pacific Islander, American Indian) | Participants with impaired glucose tolerance and at high risk of diabetes; mean age: 50.8 ± 10.6 y; mean BMI: 34.0 ± 6.6 | 3180 (1047/2133) | FFQ | Energy (kcal/d) | 0.9067 | McCaffery et al. (2017) (38) | |
| Carbohydrate (%E) | NS | |||||||
| Fat (%E) | NS | |||||||
| Non-Hispanic white | 1796 (56.5% female) | FFQ | Energy (kcal/d) | 0.9077 | ||||
| rs2241420 | ||||||||
| Cross-sectional study | African American, American Indian/Alaska Native, Asian/Pacific Islander, white, other | Patients with type 2 diabetes; mean age: 57.6 ± 7.2 y; mean BMI: 36.3 ± 6.1 | 2075 (912/1163) | FFQ | Energy (kcal/d) | 0.6214 | McCaffery et al. (2012) (35) | |
| Carbohydrate (%E) | 0.7025 | |||||||
| Fat (%E) | 0.8705 | |||||||
| MTIF3 | ||||||||
| rs188598829 | ||||||||
| Cross-sectional study | Diverse racial and ethnic groups (non-Hispanic white, African American, Hispanic, Asian/Pacific Islander, American Indian) | Participants with impaired glucose tolerance and at high risk of diabetes; mean age: 50.8 ± 10.6 y; mean BMI: 34.0 ± 6.6 | 3180 (1047/2133) | FFQ | Energy (kcal/d) | 0.6377 | McCaffery et al. (2017) (38) | |
| Carbohydrate (%E) | NS | |||||||
| Fat (%E) | NS | |||||||
| Non-Hispanic white | 1796 (56.5% female) | FFQ | Energy (kcal/d) | 0.4857 | ||||
| rs7988412 | ||||||||
| Cross-sectional study | African American, American Indian/Alaska Native, Asian/Pacific Islander, white, other | Patients with type 2 diabetes; mean age: 57.6 ± 7.2 y; mean BMI: 36.3 ± 6.1 | 2075 (912/1163) | FFQ | Energy (kcal/d) | 0.9954 | McCaffery et al. (2012) (35) | |
| Carbohydrate (%E) | 0.9325 | |||||||
| Fat (%E) | 0.8325 | |||||||
| QPCTL/GIPR | ||||||||
| rs2287019 | ||||||||
| Cross-sectional study | Diverse racial and ethnic groups (non-Hispanic white, African American, Hispanic, Asian/Pacific Islander, American Indian) | Participants with impaired glucose tolerance and at high risk of diabetes; mean age: 50.8 ± 10.6 y; mean BMI: 34.0 ± 6.6 | 3180 (1047/2133) | FFQ | Energy (kcal/d) | 0.9517 | McCaffery et al. (2017) (38) | |
| Carbohydrate (%E) | NS | |||||||
| Fat (%E) | NS | |||||||
| Non-Hispanic white | 1796 (56.5% female) | FFQ | Energy (kcal/d) | 0.7267 | ||||
| rs11672660 | ||||||||
| Cross-sectional study | African American, American Indian/Alaska Native, Asian/Pacific Islander, white, other | Patients with type 2 diabetes; mean age: 57.6 ± 7.2 y; mean BMI: 36.3 ± 6.1 | 2075 (912/1163) | FFQ | Energy (kcal/d) | 0.3834 | McCaffery et al. (2012) (35) | |
| Carbohydrate (%E) | 0.7945 | |||||||
| Fat (%E) | 0.7455 | |||||||
| SEC16B/RASAL2 | ||||||||
| rs54387430 | ||||||||
| Cross-sectional study | Diverse racial and ethnic groups (non-Hispanic white, African American, Hispanic, Asian/Pacific Islander, American Indian) | Participants with impaired glucose tolerance and at high risk of diabetes; mean age: 50.8 ± 10.6 y; mean BMI: 34.0 ± 6.6 | 3180 (1047/2133) | FFQ | Energy (kcal/d) | 0.9107 | McCaffery et al. (2017) (38) | |
| Carbohydrate (%E) | NS | |||||||
| Fat (%E) | NS | |||||||
| Non-Hispanic white | 1796 (56.5% female) | FFQ | Energy (kcal/d) | 0.6397 | ||||
| rs10913469 | ||||||||
| Cross-sectional study | Not specified (Swedish study) | Mean age: 58.0 ± 7.6 y; mean BMI: 25.8 ± 4.1 | 29,480 (11,754/17,726) | 7-d menu book, FFQ | Energy (kcal/d) | 0.8009 | Rukh et al. (2013) (32) | |
| Carbohydrate (%E) | 0.7109 | |||||||
| Fat (%E) | 0.7509 | |||||||
| TNNI3K | ||||||||
| rs151417531 | ||||||||
| Cross-sectional study | Diverse racial and ethnic groups (non-Hispanic white, African American, Hispanic, Asian/Pacific Islander, American Indian) | Participants with impaired glucose tolerance and at high risk of diabetes; mean age: 50.8 ± 10.6 y; mean BMI: 34.0 ± 6.6 | 3180 (1047/2133) | FFQ | Energy (kcal/d) | 0.8277 | McCaffery et al. (2017) (38) | |
| Carbohydrate (%E) | NS | |||||||
| Fat (%E) | NS | |||||||
| Non-Hispanic white | 1796 (56.5% female) | FFQ | Energy (kcal/d) | 0.4507 | ||||
| rs1514176 | ||||||||
| Cross-sectional study | African American, American Indian/Alaska Native, Asian/Pacific Islander, white, other | Patients with type 2 diabetes; mean age: 57.6 ± 7.2 y; mean BMI: 36.3 ± 6.1 | 2075 (912/1163) | FFQ | Energy (kcal/d) | 0.0974 | McCaffery et al. (2012) (35) | |
| Carbohydrate (%E) | 0.9785 | |||||||
| Fat (%E) | 0.1115 | |||||||
Values are means ± SDs unless otherwise indicated. BMI unit: kg/m2. Main results of studies concerning the association between gene loci and total energy, carbohydrate, and fat intakes are shown. SNPs are sorted by number of publications and publication date. Details in the table are stated as mentioned in the article. Some SNPs are in a high LD (r2 > 0.8) to each other. The LD values described by r² were calculated by using a Web tool (25). BCDIN3D/FAIM2, BCDIN3 domain containing RNA methyltransferase/Fas apoptotic inhibitory molecule 2; BDNF, brain-derived neurotrophic factor; CB1-R/CNR-1, cannabinoid receptor 1; CD36, CD36 molecule; CHARGE, Cohorts for Heart and Aging Research in Genomic Epidemiology Consortium; ETV5/SFRS10, ETS variant 5; FGF21, fibroblast growth factor 21; GNPDA2, glucosamine-6-phosphate deaminase 2; GWA, Genome Wide Association; KCTD15, potassium channel tetramerization domain containing 15; LD, linkage disequilibrium; MAP2K5, mitogen-activated protein kinase 5; MTCH2, mitochondrial carrier 2; MTIF3, mitochondrial translational initiation factor 3; NA, not available; NEGR1, neuronal growth regulator 1; PPARG, PPAR γ; QPCTL/GIPR, glutaminyl-peptide cyclotransferase-like/gastric inhibitory polypeptide receptor; RASAL2, RAS protein activator-like 2; ref, reference; SEC16B, SEC16 homolog B, endoplasmic reticulum export factor; SH2B1, SH2B adaptor protein 1; SNP, single nucleotide polymorphism; TMEM18, transmembrane protein 18; TNNI3K, TNNI3 interacting kinase; %E, percentage of energy.
r 2 to rs4923461 = 0.82; r2 to rs1488830 = 0.82.
Adjusted for age at blood draw, sex, and race/ethnicity.
Adjusted for age, sex, study site, population stratification, and weight.
Adjusted for age, sex, study site, and population stratification.
r 2 to rs10767664 = 1.00; r² to rs4923461 = 0.91; r² to rs1488830 = 0.91.
Adjusted for age, sex, study site, weight, and principal components reflecting genetic ancestry.
r 2 to rs1488830 = 1.00; r2 to rs10767664 = 0.91.
Adjusted for age, sex, season, and diet assessment method (values for carbohydrate and fat intake are additionally adjusted for energy).
r 2 to rs1488830 = 0.91.
r 2 to rs925946 = 1.00.
Adjusted for energy.
r² to rs2867125 = 1.00.
Adjusted for age, sex, and survey.
r 2 to rs368794 = 0.84.
r 2 to rs10789336 = 0.96; r2 to rs2568958 = 0.96.
r 2 to rs2568958 = 1.00.
r 2 to rs4788099 = 1.00; r² to rs7359397 = 0.97.
r² to rs4788099 = 0.97.
r² to rs3817334 = 0.84.
r² to rs12641981 = 0.97.
r² to rs838147 = 0.81.
Adjusted for age, sex (CHARGE), location, subpopulation stratification, and BMI.
Adjusted for age, sex, study specific covariates, and BMI.
Adjusted for age, sex, and BMI.
Adjusted for age, sex, BMI, and energy intake.
Adjusted for age, sex, calories, and BMI.
r² to rs2241420 = 0.95.
r² to rs7988412 = 0.95.
r² to rs10913469 = 0.96.
r² to rs1514176 = 1.00.
Gene Loci and Dietary Intake
In the following, studies considering the association between the most commonly studied loci and dietary intake are presented. Figure 2 shows the overlap of significant associations between SNPs and total energy, carbohydrate, and fat intakes.
FIGURE 2.
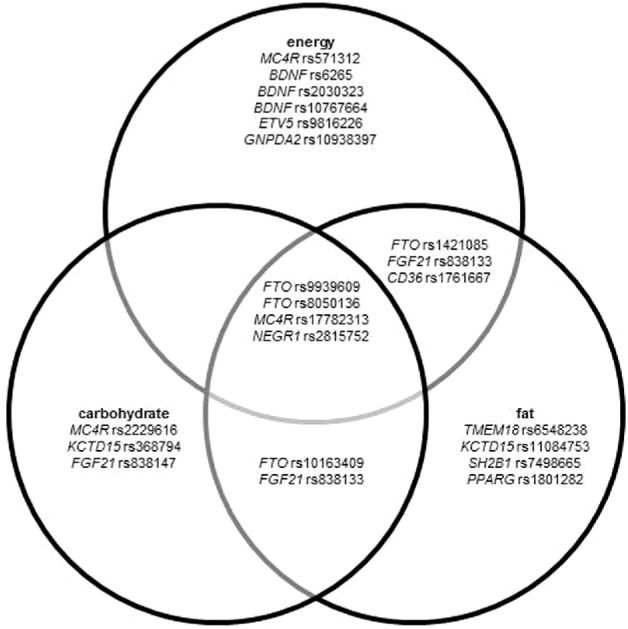
Venn diagram showing the overlap of significant associations (P < 0.05) between SNPs and total energy, carbohydrate, and fat intakes. In this diagram, the statistical model used has not been considered. BDNF, brain-derived neurotrophic factor; CD36, CD36 molecule; ETV5, ETS variant 5; FGF21, fibroblast growth factor 21; FTO, fat mass and obesity–associated; GNPDA2, glucosamine-6-phosphate deaminase 2; KCTD15, potassium channel tetramerization domain–containing 15; MC4R, melanocortin 4 receptor; NEGR1, neuronal growth regulator 1; PPARG, PPAR γ; SH2B1, SH2B adaptor protein 1; SNP, single nucleotide polymorphism; TMEM18, transmembrane protein 18.
FTO Locus and Dietary Intake
In total, 13 studies as well as 4 meta-analyses reported on potential associations between the FTO locus and total energy, carbohydrate, and fat intakes. Approximately 40% of these articles (n = 7) reported results on populations of European ancestry. Six publications presented data for different populations (e.g., Asian, African American, American Indian, Hispanic, and Asian or Pacific Islanders). The sample sizes varied between 40 and 29,480 participants in observational and experimental studies and yielded 213,173 subjects in the meta-analyses. In total, 8 different FTO SNPs were investigated, whereas data for SNP rs9939609 were presented in >60% of the articles (n = 11) (Table 1).
Three publications, including 2 meta-analyses, reported a significant association between the A risk allele of rs9939609 and lower total energy intake (P < 0.01) (29, 30, 32). Both meta-analyses estimated a lower total energy intake of 6.4 kcal/d (unadjusted) (29) or 5.9 kcal/d (adjusted) (30), respectively. In contrast, other studies reported evidence of a significant association between the A risk allele with a higher total energy intake (27, 33, 36, 37). Four articles did not find evidence for a significant association between SNP rs9939609 and total energy intake (Table 1) (28, 31, 34, 35). In addition, an association with higher total energy intake was reported for risk allele carriers of the FTO SNPs rs1421085 and rs8050136, which are in a high LD to rs9939609 (r² > 0.90) (38, 40), whereas Park et al. (39) observed findings in the opposite direction in African and European Americans. The SNPs rs3751812, rs9922708, and rs1121980 showed consistently nonsignificant associations with total energy intake (Table 1).
With regard to carbohydrate intake, FTO risk allele carriers of rs9939609 consumed fewer carbohydrates [ß = –0.002% of energy (%E); P = 0.005] (29). Lear et al. (36) analyzed a sample of 706 individuals of different ethnicities for associations between rs9939609 and carbohydrate intake, resulting in nonsignificant findings. However, subanalyses suggested a lower carbohydrate intake per A allele change in Aboriginal Canadians (ß = –2.2%E; P = 0.049) and a higher intake per minor A allele in participants of European descent (ß = 2.3%E; P = 0.007). Park et al. (39) observed a significantly lower carbohydrate intake (in %E) per A allele change for the SNP rs8050136, whereas Haupt et al. (40) did not. In a joint analysis of samples of European ancestry (n = 71,326), A allele carriers of the SNP rs10163409, which is not in LD to rs8050136, showed a significantly positive association with carbohydrate intake (ß = 0.166%E; P = 0.001) (41). Nonsignificant results were consistently reported for the SNPs rs1421085, rs3751812, rs9922708, rs9935401, and rs1121980 and carbohydrate intake (Table 1).
With regard to fat intake, significantly positive associations between obesity-risk alleles of SNP rs9939609, rs1421085, and rs8050136 and fat intake were observed. Steemburgo et al. (33) showed a positive association between SNP rs9939609 and fat intake as percentage of energy (P = 0.019) only for females (n = 126). McCaffery et al. (38) confirmed this result in a subanalysis of non-Hispanic white participants, showing a nominal association between the obesity-associated minor allele of rs1421085 and greater fat intake (ß = 0.37%E; P = 0.042). Moreover, Park et al. (39) described a significantly positive association between the FTO rs8050136 genotype and higher fat intake (Table 1). In contrast, in the meta-analysis of Livingstone et al. (29), the FTO risk allele carriers of rs9939609 consumed less fat (P = 0.004). Chu et al. (41) showed a significant inverse association between the SNP rs10163409 and fat intake (ß = –0.22%E; P ≤ 0.001) in a subcohort of 33,531 individuals. With regard to fat intake, nonsignificant results were consistently reported for the SNPs rs3751812, rs9922708, rs9935401, and rs1121980 (Table 1).
Melanocortin 4 Receptor Locus and Dietary Intake
Eleven publications (8 observational studies, 1 experimental study, and 2 meta-analyses) studied associations between the melanocortin 4 receptor (MC4R) locus and total energy, carbohydrate, and fat intakes (Table 2). Almost one-third of the articles (n = 3) included data from European populations. The remaining articles included data from mixed populations (n = 4) or nonspecified individuals (n = 4). The sample sizes varied between 40 and 29,480 individuals for observational and experimental studies and between 36,973 and 177,330 for the 2 meta-analyses. The studies reported data on 5 MC4R SNPs: rs17782313, rs17700633, rs17700144, rs2229616, and rs571312 (Table 2).
TABLE 2.
Association between SNPs within the MC4R gene locus and total energy, carbohydrate, and fat intakes1
| SNP and study type | Study population | Study characteristics according to methods and results sections | n (M/F) | Dietary assessment | Dietary data | P | Results | First author (year) (ref) |
|---|---|---|---|---|---|---|---|---|
| rs177823132 | ||||||||
| Cross-sectional study | Not specified (Iranian study) | Mean age according to genotype: TT = 43.5 ± 12.4 y, CT = 45.7 ± 13.0 y, CC = 42.4 ± 12.1 y | 374 (170/204) | 3-d food record | Energy (kcal/d) | <0.0013 | CC genotype higher energy intake than TT (ß = 217.7 kcal/d) | Khalilitehrani et al. (2015) (44) |
| Carbohydrate (g/d) | <0.0014 | CC genotype lower carbohydrate intake than TT (ß = –29.99 g/d) | ||||||
| Fat (g/d) | 0.2004 | |||||||
| BMI < 25 | 155 (71/84) | Energy (kcal/d) | 0.8603 | |||||
| Carbohydrate (g/d) | 0.0404 | CC genotype lower carbohydrate intake than TT (ß = –17.56 g/d) | ||||||
| Fat (g/d) | 0.0904 | |||||||
| BMI ≥ 25 | 219 (99/120) | Energy (kcal/d) | <0.0013 | CC genotype higher energy intake than TT (ß = 379.8 kcal/d) | ||||
| Carbohydrate (g/d) | <0.0014 | CC genotype lower carbohydrate intake than TT (ß = –39.11 g/d) | ||||||
| Fat (g/d) | 0.7304 | |||||||
| Cross-sectional study (meta-analysis) | White, African American, Asian | Age range: 31–75 y; BMI range: 22.1–31.6 | 177,330 (62,275/115,055) | FFQ, dietary record, recall | Energy (kcal/d) | 0.6605 | Qi et al. (2014) (30) | |
| Carbohydrate (%E) | 0.5905 | |||||||
| Fat (%E) | 0.0805 | |||||||
| Postprandial study | Not specified (English study) | Mean age: 32.1 ± 9.1 y; mean BMI: 26.8 ± 1.6 | 40 (40/0) | Ad libitum lunch | Energy (kJ/d) | 0.4736 | Dougkas et al. (2013) (31) | |
| Cross-sectional study (meta-analysis) | African American, Asian American, Latino, Pacific Islander, European American, other | NA | 36,973 | FFQ, 24-h dietary recall | Energy (kcal/d) | 0.8307 | Park et al. (2013) (39) | |
| Carbohydrate (%E) | 0.8007 | |||||||
| Fat (%E) | 0.4607 | |||||||
| African American, Asian American, Latino, Pacific Islander, European American (MEC) | Mean age: 68 y (62–74 y); mean BMI: 26.1 (23.6–29.2) | 19,529 (10,096/9433) | FFQ | Energy (kcal/d) | NS | |||
| Carbohydrate (%E) | NS | |||||||
| Fat (%E) | NS | |||||||
| African American, European American (CALiCo: ARIC) | Mean age: 54 y (49–59 y); mean BMI: 26.4 (23.7–29.8) | 11,114 (4957/6157) | FFQ | Energy (kcal/d) | NS | |||
| Carbohydrate (%E) | NS | |||||||
| Fat (%E) | NS | |||||||
| African American, Latino, European American (EAGLE-NHANES III) | Mean age: 54 y (49–59 y); mean BMI: 26.4 (23.7–29.8) | 6347 (2767/3580) | 24-h recall | Energy (kcal/d) | NS | |||
| Carbohydrate (%E) | NS | |||||||
| Fat (%E) | NS | |||||||
| Cross-sectional study | Not specified (Swedish study) | Mean age: 58.0 ± 7.6y; mean BMI: 25.8 ± 4.1 | 29,480 (11,754/17,726) | 7-d menu book, FFQ | Energy (kcal/d) | 0.5808 | Rukh et al. (2013) (32) | |
| Carbohydrate (%E) | 0.6808 | |||||||
| Fat (%E) | 0.9908 | |||||||
| Cross-sectional study | African American, American Indian/Alaska Native, Asian/Pacific Islander, white, other | Patients with type 2 diabetes; mean age: 57.6 ± 7.2 y; mean BMI: 36.3 ± 6.1 | 2075 (912/1163) | FFQ | Energy (kcal/d) | 0.6849 | McCaffery et al. (2012) (35) | |
| Carbohydrate (%E) | 0.97410 | |||||||
| Fat (%E) | 0.91010 | |||||||
| Cross-sectional study | Dutch | Mean age: 57.2 ± 6.1 y; mean BMI: 25.9 ± 4.0 | 1700 (0/1700) | FFQ | Energy (kcal/d) | 0.480 | Bauer et al. (2009) (43) | |
| Carbohydrate (g/d) | 0.39011 | |||||||
| Fat (g/d) | 0.78011 | |||||||
| Cohort study | White (European ancestry) | Mean age: 54.1 ± 6.7 y | 5724 (0/5724) | FFQ | Energy (kcal/d) | 0.00912 | CC genotype had higher total energy intake than TT genotype (ß = 84 kcal/d) | Qi et al. (2008) (45) |
| Carbohydrate (g/d) | 0.11012 | |||||||
| Carbohydrate (%E) | 0.45012 | |||||||
| Fat (g/d) | 0.00112 | CC genotype had higher total fat intake than TT genotype (ß = 4.6 g/d) | ||||||
| Fat (%E) | 0.14012 | |||||||
| rs17700633 | ||||||||
| Cross-sectional study | Dutch | Mean age: 57.2 ± 6.1 y; mean BMI: 25.9 ± 4.0 | 1700 (0/1700) | FFQ | Energy (kcal/d) | 0.830 | Bauer et al. (2009) (43) | |
| Carbohydrate (g/d) | 0.94011 | |||||||
| Fat (g/d) | 0.83011 | |||||||
| Cohort study | White (European ancestry) | Severe obesity; mean age: 44.3 ± 11.4 y; mean BMI: 46.0 ± 7.6 | 5724 (0/5724) | FFQ | Energy (kcal/d) | NS | Qi et al. (2008) (45) | |
| Carbohydrate (g/d) | NS | |||||||
| Carbohydrate (%) | NS | |||||||
| Fat (g/d) | NS | |||||||
| Fat (%) | NS | |||||||
| rs17700144 | ||||||||
| Cross-sectional study | German | Mean age: 49.4 ± 14.0 y; mean BMI: 27.0 ± 4.5 | 12,462 (6271/6191) | FFQ | Carbohydrate (score) | 0.19013 | Holzapfel et al. (2010) (42) | |
| Fat (score) | 0.95013 | |||||||
| rs2229616 | ||||||||
| Cross-sectional study | Not specified (white persons from Utah) | Severe obesity; mean age: 44.3 ± 11.4 y; mean BMI: 46.0 ± 7.6 | 1029 (191/838) | FFQ | Energy (kcal/d) | 0.83014 | Pichler et al. (2008) (46) | |
| Carbohydrate (g/d) | 0.01015 | Carriers of the variant showed higher carbohydrate intakes than did homozygote wild-type carriers (57 g/d) | ||||||
| Fat (g/d) | 0.13016 | |||||||
| rs571312 | ||||||||
| Cross-sectional study | Diverse racial and ethnic groups (non-Hispanic white, African American, Hispanic, Asian/Pacific Islander, American Indian) | Participants with impaired glucose tolerance and at high risk of diabetes; mean age: 50.8 ± 10.6 y; mean BMI: 34.0 ± 6.6 | 3180 (1047/2133) | FFQ | Energy (kcal/d) | 0.01817 | Greater total caloric intake per copy minor T allele (ß = 58.84 kcal/d) | McCaffery et al. (2017) (38) |
| Carbohydrate (%E) | NS | |||||||
| Fat (%E) | NS | |||||||
| Non-Hispanic white | 1796 (56.5% female) | FFQ | Energy (kcal/d) | 0.17217 | ||||
Values are means ± SDs unless otherwise indicated. BMI unit: kg/m2. Main results of studies concerning the association between MC4R and total energy, carbohydrate, and fat intakes are shown. SNPs are sorted by number of publications and publication date. Details in the table are stated as mentioned in the article. Some SNPs are in a high LD (r2 > 0.8) to each other. The LD values described by r² were calculated by using a Web tool (25); the LD plot is shown in Supplemental Figure 2. CALiCo: ARIC, Causal Variants Across the Life Course and Atherosclerosis Risk in Communities Study Consortium; EAGLE, Epidemiologic Architecture for Genes Linked to Environment; GWAS, genomewide association study; LD, linkage disequilibrium; MC4R, melanocortin 4 receptor; MEC, Multi-Ethnic Cohort; NA, not available; ref, reference; SNP, single nucleotide polymorphism; %E, percentage of energy.
r² to rs571312 = 0.96.
Adjusted for age, sex, physical activity, and smoking status.
Adjusted for age, sex, physical activity, smoking status, and energy intake.
Adjusted for age, geographical region (if available), physical activity (if available), and eigenvectors (GWAS data only).
Adjusted for age, BMI, baseline appetite scores, visit, and treatment.
Adjusted for age at blood draw, sex, and race/ethnicity.
Adjusted for age, sex, season, and diet assessment method (values for carbohydrate and fat intake are additionally adjusted for energy).
Adjusted for age, sex, study site, population stratification, and weight.
Adjusted for age, sex, study site, and population stratification.
Adjusted for energy.
Adjusted for age, BMI, and diabetes status.
Adjusted for age, sex, and survey.
Adjusted for age, sex, and carbohydrate intake.
Adjusted for age, sex, and BMI.
Adjusted for age and sex.
Adjusted for age, sex, study site, weight, and principal components reflecting genetic ancestry.
Most articles (8 out of 11) investigated the MC4R SNP rs17782313, which is in high LD to rs571312 (r² = 0.96). Two of them reported a significant association between the CC genotype and a higher total energy intake (P < 0.01) (44, 45). For SNP rs571312, a similar significantly positive association with energy intake was reported (ß = 58.84 kcal/d; P = 0.02) (38). Other studies, including 2 meta-analyses, did not find significant associations between MC4R SNPs and total energy intake, or for rs17782313, rs17700633, or rs2229616 (Table 2).
With regard to carbohydrate intake, a study in an Iranian population showed a significant association between SNP rs17782313 and a lower carbohydrate intake (P = 0.04 in lean subjects, P < 0.001 in overweight subjects) (44). A study in persons with severe obesity showed that carriers of the rs2229616 variant 103I had a higher carbohydrate intake (P = 0.01) (46). Other studies did not observe significant associations between SNPs rs17782313, rs17700633, rs571312, or rs17700144 and carbohydrate intake.
With regard to fat intake, results were nonsignificant, with 1 exception (Table 2). Only the analysis of 5724 white women, performed by Qi et al. (45) showed a significant association between the CC genotype and a higher total fat intake in grams per day (P = 0.001). This association was no longer significant, when data were expressed as percentage of total energy intake.
Other Loci and Dietary Intake
The remaining 18 loci analyzed for an association with total energy, carbohydrate, or fat intakes in >1 article are listed in Table 3. Ten cross-sectional studies and 3 meta-analyses were identified. The sample sizes varied between 118 and 71,326 participants. Data on total energy intake were available in 10 articles and data on carbohydrate and fat intakes in 11 articles.
Two studies on the brain-derived neurotrophic factor (BDNF) locus showed a significantly positive association between the obesity-risk alleles and total energy intake (35, 38). No significant association between BDNF SNPs and total energy intake was found in the other articles (32, 39, 43). With regard to carbohydrate and fat intakes, nonsignificant findings were reported for all 7 BDNF SNPs.
For SNP rs6548238 in the transmembrane protein 18 (TMEM18) locus, a significant association with fat intake (P = 0.030) in a sample of 12,462 German adults was reported for T allele carriers (42), which was not confirmed by other studies (32, 38, 39, 43). Consistently, no significant associations were found between TMEM18 SNPs and total energy or carbohydrate intakes.
For the potassium channel tetramerization domain-containing 15 (KCTD15) locus, no significant associations with total energy intake were shown (32, 38, 39, 42, 43). However, SNP rs368794 showed a significant association with higher carbohydrate intake (P = 0.020) (43). Studies on the SNP rs11084753, which is in LD to rs368794 (r² = 0.8) did not confirm this result (39, 42). With regard to fat intake and rs11084753, Park et al. (39) did not find any significant relation, whereas Holzapfel et al. (42) described a significant association with a higher fat score (P = 0.03). Moreover, no significant associations were reported for rs29941 or for rs368794 and fat intake (32, 38, 43).
A significant association between the neuronal growth regulator 1 (NEGR1) SNP rs2815752 and lower total energy intake (P = 0.004) was described in a Swedish cross-sectional study (n = 29,480) (32). However, significance was lost after correction for misreporting. McCaffery et al. (38) confirmed the significant finding in non-Hispanic white participants. This association was not confirmed by the meta-analysis of Park et al. (39). In the Swedish study, a significant association between rs2815752 and higher carbohydrate intake (P ≤ 0.001) was reported (32). This significant result was not confirmed by the other articles (38, 39, 42, 43). With regard to fat intake, no association with NEGR1 SNPs was described (38, 39, 42, 43), with the exception of Rukh et al. (32) who found a significantly inverse association between the rs2815752 T allele carriers and fat intake (ß = –0.21%E; P ≤ 0.001) (Table 3).
None of the studies investigating the SH2B adaptor protein 1 (SH2B1) locus reported significant associations with total energy, carbohydrate, or fat intakes, with one exception. Bauer et al. (43) found a significantly higher fat intake for risk G allele carriers of SNP rs7498665 (P = 0.003). The SNPs rs7647305 and rs9816226 at the ETS variant 5 (ETV5/SFRS10) locus (32, 38, 43) showed no significant associations with total energy, carbohydrate, or fat intakes, except for the subanalysis of McCaffery et al. (38).
The glucosamine-6-phosphate deaminase 2 (GNPDA2) locus was not significantly associated with total energy, carbohydrate, or fat intakes (Table 3). Only Rukh et al. (32) showed that the obesity-risk G allele was significantly associated (ß = –10.97 kcal/d; P = 0.039) with a lower energy intake, although this result was no longer significant after correction for multiple comparisons.
Two SNPs that were in high LD (r² = 0.81) at the fibroblast growth factor 21 (FGF21) locus were significantly associated with a higher carbohydrate intake as a percentage of energy (P < 0.001) (14, 41). Chu et al. (41) presented data on fat intake and showed a significantly negative association with SNP rs838133 (ß = –0.21%E).
For the PPARG SNP rs1801282, there was no significant association with total energy or carbohydrate intakes (Table 3). However, a significantly higher fat intake was observed for Ala12 carriers compared with carriers of the Pro12 allele (47). Significantly positive associations were also found for the rs1761667 at the CD36 locus. Ramos-Lopez et al. (51) presented data showing a higher intake of calories (P < 0.001) and a higher total fat intake (P < 0.001) for the AA genotype of overweight participants but not for subjects with obesity. This association was not confirmed by the study of Shen et al. (50).
No significant associations between SNPs and total energy, carbohydrate, or fat intakes were found for the other loci described in Table 3.
Discussion
The purpose of this review was to systematically explore associations between SNPs and total energy, carbohydrate, or fat intakes. In total, 39 articles, including 86 different loci and 176 SNPs, were identified. Twenty loci were described in detail in this review, and the others are listed in Supplemental Table 1.
First, significant associations were reported between the FTO rs9939609 and rs8050136 risk alleles and total energy intake (Table 1). One study (32) and 2 partly overlapping meta-analyses (29, 30) reported a significant association (P < 0.003) between rs9939609 and a lower total energy intake. Considering the estimated effect sizes per risk allele of −6.4 (unadjusted) and −5.9 (adjusted) kcal/d from the 2 partly overlapping meta-analyses (29, 30), the results might be clinically irrelevant with respect to measurement errors in the collection of dietary data. In contrast, studies (27, 33, 36, 37) reporting a significantly higher energy intake presented unadjusted results, apart from Oyeyemi et al. (27) and Lear et al. (36) who adjusted for age and sex. Furthermore, the significant associations with higher energy intake were described in specific target groups and limited sample sizes (27, 33, 36, 37).
It must be emphasized that results were mainly obtained in cohorts of European ancestry. Qi et al. (30) replicated the significant association between rs9939609 and a lower energy intake in a subanalysis of whites, but Lear et al. (36) could not replicate a significant association after dividing participants according to ethnicity. Therefore, the significant association between FTO rs9939609 and energy intake observed in white populations is possibly not applicable to other ethnicities.
Moreover, the reported association with a lower energy intake was unexpected due to the association between the FTO locus and a higher body mass (22). In addition, a major limitation is the measurement error inherent in collecting self-reported dietary intake data (52, 53). Rukh et al. (32) indicated that the significant association between the FTO locus and lower energy intake became nonsignificant after excluding misreporters. Sonestedt et al. (54) analyzed the relation between FTO risk allele carriers and underreporting of dietary intake, showing a higher frequency of underreporters among AA carriers of the FTO SNP rs9939609 than among TT carriers.
However, since Frayling et al. (22) identified the association between the FTO locus and BMI, many studies have tried to elucidate the molecular mechanisms underlying this relation (37, 55). Recently, Claussnitzer et al. (56) identified the FTO SNP rs1421085 as the causal variant whose risk allele leads to an enhanced fat storage and lower mitochondrial fat burning. This latter observation suggests that the modest increase in fat storage is due to lower thermogenesis and energy expenditure rather than due to a difference in energy intake. Taken together, the association between FTO SNPs and a lower total energy intake is weak and possibly of low clinical relevance despite large sample sizes and sufficient statistical power. In addition, there is little biological plausibility due to the heterogeneity of reported mechanisms and, in particular, evidence that gene variants may affect energy expenditure rather than intake.
The results for an association between FTO SNPs and carbohydrate intake were also inconsistent. Livingstone et al. (29) and Park et al. (39) showed a significantly lower carbohydrate intake in risk allele carriers of rs9939609 and rs8050136, respectively. Chu et al. (41) showed a higher intake for rs10163409. No significant evidence for an association between SNPs and carbohydrate intake was shown in the remaining studies (n = 10). In addition, a subanalysis by Lear et al. (36) described a significant association between rs9939609 and a higher carbohydrate intake in a cohort of Aboriginal Canadians and a lower carbohydrate intake in European persons. This ethnic difference was not confirmed by the meta-analysis of Qi et al. (30). Therefore, there is no consistent evidence to conclude that FTO SNPs are associated with carbohydrate intake.
Six out of 17 articles described a significant association between FTO SNPs and fat intake, whereas 1 study and 1 meta-analysis reported a significantly positive association between rs9939609 and fat intake (29, 33). Consistently, a significant association between the risk C allele of rs1421085 (LD to rs9939609, r2 = 0.9) and a higher fat intake as a percentage of energy was reported in a mixed population (35) and in a subgroup of non-Hispanic white participants (38). Furthermore, the meta-analysis of Park et al. (39) suggests that carriers of the obesity-risk allele (C allele) of the SNP rs8050136 are characterized by a higher fat intake. Due to the high linkage between these SNPs, results suggest a positive association between the FTO risk allele and fat intake. However, the effect sizes were small and the changes in dietary intake across years were not considered. It is questionable whether this finding, which is largely based on epidemiologic studies, is of clinical relevance.
Second, results for an association between MC4R SNPs and dietary intake were inconsistent. The MC4R locus is known to be associated with BMI (13), eating behavior (57), and the regulation of food intake (58). Significantly positive associations with total energy intake have been shown for rs17782313 and rs571312. Khalilitehrani et al. (44) showed that, after further adjustment for energy intake, the significant association remained only in the overweight group. The same study also presented significant evidence for a negative association between rs17782313 and carbohydrate intake. The results may be ascribed to the association between MC4R and BMI itself. However, no other studies (n = 6) confirmed this significant result. Furthermore, the association between a higher total fat intake and rs17782313 was no longer significant after adjustment for energy intake. Therefore, the genetic association studies identified in this review do not provide consistent evidence that the MC4R SNPs are significantly associated with total energy, carbohydrate, or fat intakes.
Third, associations between further loci and total energy, carbohydrate, and fat intakes were more consistent, especially in terms of nonsignificant findings. One reason could be that fewer articles, and therefore lower heterogeneity, have been published for these loci. Most of the loci (Table 3) are known to be associated with body weight management (12, 59, 60). Moreover, BDNF is involved in neuronal regulatory pathways of appetite and energy balance in animal studies (61) but is also associated with BMI in humans (62). The latter might explain the consistent positive association between total energy intake and the obesity-risk genotype of BDNF SNPs. Significant associations between a lower energy intake and the obesity-risk allele of the SNP rs2815752 (NEGR1) were shown in 2 studies (32, 38). It can be supposed that the NEGR1 as well as TMEM18 loci, which are also associated with BMI (13), are involved in food regulation due to their function in neural development (63). As investigated by Berglund et al. (64), the FGF21 locus is involved in carbohydrate and lipid metabolism, which may drive the positive association between FGF21 SNPs and carbohydrate intake (14, 41).
Strengths and Limitations
The major strength of this systematic review is that the inclusion of identified SNPs associated with total energy, carbohydrate, or fat intakes was not limited to a specific locus. This gives a wide overview of articles focusing on a direct association between SNPs and total energy, carbohydrate, and fat intakes, published between 1994 and September 2017. This strength is in direct contrast to the systematic review and meta-analysis performed by Livingstone et al. (29) who focused only on associations between FTO SNPs and macronutrient intake. The other 3 meta-analyses were not based on a systematic review, but on original data (30, 39, 41). A further strength is that this systematic review was not restricted to a specific study type and included experimental as well as population-based studies. However, this does not allow pooling of data in a meta-analysis. The present review did not include articles describing copy number variations, mutation analyses, haplotypes, or studies investigating the association between genetic factors and food groups or dietary patterns as well as gene-diet interactions. Furthermore, potential associations between SNPs and protein intake, which plays a minor role in the treatment and prevention of overweight and obesity (23, 24), were not considered. It must be mentioned that GWASs identified SNPs at the FTO or FGF21 loci, which may be relevant for protein intake. For instance Chu et al. (41) showed no significant evidence for an association between rs10163409 at the FTO locus and protein intake (ß = − 0.05%E; P = 0.08), whereas Tanaka et al. (14) showed a significantly positive association between rs1421085, which was not in LD to rs10163409, and protein intake (ß = 0.08; P ≤ 0.001). However, due to the exclusion of protein intake for this review, the article gained more focus and clarity.
The search strategy might be also biased due to the inclusion of selected gene names. It is assumed that this had no impact on the results, because the MC4R locus—not included in the list of search terms—was identified as the second most common locus published for the reviewed topic.
A limitation is the high heterogeneity of data due to sample size, nutritional assessment, and characteristics of participants. The FFQ is the most commonly used dietary assessment tool to represent energy intake in observational studies. As mentioned by Cade et al. (65), FFQs may poorly represent dietary intake, which can lead to both overestimation and underestimation of macronutrient intake. It could be speculated that there is a relation between the assessment tool used for dietary intake as well as the study type and the significance level of the results. As shown in Tables 1–3, there was no tendency for such bias.
Studies also varied in the statistical analysis and in the definition of the primary endpoints. In nutrition research, the comparison of results across studies and the replication of valid data is a major area of concern. There is an urgent need for studies harmonizing the data on macronutrient intake between the cohorts and standardizing the applied statistical models.
Due to large differences in the primary outcomes, a formal quality assessment was not performed. In addition, data pooling and performing a meta-analysis were not considered to be appropriate, because the data were too heterogeneous for statistical pooling. Therefore, a narrative synthesis as indicated in PROSPERO was conducted. A general limitation, especially in the field of genetic association studies, was the high publication bias (66). There is strong evidence that negative results are less frequently published.
The “pleiotropic” effect of identified SNPs may show the complexity as well as the challenge of gene-based dietary recommendations. Most of the genetic loci identified in this systematic literature search represent candidate genes (e.g., PPARG) for biological phenotypes. Only a few SNPs investigated for an association with total energy, carbohydrate, or fat intakes have been identified as BMI-related SNPs in GWASs (7, 13, 62). Tanaka et al. (14) (Supplemental Table 1) identified some loci being associated with macronutrient intake, whereas most of these associations were not confirmed by replication analysis. Another weakness is that prospective intervention studies are needed for confirmation before any conclusion on the clinical relevance can be drawn. In addition, the small effect size of the SNPs identified and potential gene-gene interactions may require studies focusing on genetic scores.
Conclusions
The present review searched systematically for associations between SNPs and total energy, carbohydrate, and fat intakes. The principal finding was that the current literature does not provide evidence for consistent associations between SNPs and total energy, carbohydrate, or fat intakes. Therefore, the conclusion is that the current knowledge is too limited to derive dietary advice for weight management on the basis of genetic information. More efforts and clinical trials are needed to understand the mechanisms behind genetic variants and how they may interact with the lifestyle and environment.
Supplementary Material
Acknowledgments
We thank Stefanie Brunner for providing methodologic advice. Furthermore, we are grateful to Lynne Stecher for proofreading the manuscript. In addition, we thank Amway GmbH, Puchheim, Germany for financial support. All authors read and approved the final manuscript.
Notes
Supported in part by Amway GmbH, Puchheim, Germany
Author disclosures: TD, JG, and LP, no conflicts of interest. CH is a member of the scientific advisory board of 4sigma GmbH. HH is a member of scientific advisory boards of NovoNordisk, Boehringer Ingelheim, and Orexigene. Amway GmbH had no role in the design, analysis, or writing of this article.
Supplemental Material, Supplemental Table 1, Supplemental Figures 1 and 2, and Supplemental References are available from the “Supplementary data” link in the online posting of the article and from the same link in the online table of contents at https://academic.oup.com/advances/.
Abbreviations used:
- BDNF
brain-derived neurotrophic factor
- FGF21
fibroblast growth factor 21
- FTO
fat mass and obesity associated
- GWAS
genomewide association study
- LD
linkage disequilibrium
- MC4R
melanocortin 4 receptor
- NEGR1
neuronal growth regulator 1
- PPARG
PPAR γ
- SNP
single nucleotide polymorphism
- TMEM18
transmembrane protein 18
- %E
percentage of energy intake
References
- 1. NCD Risk Factor Collaboration (NCD-RisC). Trends in adult body-mass index in 200 countries from 1975 to 2014: a pooled analysis of 1698 population -based measurement studies with 19.2 million participants. Lancet 2016;387(10026):1377–96. [DOI] [PMC free article] [PubMed] [Google Scholar]
- 2. GBD 2015 Obesity Collaborators. Health effects of overweight and obesity in 195 countries over 25 years. N Engl J Med 2017;377(1):13–27. [DOI] [PMC free article] [PubMed] [Google Scholar]
- 3. WHO. Global status report on noncommunicable diseases: 2014 [report]. 2014:1–228. Available from: http://www.who.int/nmh/publications/ncd-status-report-2014/en/ (accessed 14 November 2016).
- 4. Hill JO, Wyatt HR, Reed GW, Peters JC. Obesity and the environment: where do we go from here? Science 2003;299(5608):853–5. [DOI] [PubMed] [Google Scholar]
- 5. Maes HH, Neale MC, Eaves LJ. Genetic and environmental factors in relative body weight and human adiposity. Behav Genet 1997;27(4):325–51. [DOI] [PubMed] [Google Scholar]
- 6. Hägg S, Ganna A, Van Der Laan SW, Esko T, Pers TH, Locke AE, Berndt SI, Justice AE, Kahali B, Siemelink MA et al. Gene-based meta-analysis of genome-wide association studies implicates new loci involved in obesity. Hum Mol Genet 2015;24(23):6849–60. [DOI] [PMC free article] [PubMed] [Google Scholar]
- 7. Locke AE, Kahali B, Berndt SI, Justice AE, Pers TH, Day FR, Powell C, Vedantam S, Buchkovich ML, Yang J, et al. Genetic studies of body mass index yield new insights for obesity biology. Nature 2015;518(7538):197–206. [DOI] [PMC free article] [PubMed] [Google Scholar]
- 8. Rankinen T, Bouchard C. Genetics of food intake and eating behavior phenotypes in humans. Annu Rev Nutr 2006;26:413–34. [DOI] [PubMed] [Google Scholar]
- 9. Krug S, Kastenmuller G, Stuckler F, Rist MJ, Skurk T, Sailer M, Raffler J, Romisch-Margl W, Adamski J, Prehn C, et al. The dynamic range of the human metabolome revealed by challenges. FASEB J 2012;26(6):2607–19. [DOI] [PubMed] [Google Scholar]
- 10. Zeevi D, Korem T, Zmora N, Israeli D, Rothschild D, Weinberger A, Ben-Yacov O, Lador D, Avnit-Sagi T, Lotan-Pompan M, et al. Personalized nutrition by prediction of glycemic responses. Cell 2015;163(5):1079–94. [DOI] [PubMed] [Google Scholar]
- 11. Bray MS, Loos RJ, McCaffery JM, Ling C, Franks PW, Weinstock GM, Snyder MP, Vassy JL, Agurs-Collins T. NIH working group report-using genomic information to guide weight management: from universal to precision treatment. Obesity (Silver Spring) 2016;24(1):14–22. [DOI] [PMC free article] [PubMed] [Google Scholar]
- 12. Willer CJ, Speliotes EK, Loos RJ, Li S, Lindgren CM, Heid IM, Berndt SI, Elliott AL, Jackson AU, Lamina C, et al. Six new loci associated with body mass index highlight a neuronal influence on body weight regulation. Nat Genet 2009;41(1):25–34. [DOI] [PMC free article] [PubMed] [Google Scholar]
- 13. Thorleifsson G, Walters GB, Gudbjartsson DF, Steinthorsdottir V, Sulem P, Helgadottir A, Styrkarsdottir U, Gretarsdottir S, Thorlacius S, Jonsdottir I, et al. Genome-wide association yields new sequence variants at seven loci that associate with measures of obesity. Nat Genet 2009;41(1):18–24. [DOI] [PubMed] [Google Scholar]
- 14. Tanaka T, Ngwa JS, van Rooij FJ, Zillikens MC, Wojczynski MK, Frazier-Wood AC, Houston DK, Kanoni S, Lemaitre RN, Luan J, et al. Genome-wide meta-analysis of observational studies shows common genetic variants associated with macronutrient intake. Am J Clin Nutr 2013;97(6):1395–402. [DOI] [PMC free article] [PubMed] [Google Scholar]
- 15. Corella D, Peloso G, Arnett DK, Demissie S, Cupples LA, Tucker K, Lai CQ, Parnell LD, Coltell O, Lee YC, et al. APOA2, dietary fat, and body mass index: replication of a gene-diet interaction in 3 independent populations. Arch Intern Med 2009;169(20):1897–906. [DOI] [PMC free article] [PubMed] [Google Scholar]
- 16. Celis-Morales C, Marsaux CF, Livingstone KM, Navas-Carretero S, San-Cristobal R, Fallaize R, Macready AL, O'Donovan C, Woolhead C, Forster H, et al. Can genetic-based advice help you lose weight? Findings from the Food4Me European randomized controlled trial. Am J Clin Nutr 2017;105(5):1204–13. [DOI] [PubMed] [Google Scholar]
- 17. Celis-Morales C, Livingstone KM, Marsaux CF, Macready AL, Fallaize R, O'Donovan CB, Woolhead C, Forster H, Walsh MC, Navas-Carretero S, et al. Effect of personalized nutrition on health-related behaviour change: evidence from the Food4Me European randomized controlled trial. Int J Epidemiol 2017;46(2):578–88. [DOI] [PubMed] [Google Scholar]
- 18. Covolo L, Rubinelli S, Ceretti E, Gelatti U. Internet-based direct-to-consumer genetic testing: a systematic review. J Med Internet Res 2015;17(12):e279. [DOI] [PMC free article] [PubMed] [Google Scholar]
- 19. Higgins JPT, Green S. Cochrane Handbook for Systematic Reviews of Interventions Version 5.1.0 2011 [updated 2011]. Available from: http://handbook.cochrane.org (accessed 10 September 2015).
- 20. Moher D, Liberati A, Tetzlaff J, Altman DG. Preferred Reporting Items for Systematic Reviews and Meta-analyses: the PRISMA statement. J Clin Epidemiol 2009;62(10):1006–12. [DOI] [PubMed] [Google Scholar]
- 21. Deeb SS, Fajas L, Nemoto M, Pihlajamaki J, Mykkanen L, Kuusisto J, Laakso M, Fujimoto W, Auwerx J. A Pro12Ala substitution in PPARgamma2 associated with decreased receptor activity, lower body mass index and improved insulin sensitivity. Nat Genet 1998;20(3):284–7. [DOI] [PubMed] [Google Scholar]
- 22. Frayling TM, Timpson NJ, Weedon MN, Zeggini E, Freathy RM, Lindgren CM, Perry JR, Elliott KS, Lango H, Rayner NW, et al. A common variant in the FTO gene is associated with body mass index and predisposes to childhood and adult obesity. Science 2007;316(5826):889–94. [DOI] [PMC free article] [PubMed] [Google Scholar]
- 23. Wirth A, Wabitsch M, Hauner H. The prevention and treatment of obesity. Dtsch Arztebl Int 2014;111(42):705–13. [DOI] [PMC free article] [PubMed] [Google Scholar]
- 24. Jensen MD, Ryan DH, Apovian CM, Ard JD, Comuzzie AG, Donato KA, Hu FB, Hubbard VS, Jakicic JM, Kushner RF, et al. 2013 AHA/ACC/TOS guideline for the management of overweight and obesity in adults: a report of the American College of Cardiology/American Heart Association Task Force on Practice Guidelines and The Obesity Society. Circulation 2014;129(25 Suppl 2):S102–38. [DOI] [PMC free article] [PubMed] [Google Scholar]
- 25. Johnson AD, Handsaker RE, Pulit S, Nizzari MM, O'Donnell CJ, de Bakker PIW. SNAP: A web-based tool for identification and annotation of proxy SNPs using HapMap. Bioinformatics 2008;24(24):2938–39. [DOI] [PMC free article] [PubMed] [Google Scholar]
- 26. Barrett JC, Fry B, Maller J, Daly MJ. Haploview: analysis and visualization of LD and haplotype maps. Bioinformatics 2005;21(2):263–5. [DOI] [PubMed] [Google Scholar]
- 27. Oyeyemi BF, Ologunde CA, Olaoye AB, Alamukii NA. FTO gene associates and interacts with obesity risk, physical activity, energy intake, and time spent sitting: pilot study in a Nigerian population. J Obes 2017;2017, 3245270. [DOI] [PMC free article] [PubMed] [Google Scholar]
- 28. Livingstone KM, Celis-Morales C, Navas-Carretero S, San-Cristobal R, Forster H, O'Donovan CB, Woolhead C, Marsaux CFM, Macready AL, Fallaize R, et al. Fat mass- and obesity-associated genotype, dietary intakes and anthropometric measures in European adults: the Food4Me study. Br J Nutr 2016;115(3):440–8. [DOI] [PubMed] [Google Scholar]
- 29. Livingstone KM, Celis-Morales C, Lara J, Ashor AW, Lovegrove JA, Martinez JA, Saris WH, Gibney M, Manios Y, Traczyk I, et al. Associations between FTO genotype and total energy and macronutrient intake in adults: a systematic review and meta-analysis. Obes Rev 2015;16(8):666–78. [DOI] [PubMed] [Google Scholar]
- 30. Qi Q, Kilpelainen TO, Downer MK, Tanaka T, Smith CE, Sluijs I, Sonestedt E, Chu AY, Renstrom F, Lin X, et al. FTO genetic variants, dietary intake and body mass index: insights from 177,330 individuals. Hum Mol Genet 2014;23(25):6961–72. [DOI] [PMC free article] [PubMed] [Google Scholar]
- 31. Dougkas A, Yaqoob P, Givens DI, Reynolds CK, Minihane AM. The impact of obesity-related SNP on appetite and energy intake. Br J Nutr 2013;110(6):1151–6. [DOI] [PubMed] [Google Scholar]
- 32. Rukh G, Sonestedt E, Melander O, Hedblad B, Wirfalt E, Ericson U, Orho-Melander M. Genetic susceptibility to obesity and diet intakes: association and interaction analyses in the Malmo Diet and Cancer Study. Genes Nutr 2013;8(6):535–47. [DOI] [PMC free article] [PubMed] [Google Scholar]
- 33. Steemburgo T, Azevedo MJ, Gross JL, Milagro FI, Campion J, Martinez JA. The rs9939609 polymorphism in the FTO gene is associated with fat and fiber intakes in patients with type 2 diabetes. J Nutrigenet Nutrigenomics 2013;6(2):97–106. [DOI] [PubMed] [Google Scholar]
- 34. Lappalainen T, Lindstrom J, Paananen J, Eriksson JG, Karhunen L, Tuomilehto J, Uusitupa M. Association of the fat mass and obesity-associated (FTO) gene variant (rs9939609) with dietary intake in the Finnish Diabetes Prevention Study. Br J Nutr 2012;108(10):1859–65. [DOI] [PubMed] [Google Scholar]
- 35. McCaffery JM, Papandonatos GD, Peter I, Huggins GS, Raynor HA, Delahanty LM, Cheskin LJ, Balasubramanyam A, Wagenknecht LE, Wing RR. Obesity susceptibility loci and dietary intake in the Look AHEAD trial. Am J Clin Nutr 2012;95(6):1477–86. [DOI] [PMC free article] [PubMed] [Google Scholar]
- 36. Lear SA, Deng WQ, Pare G, Sulistyoningrum DC, Loos RJ, Devlin A. Associations of the FTO rs9939609 variant with discrete body fat depots and dietary intake in a multi-ethnic cohort. Genet Res (Camb) 2011;93(6):419–26. [DOI] [PubMed] [Google Scholar]
- 37. Speakman JR, Rance KA, Johnstone AM. Polymorphisms of the FTO gene are associated with variation in energy intake, but not energy expenditure. Obesity (Silver Spring) 2008;16(8):1961–5. [DOI] [PubMed] [Google Scholar]
- 38. McCaffery JM, Jablonski KA, Franks PW, Delahanty LM, Aroda V, Marrero D, Hamman RF, Horton ES, Dagogo-Jack S, Wylie-Rosett J, et al. Replication of the association of BDNF and MC4R variants with dietary intake in the Diabetes Prevention Program. Psychosom Med 2017;79(2):224–33. [DOI] [PMC free article] [PubMed] [Google Scholar]
- 39. Park SL, Cheng I, Pendergrass SA, Kucharska-Newton AM, Lim U, Ambite JL, Caberto CP, Monroe KR, Schumacher F, Hindorff LA, et al. Association of the FTO obesity risk variant rs8050136 with percentage of energy intake from fat in multiple racial/ethnic populations: the PAGE study. Am J Epidemiol 2013;178(5):780–90. [DOI] [PMC free article] [PubMed] [Google Scholar]
- 40. Haupt A, Thamer C, Staiger H, Tschritter O, Kirchhoff K, Machicao F, Haring HU, Stefan N, Fritsche A. Variation in the FTO gene influences food intake but not energy expenditure. Exp Clin Endocrinol Diabetes 2009;117(4):194–7. [DOI] [PubMed] [Google Scholar]
- 41. Chu AY, Workalemahu T, Paynter NP, Rose LM, Giulianini F, Tanaka T, Ngwa JS, Qi Q, Curhan GC, Rimm EB, et al. Novel locus including FGF21 is associated with dietary macronutrient intake. Hum Mol Genet 2013;22(9):1895–902. [DOI] [PMC free article] [PubMed] [Google Scholar]
- 42. Holzapfel C, Grallert H, Huth C, Wahl S, Fischer B, Doring A, Ruckert IM, Hinney A, Hebebrand J, Wichmann HE et al. Genes and lifestyle factors in obesity: results from 12 462 subjects from MONICA/KORA. Int J Obes (Lond) 2010;34(10):1538–45. [DOI] [PMC free article] [PubMed] [Google Scholar]
- 43. Bauer F, Elbers CC, Adan RA, Loos RJ, Onland-Moret NC, Grobbee DE, van Vliet-Ostaptchouk JV, Wijmenga C, van der Schouw YT. Obesity genes identified in genome-wide association studies are associated with adiposity measures and potentially with nutrient-specific food preference. Am J Clin Nutr 2009;90(4):951–9. [DOI] [PubMed] [Google Scholar]
- 44. Khalilitehrani A, Qorbani M, Hosseini S, Pishva H. The association of MC4R rs17782313 polymorphism with dietary intake in Iranian adults. Gene 2015;563(2):125–9. [DOI] [PubMed] [Google Scholar]
- 45. Qi L, Kraft P, Hunter DJ, Hu FB. The common obesity variant near MC4R gene is associated with higher intakes of total energy and dietary fat, weight change and diabetes risk in women. Hum Mol Genet 2008;17(22):3502–08. [DOI] [PMC free article] [PubMed] [Google Scholar]
- 46. Pichler M, Kollerits B, Heid IM, Hunt SC, Adams TD, Hopkins PN, Kronenberg F. Association of the melanocortin-4 receptor V103I polymorphism with dietary intake in severely obese persons. Am J Clin Nutr 2008;88(3):797–800. [DOI] [PMC free article] [PubMed] [Google Scholar]
- 47. Bouchard-Mercier A, Paradis AM, Perusse L, Vohl MC. Associations between polymorphisms in genes involved in fatty acid metabolism and dietary fat intakes. J Nutrigenet Nutrigenomics 2012;5(1):1–12. [DOI] [PubMed] [Google Scholar]
- 48. de Luis DA, Izaola O, Aller R, Lopez JJ, Torres B, Diaz G, Gomez E, Romero E. Association of G1359A polymorphism of the cannabinoid receptor gene (CNR1) with macronutrient intakes in obese females. J Hum Nutr Diet 2016;29(1):118–23. [DOI] [PubMed] [Google Scholar]
- 49. Caruso MG, Gazzerro P, Notarnicola M, Cisternino AM, Guerra V, Misciagna G, Laezza C, Bifulco M. Cannabinoid type 1 receptor gene polymorphism and macronutrient intake. J Nutrigenet Nutrigenomics 2012;5(6):305–13. [DOI] [PubMed] [Google Scholar]
- 50. Shen YC, Kennedy OB, Methven L. The effect of genotypical and phenotypical variation in taste sensitivity on liking of ice cream and dietary fat intake. Food Qual Prefer 2017;55:79–90. [Google Scholar]
- 51. Ramos-Lopez O, Panduro A, Martinez-Lopez E, Fierro NA, Ojeda-Granados C, Sepulveda-Villegas M, Roman S. Genetic variant in the CD36 gene (rs1761667) is associat ed with higher fat intake and high serum cholesterol among the population of West Mexico. J Nutr Food Sci 2015;5:353. [Google Scholar]
- 52. Braam LA, Ocke MC, Bueno-de-Mesquita HB, Seidell JC. Determinants of obesity-related underreporting of energy intake. Am J Epidemiol 1998;147(11):1081–6. [DOI] [PubMed] [Google Scholar]
- 53. Price GM, Paul AA, Cole TJ, Wadsworth ME. Characteristics of the low-energy reporters in a longitudinal national dietary survey. Br J Nutr 1997;77(6):833–51. [DOI] [PubMed] [Google Scholar]
- 54. Sonestedt E, Roos C, Gullberg B, Ericson U, Wirfalt E, Orho-Melander M. Fat and carbohydrate intake modify the association between genetic variation in the FTO genotype and obesity. Am J Clin Nutr 2009;90(5):1418–25. [DOI] [PubMed] [Google Scholar]
- 55. Karra E, O'Daly OG, Choudhury AI, Yousseif A, Millership S, Neary MT, Scott WR, Chandarana K, Manning S, Hess ME, et al. A link between FTO, ghrelin, and impaired brain food-cue responsivity. J Clin Invest 2013;123(8):3539–51. [DOI] [PMC free article] [PubMed] [Google Scholar]
- 56. Claussnitzer M, Dankel SN, Kim KH, Quon G, Meuleman W, Haugen C, Glunk V, Sousa IS, Beaudry JL, Puviindran V, et al. FTO obesity variant circuitry and adipocyte browning in humans. N Engl J Med 2015;373(10):895–907. [DOI] [PMC free article] [PubMed] [Google Scholar]
- 57. Stutzmann F, Cauchi S, Durand E, Calvacanti-Proenca C, Pigeyre M, Hartikainen AL, Sovio U, Tichet J, Marre M, Weill J et al. Common genetic variation near MC4R is associated with eating behaviour patterns in European populations. Int J Obes (Lond) 2009;33(3):373–8. [DOI] [PubMed] [Google Scholar]
- 58. Adan RA, Tiesjema B, Hillebrand JJ, la Fleur SE, Kas MJ, de Krom M. The MC4 receptor and control of appetite. Br J Pharmacol 2006;149(7):815–27. [DOI] [PMC free article] [PubMed] [Google Scholar]
- 59. Rankinen T, Zuberi A, Chagnon YC, Weisnagel SJ, Argyropoulos G, Walts B, Perusse L, Bouchard C. The Human Obesity Gene Map: the 2005 update. Obesity (Silver Spring) 2006;14(4):529–644. [DOI] [PubMed] [Google Scholar]
- 60. Delahanty LM, Pan Q, Jablonski KA, Watson KE, McCaffery JM, Shuldiner A, Kahn SE, Knowler WC, Florez JC, Franks PW. Genetic predictors of weight loss and weight regain after intensive lifestyle modification, metformin treatment, or standard care in the Diabetes Prevention Program. Diabetes Care 2012;35(2):363–6. [DOI] [PMC free article] [PubMed] [Google Scholar]
- 61. Unger TJ, Calderon GA, Bradley LC, Sena-Esteves M, Rios M. Selective deletion of Bdnf in the ventromedial and dorsomedial hypothalamus of adult mice results in hyperphagic behavior and obesity. J Neurosci 2007;27(52):14265–74. [DOI] [PMC free article] [PubMed] [Google Scholar]
- 62. Speliotes EK, Willer CJ, Berndt SI, Monda KL, Thorleifsson G, Jackson AU, Lango Allen H, Lindgren CM, Luan J, Magi R, et al. Association analyses of 249,796 individuals reveal 18 new loci associated with body mass index. Nat Genet 2010;42(11):937–48. [DOI] [PMC free article] [PubMed] [Google Scholar]
- 63. Lee AW, Hengstler H, Schwald K, Berriel-Diaz M, Loreth D, Kirsch M, Kretz O, Haas CA, de Angelis MH, Herzig S, et al. Functional inactivation of the genome-wide association study obesity gene neuronal growth regulator 1 in mice causes a body mass phenotype. PLoS One 2012;7(7):e41537. [DOI] [PMC free article] [PubMed] [Google Scholar]
- 64. Berglund ED, Li CY, Bina HA, Lynes SE, Michael MD, Shanafelt AB, Kharitonenkov A, Wasserman DH. Fibroblast growth factor 21 controls glycemia via regulation of hepatic glucose flux and insulin sensitivity. Endocrinology 2009;150(9):4084–93. [DOI] [PMC free article] [PubMed] [Google Scholar]
- 65. Cade J, Thompson R, Burley V, Warm D. Development, validation and utilisation of food-frequency questionnaires—a review. Public Health Nutr 2002;5(4):567–87. [DOI] [PubMed] [Google Scholar]
- 66. Kavvoura FK, Liberopoulos G, Ioannidis JP. Selection in reported epidemiological risks: an empirical assessment. PLoS Med 2007;4(3):e79. [DOI] [PMC free article] [PubMed] [Google Scholar]
Associated Data
This section collects any data citations, data availability statements, or supplementary materials included in this article.