Summary
The root endodermis surrounds the central vasculature as a protective sheath, analogous to an animal polarised epithelium, and restricts diffusion by its ring-shaped Casparian strips (CS)1. Following a lag phase, individual endodermal cells suberise in an apparently random fashion, leading to a “patchy” suberisation that eventually gives rise to a zone of continuous deposition2. Casparian strips and suberin lamellae affect paracellular and transcellular transport, respectively. Interestingly, most angiosperms maintain some isolated cells in an unsuberised state3. These so-called “passage cells” are speculated to allow uptake across an otherwise impermeable endodermal barrier. Here, we demonstrate that these passage cells are late emanations of a meristematic patterning process that reads-out the underlying non-radial symmetry of the vasculature. This process is mediated by non-cell autonomous cytokinin repression in the root meristem, leading to distinct phloem and xylem pole-associated endodermal cells. The latter can resist ABA-dependent suberisation and give rise to passage cell formation. Our data further demonstrate that during meristematic patterning, xylem pole-associated endodermal cells can dynamically adapt passage cell numbers in response to nutrient status and that passage cells express transporters and locally impact their expression in adjacent cortical cells.
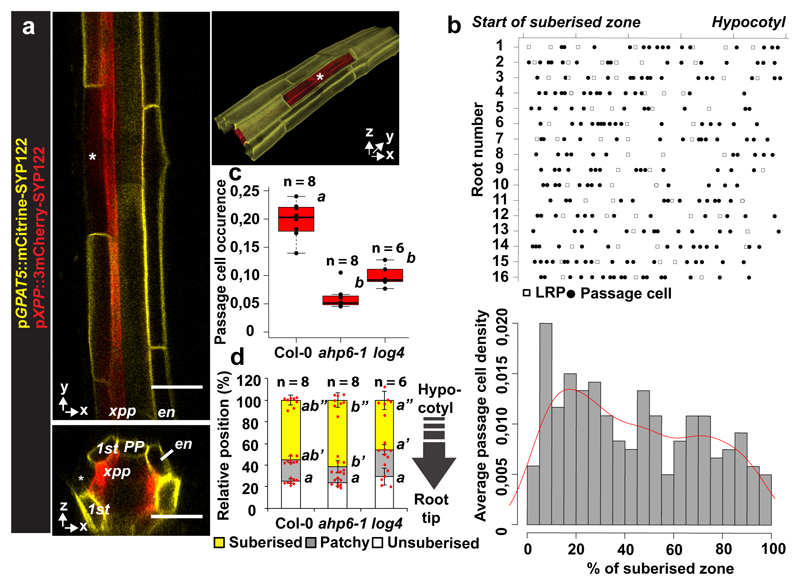
For more than a century, angiosperm roots are known to display interspersed passage cells in their suberized endodermis4. In monocots, these cells remain thin-walled and unsuberised for many months4, suggesting that passage cells represent a stable cell fate. In Arabidopsis, there is only sporadic mention of passage cells and experiments addressing their function are scarce and mostly correlative3,5 While the molecular basis of passage cell development is unknown, suberisation in Arabidopsis follows a stereotypic pattern2. This was recently shown to be highly responsive to an entire palette of stress conditions, mediated by abscisic acid (ABA) and ethylene2. Within the zone of continuous suberisation, we found individual cells that lack suberin deposition (Fig. 1a), which was reliably paralleled by a live-marker for suberisation2 (Extended Data Fig. 1a-c). In combination with a marker for xylem pole pericycle (Extended Data Fig. 1d), we demonstrate a tight association of these cells with the xylem pole (Extended Data Fig. 1f), a second defining feature of passage cells3. Similar to other angiosperms, suberisation initiates above the phloem pole, approximately four cells earlier than above the xylem pole3 (Extended Data Fig. 1g,h). Passage cells appear randomly along the longitudinal axis, non-correlated with sites of lateral root emergence, but sometimes clustered and with a tendency to decrease towards the hypocotyl (Fig. 1b, Extended Data Fig. 1e). To understand the mechanism determining xylem pole association of passage cells, we investigated mutants of genes involved in xylem patterning. Interestingly, two cytokinin-related mutants, ahp6-1 and log4, showed reduced passage cell number without affecting overall suberisation (Fig. 1c,d). AHP6 attenuates cytokinin responses6, while LOG4 is involved in cytokinin biosynthesis7,8. Auxin-cytokinin interactions are essential to establish the bisymmetric pattern of phloem and xylem poles9,10. Preferential accumulation of auxin in xylem precursors is thought to lead to expression of AHP6 and LOG4, turning these cells into a cytokinin-refractory cytokinin source. Higher cytokinin signaling in neighbours then induces procambium/phloem pole cells8, which in turn usher more auxin towards xylem precursors thereby establishing complementary domains of auxin and cytokinin perception10. We hypothesised that these bisymmetric signaling domains also cause association of passage cells with the xylem pole.
Figure 1. Presence and distribution of passage cells in Arabidopsis.
a) Representative suberised endodermis and xylem pole pericycle visualized by a suberin (GPAT5) and xylem pole pericycle (XPP) reporter using plasma membrane-localised mCitrine-SYP122 or 3mCherry-SYP122 reporters, respectively. Asterisks mark passage cell. b) Scoring of lateral root primordia (white squares) and passage cells (black circles) from start of fully suberised zone (0 %) to hypocotyl junction (100%). 5 % binning of data from top panel (grey bars) and trend of passage cell density along the suberised zone (red line) c) Passage cell occurrence in Col-0 and mutants (ahp6-1 and log4). d) Suberisation in Col-0 and mutants (ahp6-1 and log4). en; Endodermis, nd; not detected, xpp; Xylem pole pericycle. Individual letters highlight significant differences between groups. Bar graphs represent mean ± SD, boxplot centers show median. In all graphs, dots represent individual data points. Notice that for all stacked graphs there are 3 measurements per root (unsuberised zone (white), patchy zone (grey) and suberised zone (yellow)). Individual letters show significantly different groups according to a post hoc Bonferroni-adjusted paired two-sided T-test. For more information on Data plots see the statistics and reproducibility section. For a) the image is representative of 5 independent lines. n represents independent biological samples. For individual P values see supplementary table 2. Scale bars: 25 μm.
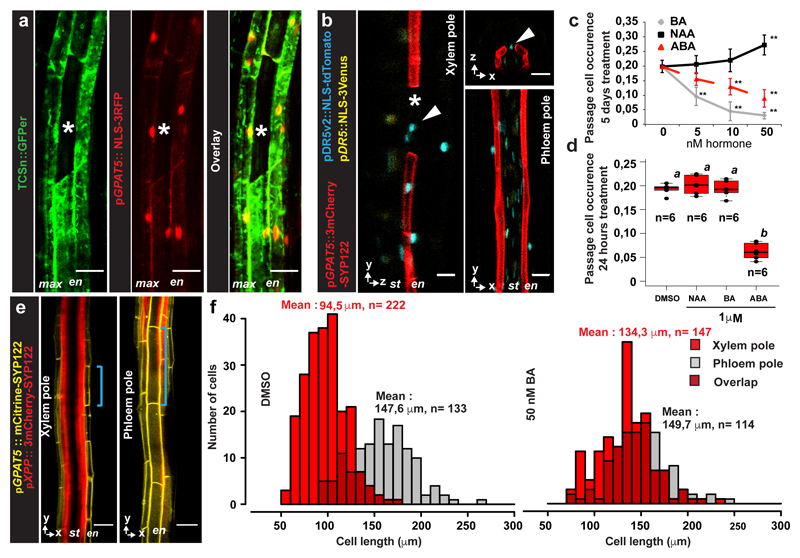
Using a cytokinin-response marker11, we observed responses in the suberised root zone. Although strongest in the pericycle, cytokinin responses were also observed in suberised endodermis (Fig. 2a, Extended Data Fig. 2b), but not in passage cells, indicating an absent or attenuated cytokinin-response (Fig. 2a). By observing expression pattern of most A- and B-Type ARR reporters, negative and positive transcriptional regulators of cytokinin signaling, respectively12–14, we found repressive A-type ARR3 and ARR6, as well as the B-type ARR14 to be expressed in passage cells, but no A-type ARR expression could be found in suberised endodermal cells (Extended Data Fig. 2c and d), illustrating that passage cells have a distinct set of cytokinin-response regulators, possibly explaining their attenuated cytokinin-response. Our inability to detect ARRs in suberized endodermis might be due to their low abundance in these cells or the fact that not all ARRs were represented in our marker set. With a standard auxin reporter we only detected expression in vasculature and tissues surrounding LRPs (Fig. 2b, Extended Data Fig. 2a). An improved version15 however, displayed additional signals restricted to xylem pole endodermal cells, yet not exclusive to passage cells (Fig. 2b). Occurrence of passage cells is thus associated with differential auxin and cytokinin responses within the circumference of the late endodermis.
Figure 2. Cytokinin and auxin regulate endodermal patterning and passage cell formation.
a) Representative image depicting expression of cytokinin response marker TCSn (ER- GFP, green) or the suberin reporter GPAT5 (NLS-3mCherry, red) in fully suberised endodermis. b) Expression of auxin signaling reporter DR5v2 (NLS-tdTomato, blue), or DR5 (NLS-3mVenus, yellow) and suberin marker GPAT5 (3mCherry-SYP122, red) in fully suberised endodermis. Red dots represent individual data points. c-d) Occurrence of passage cells in seedlings germinated on indicated hormones c) or upon hormone incubation for 24 hours d) DMSO: mock treatment. Black dots represent individual data points. e) Optical sections through suberised endodermis. Suberin and xylem pole pericycle highlighted as in Fig. 1a. Blue lines highlight length of a single cell in xylem or phloem pole. f) Distribution of suberised endodermal cell length in xylem or phloem pole of plants germinated onmock (DMSO) or cytokinin plates. Numbers depict average lengths of xylem pole (red) or phloem pole (grey) endodermal cells. Asterisks indicate passage cells, arrowheads passage cell nuclei. ABA; Abscisic acid, BA; Benzyl adenine, DMSO; Dimethyl sulfoxide, En; Endodermis, NAA; Naphtalene acetic acid, nd; not detected, NLS; Nuclear localization signal, max; maximum projection, St; Stele. Boxplot centers show median. Individual letters show significantly different groups according to a post hoc Bonferroni-adjusted paired two-sided T-test. For a), b) and e) the image is representative of 8 independent lines. n represents independent biological samples. In c) ** Depicts significant difference (p<0,01) in a two-tailed T-test. Dots represent mean, error bars are SD, n = 25 independent biological replicas for each treatment. For more information on Data plots see the statistics and reproducibility section. For individual P values see supplementary table 2. Scale bars represent 25 μm.
Germinating seedlings on auxin increased passage cell numbers, but only at concentrations that also affected root growth (Fig. 2c Extended Data Fig. 8). Cytokinin, by contrast, decreased passage cell numbers at concentrations not affecting root growth (Fig. 2c, Extended Data Fig. 8). ABA strongly promotes endodermal suberisation, causing enhanced and precocious deposition2. As both ABA and cytokinin decreased passage cell numbers (Fig. 2c), we asked how the two hormones might be connected. Only seedling transfer to ABA- not cytokinin-containing plates for 24h led to passage cell closure (Fig. 2d), already observable after 9h (Extended Data Fig. 3). This indicates that ABA can act late, while cytokinin affects early patterning events. Intriguingly, we observed that xylem pole endodermal cell length is about half that of phloem pole cells (Fig. 2e,f). Such dimorphisms have been described for other species4 and could arise from a cytokinin-dependent delay of exit from the division zone in xylem pole-associated cells16,17.
Increasing concentrations of cytokinin, increased average xylem pole-associated endodermal cell length, coming close to phloem pole length (Fig. 2f, Extended Data Fig. 4f). Consistent with its antagonistic action, auxin decreased length of xylem pole cells (Extended Data Fig. 4e), while ABA, did not affect endodermal cell length (Extended Data Fig. 4d). These data indicate that cytokinin causes a difference between xylem and phloem pole-associated endodermis already in the transition zone, which we use as an early read-out of bisymmetric patterning within the endodermis (Extended Data Fig. 4g).
In order to test if cytokinin and auxin act directly in the endodermis, we specifically over-expressed cytokinin- or auxin-signaling suppressors in all differentiating endodermal cells. Cytokinin inhibition caused an almost completely absence of suberisation, as if all endodermal cells had acquired passage cell identity (Extended Data Fig. 4a-c, Extended Data Fig. 5a-d). This suppression of suberisation could not be antagonised by ABA, supporting a model whereby cytokinin signaling determines endodermal ABA-responsiveness (Extended Data Fig. 5e). Around lateral root emergence sites suberisation persisted, suggesting cytokinin-independent suberisation in these areas (Extended Fig. 4a). When inhibiting endodermal auxin signaling, we observed decreased passage cell numbers (Extended Data Fig. 4b,c). We added temporal control to these manipulations by employing an estradiol-inducible expression system18. A 29 hour estradiol-induction of AHP6-GFP did not affect already established suberisation or established passage cells, confirming cytokinin application experiments (Extended Data Fig. 6). By contrast, auxin-repressor induction for 29h reduced passage cell numbers (Extended Data Fig. 6), suggesting that auxin signaling is also required to maintain passage cell fate. Interestingly, repressing ABA for 29h led to an almost complete disappearance of suberin (Extended Data Fig. 6), suggesting that strong suppression of ABA signaling interferes with maintenance of suberisation, possibly by de-repressing ethylene-signaling2. Having established direct endodermal action of cytokinin, auxin and ABA in passage cell formation, we sought to understand how spatial differences of cytokinin presence or perception might arise.
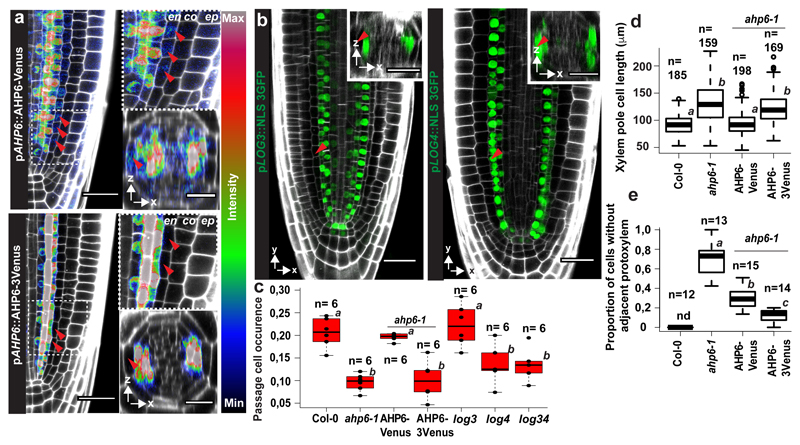
One regulator of cytokinin perception in the xylem pole is AHP6, whose presence interferes with phospho-transfer reactions from receptors towards transcriptional regulators6. While its transcription is confined to the stele, we surprisingly found that a complementing AHP6-Venus fusion diffuses into endodermal cells above the xylem pole (Fig. 3a, Extended Data Fig. 7a) where it could attenuate cytokinin signaling. In order to establish the relevance of this observation, we made use of a functional, non-mobile triple-mVenus AHP6 fusion19. Intriguingly, only the mobile, single Venus fusion rescued passage cell number and xylem pole length of endodermal cells in ahp6-1 (Fig. 3c-d Extended Data Fig. 7b). This was not due to lower activity of the triple Venus fusion, since xylem patterning defects of ahp6-1 were rescued to an even higher extent by the triple- than by the single AHP6-mVenus fusion (Fig. 3e). Thus, circumferential endodermal patterning and passage cell differentiation relies on movement of AHP6 from the stele into the endodermis.
Figure 3. Spatially restricted cytokinin repression and production underlie passage cell formation.
a) Expression of pAHP6::AHP6-mVenus or pAHP6::AHP6-3mVenus from a previously published line19 in the root meristem. Figures represent longitudinal and transverse optical sections through the xylem pole of the root meristematic zone. b) pLOG3 and pLOG4 reporter activity (NLS-3GFP, green) in the root meristem. The used lines were previously published8 c) Occurrence of passage cells in ahp6-1 and lines complemented with AHP6 fused to a single or triple mVenus protein driven from AHP6 promoter. Dots represent individual data points. d) Length of xylem pole endodermal cells in suberised zone of ahp6-1 and lines complemented with AHP6 fusions. Dots represent outliers. e) Quantification of xylem defects in ahp6 mutant lines (for details, see Material and Methods). co; Cortex, en; Endodermis, ep; Epidermis, nd; Not detected, NLS; Nuclear Localization Signal. Red arrowheads indicate xylem pole endodermal cells. Boxplot centers show the median. Individual letters show significantly different groups according to a post hoc Bonferroni-adjusted paired two-sided T-test. For more information on data plots see the statistics and reproducibility section. For a) and b) the images are representative of previously published lines8,19. n represents independent biological samples. In d) n represents individual measurements across 16 independent biological samples. For individual P values see supplementary table 2. Scale bars represent 25 μm.
In the stele, cytokinin biosynthetic enzymes LOG3 and LOG4 turn xylem precursors into a cytokinin source, enhancing signaling in neighboring cells8. Interestingly, log4, not log3 mutants, showed lower passage cell numbers (Fig. 3c, Extended Data Fig. 7g). log4 ahp6-1 double mutants did not lead to further reduction of passage cell occurrence (Extended Data Fig. 7g), suggesting that AHP6 and LOG4 act in one pathway. Specificity of LOG4 can be explained by LOG3 transcription being restricted to the stele, whereas LOG4 is mainly expressed in xylem pole-associated endodermal cells (Fig. 3b)8. Interestingly, LOG4-GFP expression in differentiating, but not meristematic endodermal cells, rescued passage cell numbers (Extended Data Fig. 7f), suggesting that LOG4 maintains passage cell differentiation rather than being required for specification. Additionally, log4 mutants are not affecting length of xylem pole endodermis (Extended Data Fig. 7b). Both AHP6 and LOG4 expression are reduced by cytokinin application6 (Extended Data Fig. 7a,c) and this effect could explain the high sensitivity of passage cell differentiation towards cytokinin. Combining ahp6-1 with late endodermis-specific inhibition of auxin signaling further reduced passage cell differentiation (Extended Data Fig. 7e,h), suggesting that, in absence of cytokinin repression, local auxin perception can partially maintain passage cell presence. None of the investigated mutants showed severe root developmental defects, although ahp6-1 had a slight reduction in lateral root emergence (Extended Data Fig. 8b).
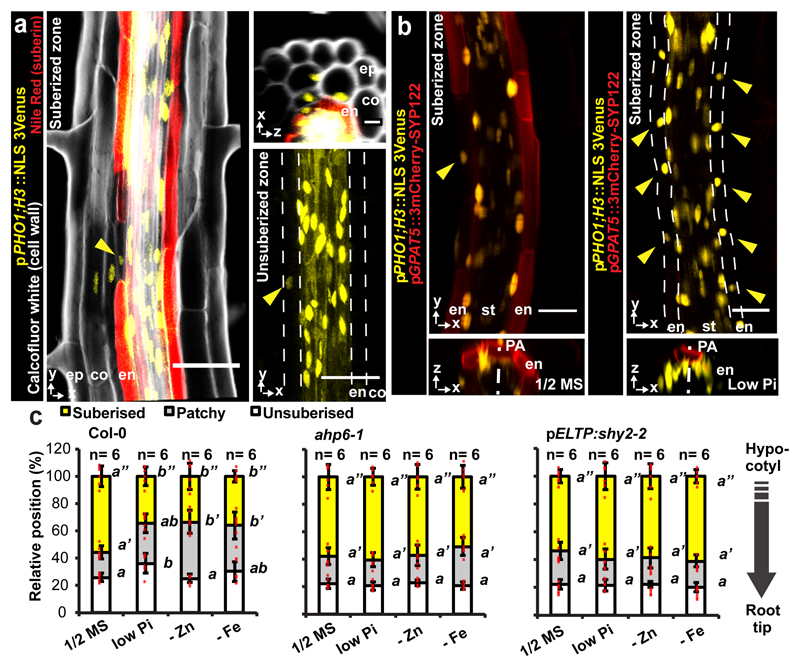
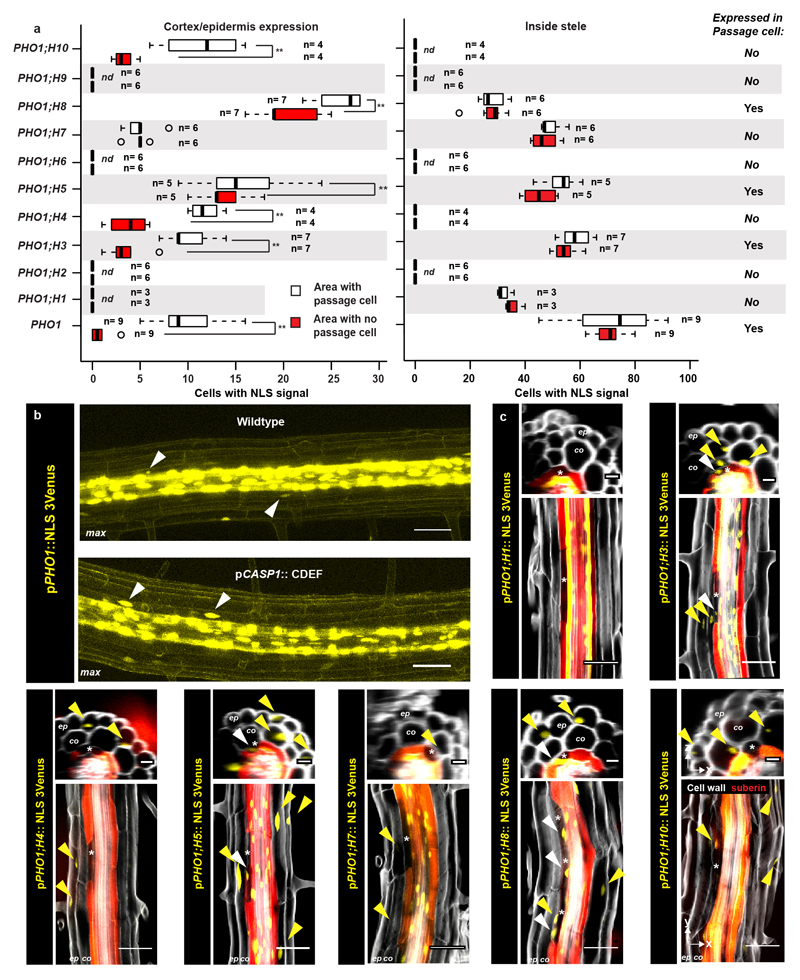
Absence of suberisation in passage cells could generate privileged sites for transport and communication. Despite their small surface, uptake of some nutrients has been correlated with passage cell numbers20–22 and passage cells might include transporters that would be absent in suberised cells. Indeed, the phosphate efflux protein PHO1, was reported to be expressed in both stele and xylem pole-associated endodermal cells22. In order to extend on this solitary finding, we generated sensitive, triple-Venus based reporter lines for the entire PHO1 family. Besides showing stele expression, we found PHO1 and some homologs to be specifically expressed in passage cells (Fig. 4a, Extended Data Fig.s 9a-c). Intriguingly, we additionally observed clusters of cortical and epidermal expression for many of these transport-mediating genes (Fig. 4a, Extended Data Fig. 9c). Counting cluster occurrence revealed their clear spatial association with passage cell presence in the endodermis (Extended Data Fig. 9a). Association of cortical/epidermal expression of PHO1 family members with underlying passage cells could arise from stele-derived signals that exit through passage cells (Fig. 4a) and possibly funneling nutrients, or biotic signals from epidermis towards xylem (Fig. 5). Such a role in communication has been proposed for hypodermal passage cells23.
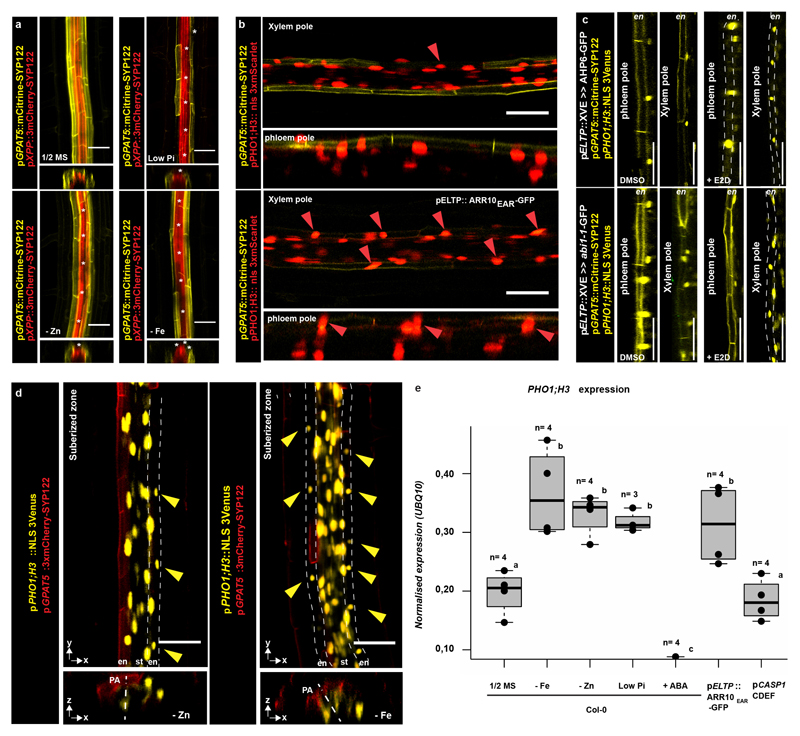
Figure 4. Passage cell-associated expression of PHO1;H3.
a) PHO1;H3 reporter activity (NLS-3mVenus) in suberized and unsuberised zone of differentiated endodermis. Cell walls (grey) visualized by Calcofluor White and suberin (red) using Nile Red. b) PHO1;H3 expression in suberised zone of seedlings germinated on standard medium, 10 μM inorganic phosphate (low Pi), Zn- or Fe-deficient media. Suberised endodermis cells highlighted by GPAT5 expression. Yellow arrowheads indicate passage cell nuclei. c) Endodermal suberisation in Col-0, ahp6-1 and lines with repressed auxin signaling (through expression of shy2-2) in differentiated endodermis grown on standard medium, low Pi, Zn- or Fe-deficient media. Red dots represent individual data points. Notice that for all stacked graphs there are 3 measurements per root (unsuberised zone (white), patchy zone (grey) and suberised zone (yellow)). Co; Cortex, En; Endodermis, Ep; Epidermis, NLS; Nuclear Localization Signal, PA; Phloem Axis St; Stele. Bar graphs represent mean ± SD. Individual letters show significantly different groups according to a post hoc Bonferroni-adjusted paired two-sided T-test. For more information on Data plots see the statistics and reproducibility section. For a) and b) the image is representative of 12 independent lines. n represents independent biological samples. For individual P values see supplementary table 2. Scale bars represent 25 μm.
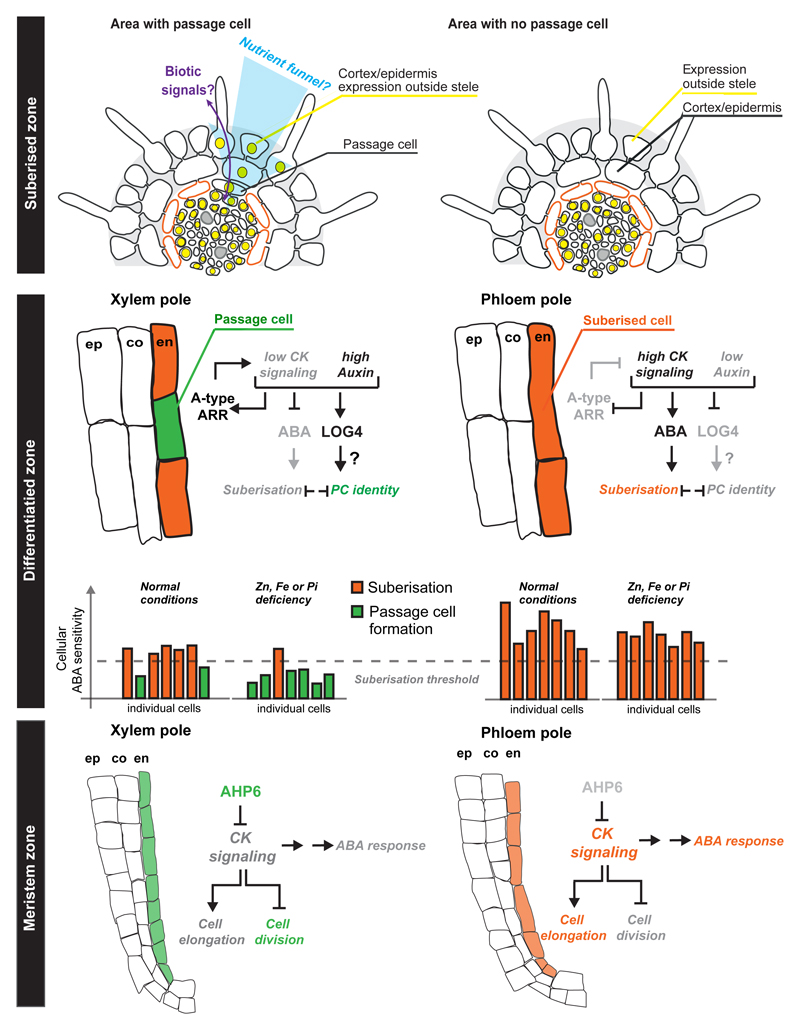
Figure 5. Overview of endodermis circumferential patterning and passage cell formation.
In the meristem zone endodermal cell above the incipient xylem pole are exposed to stele-produced AHP6, inhibiting cytokinin signaling. This leads to prolonged division and thereby shorter endodermal cells than in the phloem pole. Another output should be an overall lower response to ABA through an as yet unknown mechanism. In the differentiation zone, we hypothesize that the lower ABA response in xylem pole endodermis stochastically causes some cells to be below-threshold for suberisation. The non-suberised cells maintain low cytokinin signaling by expression of A-type ARR elements and also serve as - possibly auxin-dependent - cytokinin producers through expression of LOG4. The status of ABA signaling is modulated by nutrient status and thus passage cells can be closed upon sufficiently high ABA. In the fully suberised zone, the non-suberised xylem-pole associated endodermal cells (passage cells) express specific genes whose domain can spread to the cortex/epidermis and serve to increase the area for uptake and/or to exchange signals with the environment (such as signals for biotic interactions). Nutrient stresses (Zn, Fe or Pi) would increase resistance of xylem pole-associated endodermis cells towards ABA and lead to an increase in non-suberised cells allowing for increased transport-related gene expression. ABA; Abscisic Acid, CK; Cytokinin, Co; Cortex, En; Endodermis, Ep; Epidermis, PC; Passage Cell.
Expression of PHO1 family members provides a positive definition of passage cells. Indeed, PHO1;H3, the most easily visualised member, shows expression in individual endodermal cells before onset of suberisation, suggesting that specification of passage cells precedes suberisation (Fig. 4a). We therefore used PHO1;H3 to assess whether cytokinin-suppression of suberisation correlates with expansion of its expression. We found that endodermal cytokinin suppression leads to general expression of PHO1;H3 in the endodermis, supporting that endodermal cells acquire passage cell features upon cytokinin repression (Extended Data Fig. 10b). Suppression of ABA signaling only expanded PHO1;H3 expression within xylem pole endodermis, despite an equally strong suppression of suberisation in all endodermal cells (Extended Data Fig. 6 and 10c), again supporting a later action of ABA, subsequent to endodermal patterning.
Finally, we investigated changes in PHO1;H3 expression upon physiological stress conditions. Consistent with its putative role in phosphate transport, we found that phosphate-deficiency suppressed suberisation specifically in xylem pole endodermis and expanded PHO1;H3 expression into those cells (Fig. 4b). This response was abrogated in lines with enhanced cytokinin or suppressed auxin signaling (Fig. 4c). Expansion of PHO1;H3 expression in xylem pole endodermis was similarly observed under zinc and iron-deficiency conditions, previously shown to decrease suberisation2 and to enhance PHO1;H3 expression24 (Fig. 4c, Extended Data Fig. 10d). This suggests that PHO1;H3 expansion results from an expansion of passage cell occurrence, rather than a specific response to phosphate deficiency. qPCR analysis of PHO1;H3 expression corroborated our PHO1;H3 promoter fusion results (Extended Data Fig. 10e).
Our findings that two endodermal cell-types of distinct responsiveness to nutrients and hormones and different uptake and sensing potential co-exist within roots should profoundly impact current models of nutrient uptake in plants. Moreover, influence of isolated passage cells on neighboring cells might explain how the negligible surfaces of these evolutionary conserved cells could play important roles in nutrient transport or sensing (Fig. 5).
Material and Methods
Plant material and growth conditions
For all experiments, seeds were surface sterilised in 70 % EtOH containing 0,05 % Triton-X100, washed twice in 96 % EtOH, plated on ½ MS (Murashige & Skoog) containing 0.8 % agar (Duchefa) plates and vernalised at 4°C for 2 days. Seedlings were grown vertically at 22 °C, under long day conditions (18 h, 100 µE). Unless stated otherwise, all microscopic analyses were performed on roots of 5-day-old seedlings. For hormone and estradiol (Sigma) treatments, 4-day-old seedlings were transferred to ½ MS plates supplemented with hormones or mock for 1 day unless otherwise indicated. Zn and Fe deficiency studies were done as previously described2. For low Pi, micro-agar containing 10 μM Pi (Duchefa Biochemie) and MS without Pi (Caisson) was used. Plants were grown under 24h light.
Cloning
The following published mutants and transgenic lines were used in this study: pCASP1::CDEF125, ahp6-16, pAHP6::AHP6-Venus and pAHP6::AHP6-3Venus19 log3, log4, log34, pLOG3::NLS3GFP and pLOG4::NLS3GFP8 pGPAT5::mCitrine-SYP1222. pDonor221 containing ARR10EAR26. pARR-NLS3YFP constructs for ARR3-10, ARR14-17 and ARR21 were generated using LIC cloning27. pARR-NLS2YFP plasmids were constructed for the other ARRs using Gateway technology28 (Life Sciences). The NLS 3mScarlet construct was obtained by DNA synthesis (ThermoFischer) into a pDonor221 entry vector. To generate the estradiol inducible version of the ELTP promoter we followed a recently published procedure based on a Gateway™ compatible XVE system29 Briefly, 464 bp of the 5’UTR region of the ELTP gene was cloned into XVE using a KpnI site using Infusion technology (Clonetech). A list of primers and promoters can be found in Supplementary Table 1. Corresponding gene numbers listed in supplementary table 1 or are as follows: ABI1, At4g26080; AHP6, At1g80100; CASP1, At2g36100; CDEF1, At4g30140; ELTP, At2g48140; GPAT5, At3g11430; LOG3, At2g37210; LOG4, At3g53450; SYP122, At3g52400
Imaging
Confocal laser scanning microscopy experiments were performed on a Zeiss LSM 880 or a Leica SP8X microscope. All combinatorial fluorescence analyses were run as sequential scans. For fluorescence analysis of marker expression a Clearsee-based30 protocol was established. Cell walls were stained with Calcofluor White (Polysciences) and suberin was stained with Nile Red (Sigma). The following settings were used to obtain specific fluorescence signals: EGFP; ex: 470 nm, em: 490-515 nm. mCitrine (with EGFP); ex: 525 nm, em: 530-550 nm. mCitrine (alone), YFP or mVenus; ex: 514 nm, em: 520-550 nm. dsTomato; ex: 561 nm, em: 565-595 nm. mCherry; ex: 594 nm, em: 600-650 nm. Nile Red; ex: 561 nm, em: 600-650 nm. Calcofluor White; ex: 405 nm, em: 430-460 nm. Fluorol Yellow (FY, Sigma) and xylem analysis were done on a Leica DM5000s fluorescence microscope using a GFP filter (Ex: 470/40 nm dicroic 500 nm em: BP 525/50 nm) for FY and a TX2 filter (ex: 560/40 nm dicroic 595 nm, em: 645/75 nm) in combination with differential interference contrast (DIC) for xylem analysis.
Transcriptional analysis
Total RNA was extracted from 100 mg plant tissue using a Trizol® based PureLink® RNA Mini Kit (Thermo Fisher), DNAse-treated and purified using RNeasy MinElute Cleanup Kit (Qiagen). Reverse transcription was done using a Superscript IV first strand synthesis system (Thermo Fisher). All steps were done according to manufacturer protocols. The PCR reaction was done on a Stratagene® Mx3005P thermocycler using a MESA Blue Sybr Green kit. All transcripts are normalised to UBQ10 expression (see supplementary table 1).
Tissue staining and analysis
Unless otherwise noted, suberin lamellae were observed after Fluorol Yellow (FY) staining as previously described2,25,31,32. Suberin patterns were observed and counted from the hypocotyl junction to the onset of endodermal cell elongation. Three distinct patterns were considered: continuous suberin lamellae, patchy suberin lamellae (corresponding to the area wherein individual cells are suberised) and non-suberised (corresponding to the youngest part of the root). Passage cells were determined solely in the zone containing continuous suberin lamellae. Passage cell occurrence was obtained by counting the total number of passage cells in both xylem poles divided by the length (in cells) of the zone. For quantifying the severity of ahp6-1 xylem defects, the number of xylem pole-associated endodermal cells above the defective xylem strand were counted and related to total number of endodermal cells above each strand. 5-day-old roots were cleared using Clearsee30 and stained with basic Fuchsin (Sigma) overnight as previously reported33.
Statistics and reproducibility
All statistical analyses were done in the R environment34 For multiple comparisons between genotypes, a one-way ANOVA was performed with a Bonferroni-adjusted ad hoc pairwise two-sided T-test. Groups where differences gave a P value lower than 0,05 were considered significantly different. Binary comparisons were performed using a two-tailed Student t-test in Microsoft™ Excel™ P-value lower than 0,01 were considered significantly different. All bar graphs represent the mean ± SD. For all boxplots the center depicts the median while the lower and upper box limits depicts the 25th and 75th percentile respectively. Whiskers represent minima and maxima. Closed dots depict individual samples. In cases where n>10, open dots depicts outliners. In all cases, individual biological samples are states as n. All experiments as well as representative images were repeated independently at least 3 times. Individual P-values for all statistical analyses can be found in supplementary table 2.
Extended Data
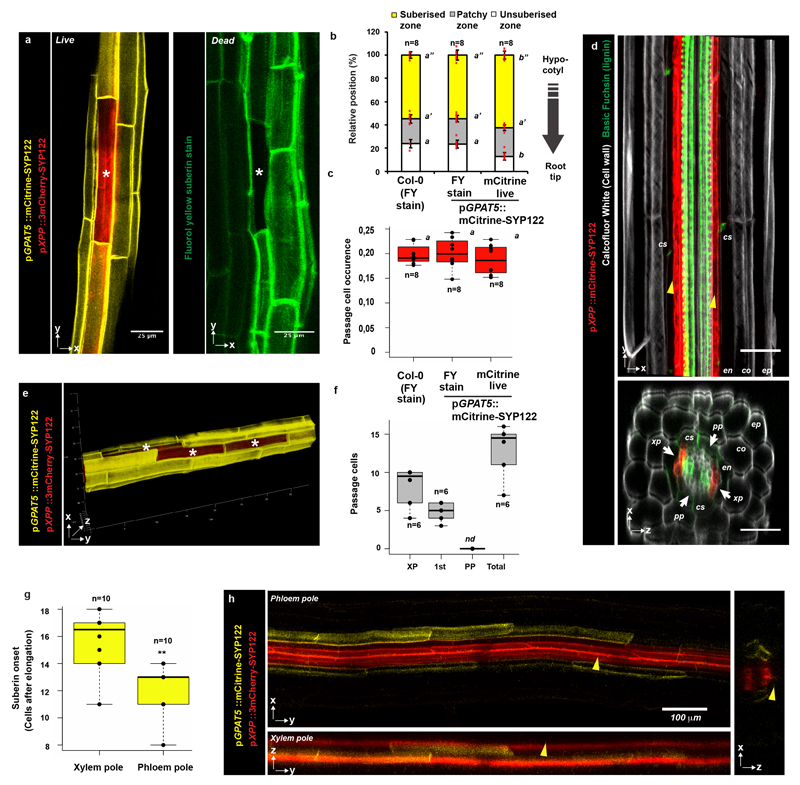
Extended Data Figure 1. Passage cells and suberisation in Arabidopsis.
a) A single xylem pole-associated passage cell surrounded by suberised cells as visualized in live imaging by expression of the suberin biosynthetic gene GPAT5 driving expression of a plasma membrane localized mCitrine reporter (mCitrine-SYP122) (yellow, left panel) or by the suberin-specific dye fluorol yellow (green, right panel). In the left panel, the xylem pole pericycle is highlighted using the promoter pXPP driving a 3mCherry reporter fused to the plasma membrane localized SYP122 (3mCherry-SYP122). Note that Fluorol Yellow protocol, which requires heating (70°C) of the sample and is incompatible with fluorescent protein detection. b) Comparison of endodermal suberisation in Col-0 and plants expressing the GPAT5-based reporter determined either by the suberin-specific dye Fluorol Yellow (FY) or live mCitrine expression, respectively. Red dots represent individual data points. c) Comparison of passage cell occurrence in Col-0 and plants expressing the GPAT5-based reporter determined either by the suberin-specific dye Fluorol Yellow (FY) or live mCitrine expression. Dots represent individual data points d) Expression of a plasma membrane localized mCitrine-SYP122 marker (red) driven by the xylem pole-specific promoter pXPP in the zone of protoxylem onset. Roots were cleared using ClearSee and stained with Basic Fuchsin (green) and Calcofluor White (grey)33. e) Radial- and longitudinally connected passage cells in the xylem pole of the suberised zone. f) Direct quantification of passage cells residing directly above xylem pole (XP), first side cell to the xylem pole (1st) or phloem pole (PP) in 5-day-old Col-0 plants. Dots represent individual datapoints. g) Quantification of the onset of endodermal suberisation in the phloem and xylem poles of roots expressing markers as in a). Dots represent individual data points. h) Representative images of the patchy zone of endodermal suberisation in the phloem and xylem poles of roots used for quantification in f). Yellow arrowheads indicate the xylem pole. co; cortex, cs; Casperian strip, en; endodermis, ep; epidermis, FY; fluorol yellow, pp; phloem pole, xp; xylem pole. Individual letters highlight significant differences between groups. Notice that for all stacked graphs there are 3 measurements per root (unsuberised zone (white), patchy zone (grey) and suberised zone (yellow)). Bar graphs represent mean ± SD, boxplots show median. Individual letters show significantly different groups according to a post hoc Bonferroni-adjusted paired two-sided T-test. For more information on data plots see the statistics and reproducibility section. a) and e) represent 5 independent lines, all stainings were repeated 3 times. n represents independent biological samples. ** Depicts significant difference in a two-tailed T-test. For individual P values see supplementary table 2. Scale bars represent 25 μm unless otherwise mentioned.
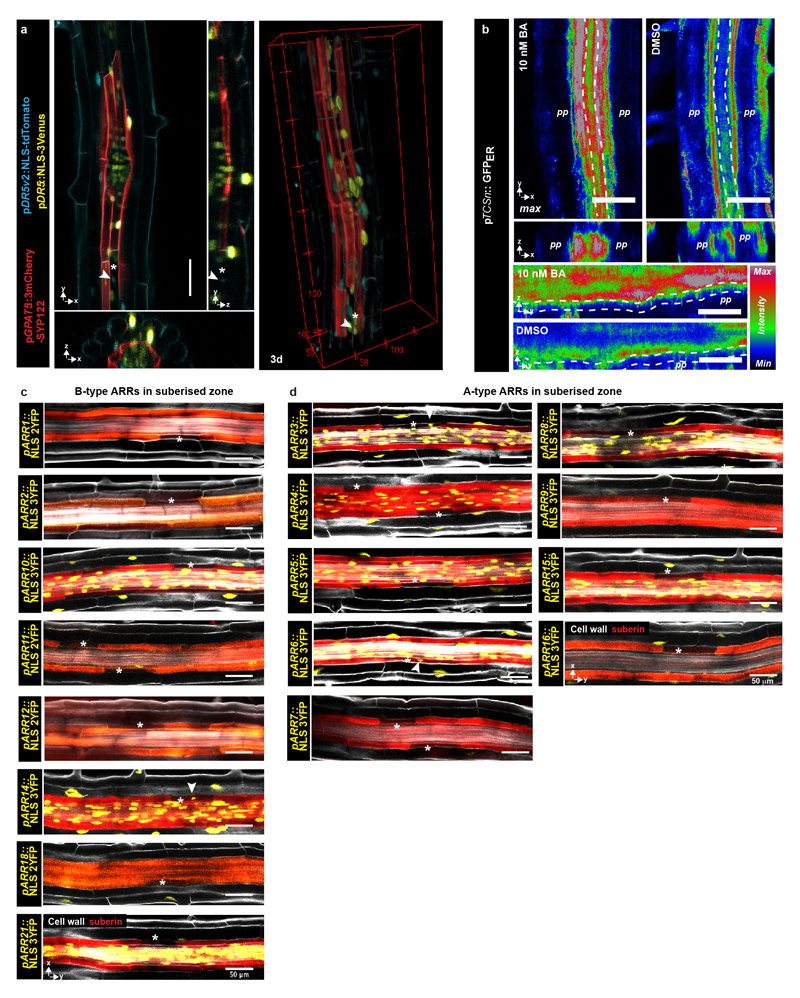
Extended Data Figure 2. Auxin and cytokinin signaling in the suberised root zone.
a) Activity of the auxin-signaling reporter DR5 (yellow) as well as the highly sensitive DR5v2 (blue) in an area of the suberised zone of a 5-day-old root with an emerging lateral root. Suberised cells were visualized based on the suberin biosynthetic gene GPAT5 driving expression of a plasma membrane localized 3mCherry-based reporter b) Expression of ER-localized GFP driven by the cytokinin signaling reporter TCSn in the phloem and xylem poles of 5-day-old roots in the suberized zone. Plants were either grown on plates containing 5 nM cytokinin (BA) or a mock treatment (DMSO). Punctured lines indicate the endodermis. c) Expression of B-type ARRs in the suberised endodermis of 5-day-old roots, suberin and cellwalls are stained using a Clearsee protocol in combination with Nile Red and Calcoflour White, respectively33 d) Expression of A-type ARRs in the suberised endodermis of 5-day-old roots, suberin and cell walls as in d). All stainings were repeated 3 times. For a) and b) the image is representative of 8 independent lines. White arrowheads depict passage cell nuclei. Asterisk marks passage cells. BA; Benzyladenine, Co; Cortex, En; Endodermis. Scale bars represent 50 μm.
Extended Data Figure 3. Hormone-induced closure of passage cells.
Time course analysis showing behavior of passage cells visualized by mCitrine-SYP122 driven by the promoter of the suberin synthesis marker gene GPAT5 for 9 hours on ½ MS media containing DMSO, cytokinin (BA), auxin (NAA) or abscisic acid (ABA). Red arrowheads point to ectopic suberisation in the cortex upon ABA treatment. Asterisks mark passage cells. ABA; Abscisic acid, BA; Benzyladenine, Co; Cortex, En; Endodermis, NAA; Naphtalene acetic acid. All time courses were repeated 3 times. Scale bars represent 50 μm.
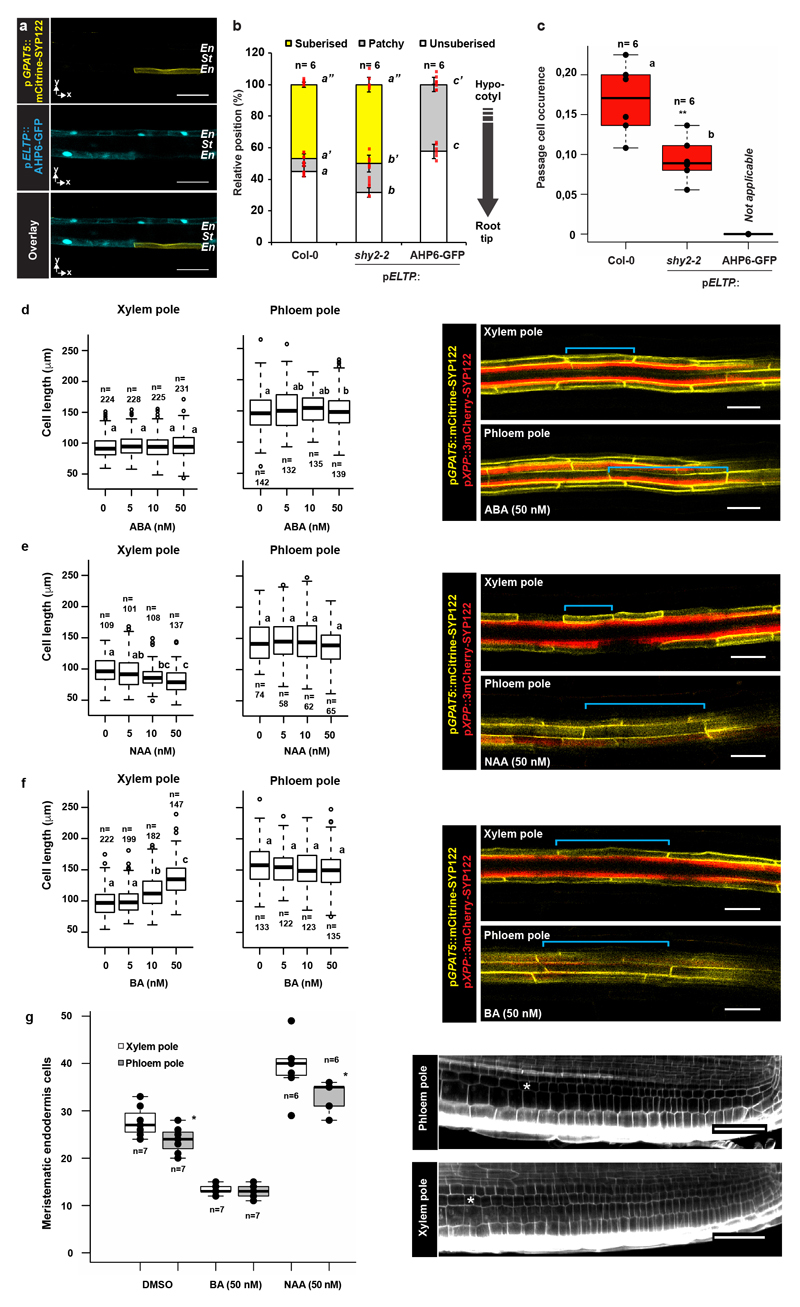
Extended Data Figure 4. Hormone-induced changes in endodermal cell lengths.
a) Expression of mCitrine-SYP122 driven by the GPAT5 promoter (yellow) in the fully suberised zone in plants expressing the dominant cytokinin-signaling inhibitor AHP6 fused to GFP in the differentiated endodermis using the ELTP promoter (Blue). b) Endodermal suberisation in 5-day-old seedlings expressing AHP6-GFP or the dominant auxin signaling repressor shy2-2 in the differentiated endodermis. Red dots represent individual datapoints. c) Occurrence of passage cells in 5-day-old seedlings expressing AHP6-GFP or the auxin signaling repressor shy2-2 in the differentiated endodermis. Dots represent individual datapoints. d-f) Length of suberised endodermal cells measured in the suberised zone of plants expressing pGPAT5::mCitrine-SYP122 and pXPP::3mCherry-SYP122 constructs. Open circles represent outliers. Plants were grown for 5 days on ½ MS media containing depicted concentrations of d) Abscisic acid (ABA). e) Auxin, Naphtalene acetic acid (NAA). f) Cytokinin, Benzyladenine (BA). g) Amount of meritematic cells in the phloem and xylem pole endodermis was counted in cleared roots stained with Calcofluor White33 to highlight cell walls. Dots represent individual datapoints. Notice that for all stacked graphs there are 3 measurements per root (unsuberised zone (white), patchy zone (grey) and suberised zone (yellow)). Protoxylem or -phloem was used as a marker to identify the poles. Cells were counted from the QC to onset of elongation. Asterisks highlight the last cell of the division zone. Blue lines highlight length of an individual cell. Letters indicate significant differences between groups. Bar graphs represent mean ± SD, boxplot centers show median. Individual letters show significantly different groups according to a post hoc Bonferroni-adjusted paired two-sided T-test. For more information on data plots see the statistics and reproducibility section. In a) the image is representative of 12 independent lines. In g) all stainings were repeated 3 times. n represents number of measurements across 16 independent biological samples. ** Depicts significant difference (p< 0,01) in a two-tailed T-test. Scale bars represent 25 μm.
Extended Data Figure 5. Manipulation of suberisation through signaling repression.
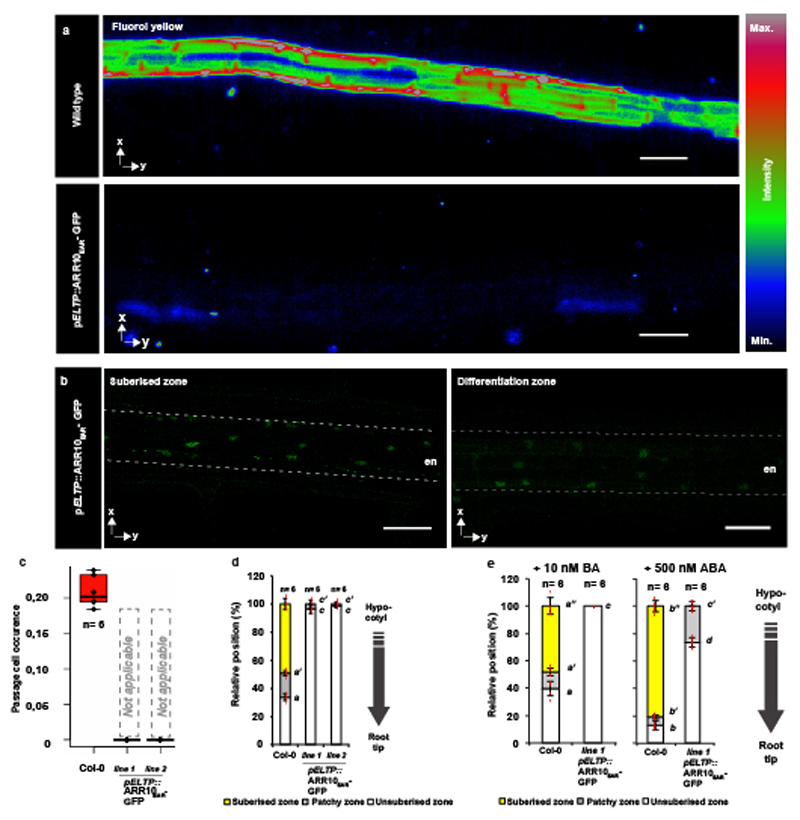
a) Representative pictures of Fluorol Yellow staining of suberin in lines expressing ARR10EAR-GFP in all differentiated endodermal cells driven by the ELTP or CASP1 promotors. b) Occurrence of passage cells in lines expressing ARR10EAR-GFP in all differentiated endodermal cells using the ELTP and CASP1 promotor. c) Behavior of suberin in lines expressing ARR10EAR-GFP in all differentiated endodermal cells using the ELTP and CASP1 promotor. d) Behavior of suberin in 5-day-old plants expressing ARR10EAR-GFP in all differentiated endodermal cells using the ELTP and CASP1 promotor. Dots represent individual datapoints. Red dots represent individual datapoints. e) Behavior of suberin in 5-day-old plants expressing ARR10EAR-GFP in all differentiated endodermal cells using the ELTP and CASP1 promotor when plants were germinated on either cytokinin (BA) or abscicic acid (ABA). Red dots represent individual datapoints. Notice that for all stacked graphs there are 3 measurements per root (unsuberised zone (white), patchy zone (grey) and suberised zone (yellow)). Bar graphs represent mean ± SD, boxplots show median. Individual letters show significantly different groups according to a post hoc Bonferroni-adjusted paired two-sided T-test. For more information on data plots see the statistics and reproducibility section. In b) the image is representative of 9 independent lines. All stainings were repeated 3 times. n represents independent biological samples. Scale bars represent 50 μm.
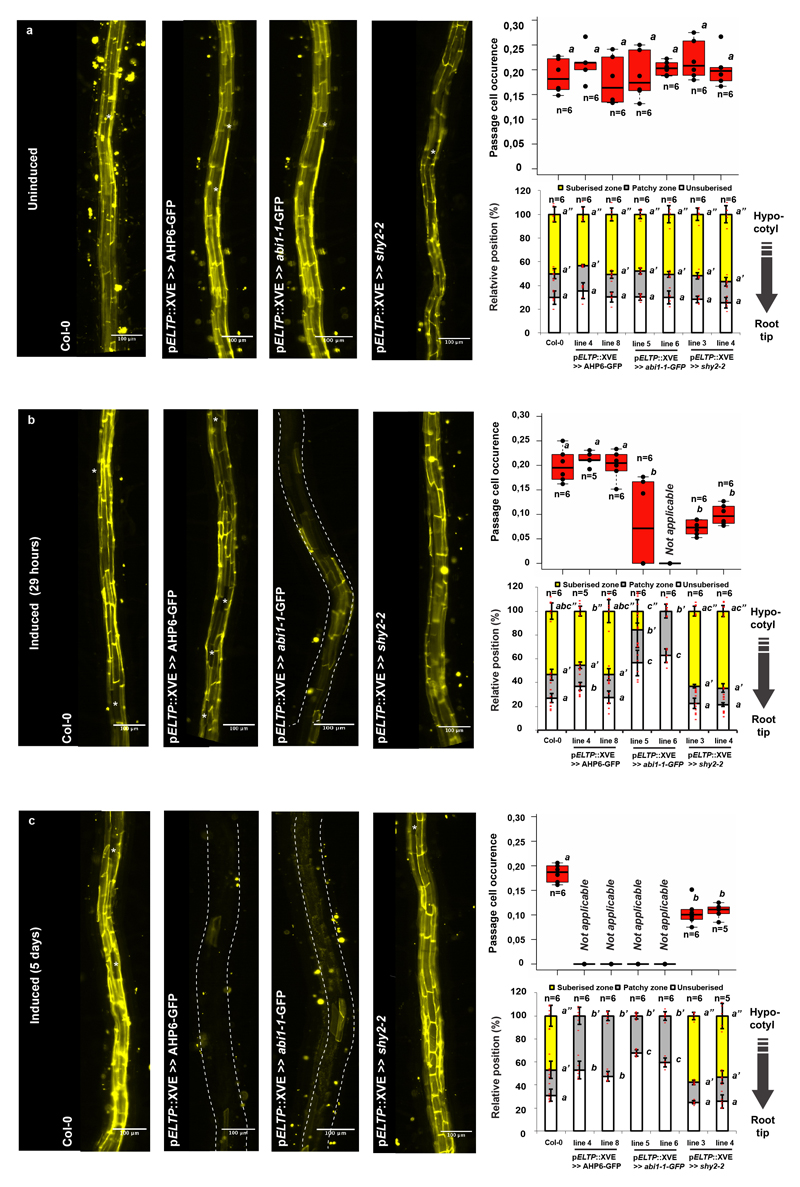
Extended Data Figure 6. Temporal control of suberin inhibition.
Expression of temporally controlled dominant inhibitors of cytokinin (AHP6-GFP), ABA (abi1-1-GFP) or auxin (shy2-2) signaling in the differentiated endodermis using an estradiol inducible system (XVE)19. a-c) Fluorol Yellow staining (left) and quantification of passage cells (top right) and suberin (bottom right) in the late endodermis of plants grown on ½ MS media containing DMSO for 5 days a), plants grown for 4 days on ½ MS media containing DMSO then transferred to 5 μM estradiol for 29 hours b) or germinated for 5 days on ½ MS media plates containing 5 μM estradiol c). nd; not detected. Asterisks indicate passage cells. All dots represent individual datapoints. Notice that for all stacked graphs there are 3 measurements per root (unsuberised zone (white), patchy zone (grey) and suberised zone (yellow)). n represent biologically independent samples. Bar graphs represent mean ± SD, boxplot centers show median. Individual letters show significantly different groups according to a post hoc Bonferroni-adjusted paired two-sided T-test. For more information on data plots see the statistics and reproducibility section. Images in a) - c) are representative of 9 independent lines. All stainings were repeated 3 times. n represents independent biological samples. Scale bars represent 100 μm.
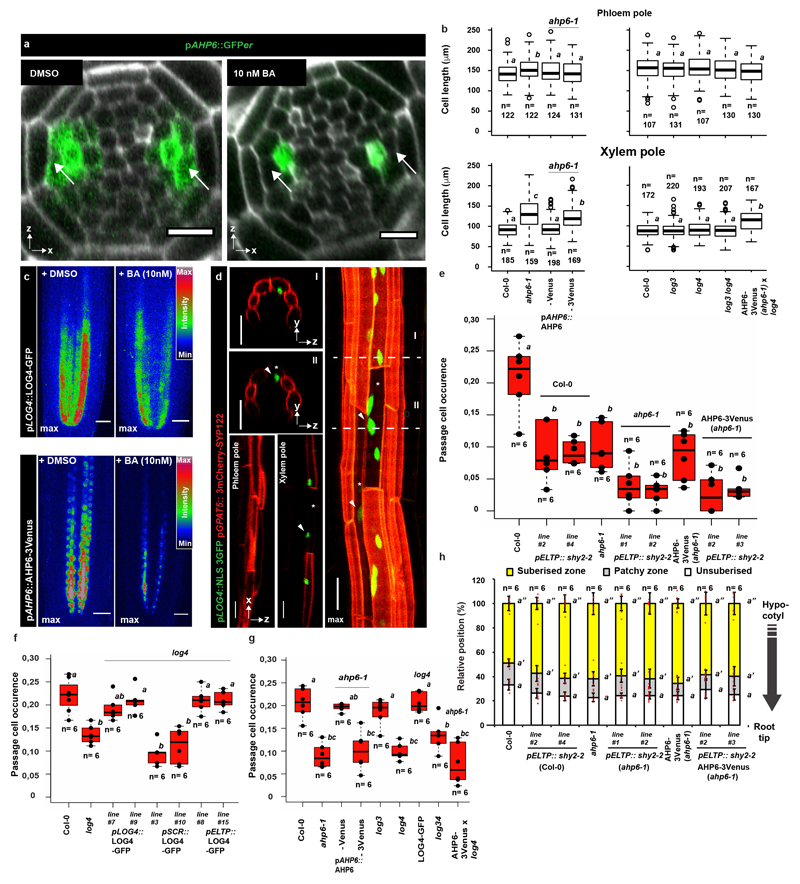
Extended Data Figure 7. Cytokinin-dependent formation of passage cells.
a) Expression of AHP6 visualized by an endoplasmic reticulum-localized GFP (GFPer)19 in the root apical meristem of plants grown either in presence of a mock treatment (DMSO) or 10 nM cytokinin (BA). Arrows point to xylem pole pericycle cells b) Length of suberised endodermal cells in the phloem and xylem poles of 5-day-old ahp6-1 and log mutants, complementing lines and stacked mutants grown on ½ MS plates. Data is partly overlapping with Figure 3. Open circles represent outliers. c) Expression of LOG4-GFP and AHP6-3Venus driven by their native promoters in the root apical meristem of plants grown either in presence of mock treatment (DMSO) or 10 nM cytokinin (BA) d) Expression of LOG4 in the suberised zone of 5-day-old seedlings visualized by the native LOG4 promoter driving expression of an NLS-3GFP construct. Suberised endodermal cells were highlighted by expression of the suberin biosynthetic marker pGPAT5::3mCherry-SYP122. e) Occurrence of passage cells in lines with inhibited AHP6 diffusion in combination with repressed auxin signaling (through expressing of shy2-2) in the differentiated endodermis. Dots represent individual datapoints. f) Passage cell occurrence in the log4 mutant complemented with a LOG4-GFP construct driven by either the native promotor (pLOG4), an early endodermis promoter (pSCR) or a differentiating endodermis promoter (pELTP). Dots represent individual datapoints. g) Occurrence of passage cells in the suberised zone of 5-day-old ahp6-1 and log mutants, ahp6 log doubles additionally complemented by non-mobile AHP6 in order to obtain endodermis-specific defects. Dots represent individual datapoints. h) Behavior of suberin in plants with or without inhibited auxin perception in the late endodermis grown on ½ MS plates. Red dots represent individual datapoints. Notice that for all stacked graphs there are 3 measurements per root (unsuberised zone (white), patchy zone (grey) and suberised zone (yellow)). Bar graphs represent mean ± SD, boxplot centers show median. Individual letters show significantly different groups according to a post hoc Bonferroni-adjusted paired two-sided T-test. For more information on data plots see the statistics and reproducibility section. Images in c) and d) represent 8 independent lines. All stainings were repeated 3 times. n represents independent biological samples. In b) n represents measurements across 16 biologically independent samples. For a) scale bars represent 10 μm. For all others 25 μm.
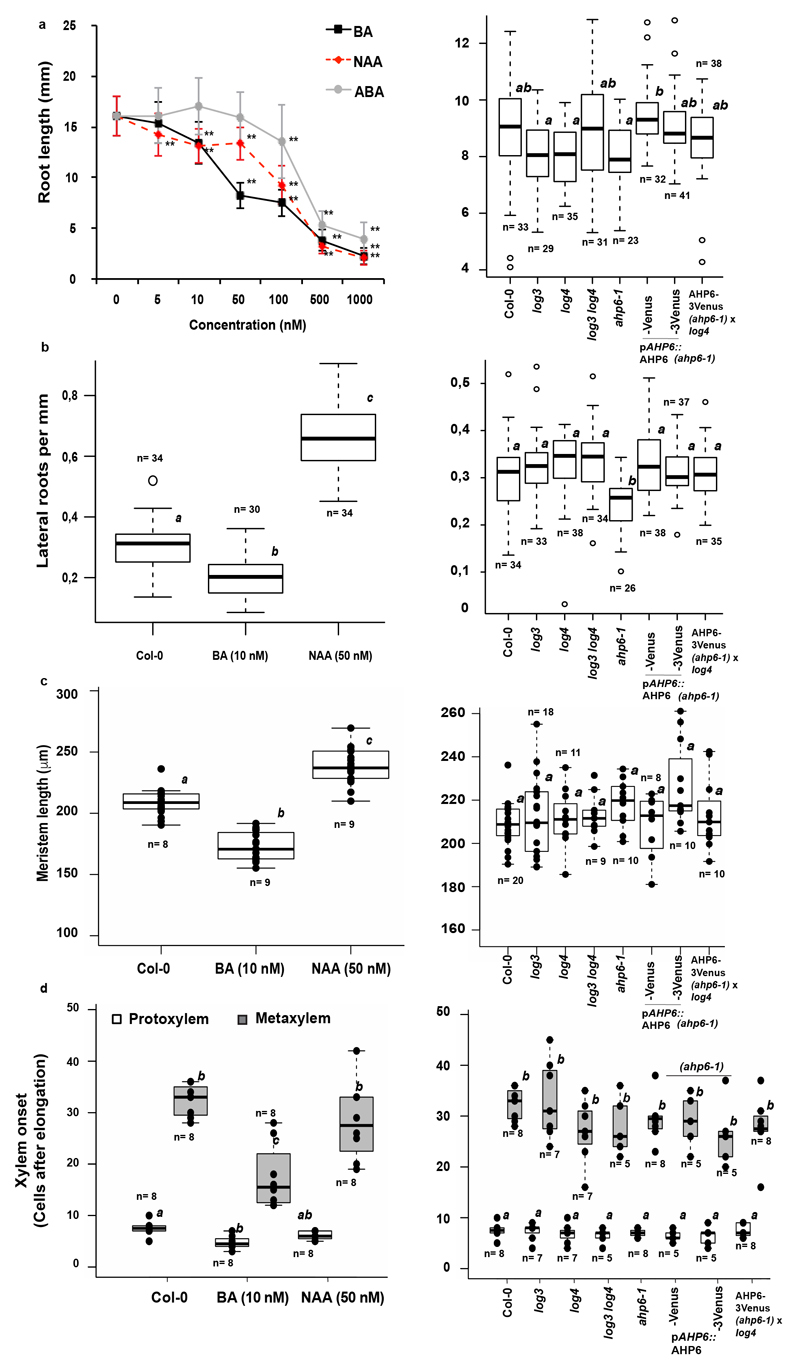
Extended Data Figure 8. Phenotypic analysis of hormone-treated plants and mutants.
a) Root length of 5-day-old plants either germinated on increasing concentration of cytokinin (BA), auxin (NAA) or abscisic acid (ABA) (left) or of mutants used in this study (right). Open circles represent outliers. b) Emerged lateral roots per mm of 10-day-old Col-0 roots germinated in presence of DMSO, 10 nM cytokinin (BA) or 50 nM auxin (NAA) (left) or of mutants used in this study (right). Open circles represent outliers. c) Length of the root apical meristem of 5-day-old Col-0 plants germinated on either DMSO, 10 nM cytokinin (BA) or 50 nM auxin (NAA) (left) or of mutants used in this study (right). Dots represent individual datapoints. d) Onset of protoxylem and metaxylem after the elongation zone of 5-day-old seedling germinated in presence of DMSO, 10 nM cytokinin (BA) or 50 nM auxin (NAA) (left) or of mutants used in this study (right). Dots represent individual datapoints. ABA; Abscisic acid, BA; Benzyladenine, NAA; Naphtalene acetic acid. Bar graphs represent mean ± SD, boxplot centers show median. Individual letters show significantly different groups according to a post hoc Bonferroni-adjusted paired two-sided T-test. For more information on data plots see the statistics and reproducibility section. n represents independent biological samples. In a) ** Depicts significant difference (p<0,01) in a two-tailed T-test n = 25 independent biological replicas for each treatment.
Extended Data Figure 9. The PHO1 transporter gene family as marker for passage cells.
a) Expression of PHO1 family members in the cortex/epidermis (left panel) and inside the stele (right panel) within the suberised zone of 5-day-old roots grown on ½ MS media. Individual nuclei showing expression of the respective NLS reporter were counted in similar 3D stacks taken in either a fully suberized area (red bars) or an area containing one passage cell (white bars). Open circles depict outliers. b) Expression of PHO1 in 5-day-old seedling in the late endodermis of Wildtype or a suberin-degradation line with virtually absent suberin (pCASP1::CDEF1). c) Representative images of each of the PHO1 members’ expression, highlighted by NLS-3Venus reporter, found to be expressed in roots of 5-day-old seedlings. Seedlings stained with Nile Red for suberin and Calcofluor White for cell walls. Scale bars in XZ projections represent 10 μm. White arrowheads highlight passage cell nuclei, yellow arrowheads point toward nuclei of cortex/epidermal cells. Asterisks emphasize passage cells. nd; not detected. Boxplot centers show median. ** depicts significant differences between groups (P<0,01) according to a two-sided T-test. For more information on data plots see the statistics and reproducibility section. In b) and c) the images represent 15 and 11 independent lines respectively, all stainings were repeated 3 times. n represents independent biological samples. Unless otherwise stated, scale bars represent 25 μm. For inserts scale bars represent 10 μm.
Extended Data Figure 10. Nutrient deficiency responses of suberisation in the xylem pole.
a) Expression of the suberin marker GPAT5 and the xylem pole pericycle marker XPP using a mCitrine-SYP122 or a 3mCherry-SYP122 plasma membrane-anchored reporter, respectively figure is representative of 5 independent lines. Plants were germinated for 5-days on ½ MS media, plates with low (10 μM) inorganic phosphate (low Pi), no zinc (-Zn) or no iron (-Fe) image is representative of 4 independent lines. b) Expression of the suberin marker GPAT5 and PHO1;H3 using a mCitrine-SYP122 or a NLS 3mScarlet reporter respectively in the suberised zone of Col-0 plants or plants expression the dominant cytokinin signaling repressor ARR10-GFP in all differentiating endodermal cells. Each image is representative of 8 independent lines. c) Expression of the suberin marker GPAT5 and PHO1;H3 using a mCitrine-SYP122 or a NLS 3Venus reporter respectively in the suberised zone of plants expressing estradiol-inducible (XVE) versions of the dominant cytokinin signaling repressor AHP6-GFP or the dominant ABA signaling repressor abi1-1 in all differentiated endodermal cells. Plants were grown for 5 days in presence of DMSO or 5 μM Estradiol (E2D), all treatments were repeated 3 times. Each image is representative of 5 independent lines. d) Expression of PHO1;H3 and the suberin marker GPAT5 in roots of 5-day-old Col-0 plants grown on ½ MS media, plates containing no iron (-Fe) no zinc (-Zn) with low (10 μM) inorganic phosphate (low Pi). Each image is representative of 9 independent lines. All treatments were repeated 3 times. e) Transcriptional analysis of PHO1;H3 expression in roots of 5-day-old Col-0 plants grown on ½ MS media, plates containing no iron (-Fe) no zinc (-Zn) with low (10 μM) inorganic phosphate (low Pi), in plants expression the dominant cytokinin signaling repressor ARR10-GFP in all differentiated endodermal cells or in plants with strongly reduced suberin deposition by expression of a suberin degrading enzyme (pCASP1::CDEF). Expression was normalized to that of UBQ10. Dots represent individual datapoints. Notice that for all stacked graphs there are 3 measurements per root (unsuberised zone (white), patchy zone (grey) and suberised zone (yellow)). Asterisks highlight unsuberised xylem pole endodermal cells. Boxplot centers show median. Individual letters show significantly different groups according to a post hoc Bonferroni-adjusted paired two-sided T-test. For more information on data plots see the statistics and reproducibility section. n represents independent biological samples. Scale bars represent 25 μm.
Supplementary Material
Acknowledgements
This work was supported by funds to N.G. from an ERC Consolidator Grant (GA-N°: 616228 – ENDOFUN), an SNSF grant (31003A_156261), an IEF Marie Curie fellowship (T.G.A) and an EMBO Long-term postdoctoral fellowship (R.U.). B.D.R., W.S. and B.W. were funded by the Netherlands Organisation for Scientific Research (NWO; VIDI-864.13.001) and The Research Foundation - Flanders (FWO; Odysseus II G0D0515N). We thank Arnaud Paradis and the Central Imaging Facility of the University of Lausanne for support. Misako Yamazaki is thanked for providing constructs. Bruno Müller, Dolf Weijers and Teva Vernoux are thanked for sharing material. We further thank Anthony Bishopp, Ari Pekka Mähönen, Dolf Weijers, Sabrina Sabatini, Veronica Grieneisen, Ykä Helariutta and Yves Poirier for helpful discussions. Aleksandar Vjestica, Colleen Drapek, Magdalena Marek and Marie Barberon are thanked for input to the manuscript. In addition, we would like to thank the three anonymous reviewers for constructive comments.
Footnotes
Data availability
All lines and data generated in this study are available from the corresponding authors upon request.
Author contributions
T.G.A. planned and conducted all experiments in the manuscript with input from N.G. and J.E.M.V. S.N. conducted initial experiments on PHO1 localisation, R.U. created and tested inducible vectors, J.E.M.V. created and tested shy2-2 lines, B.D.R, W.S. and B.W created and selected all ARR reporter lines. T.G.A and N.G. wrote the manuscript. All authors commented on the manuscript.
Author information
Reprints and permissions information is available at www.nature.com/reprints.
The authors declare no competing financial interests.
References
- 1.Geldner N. The Endodermis. Annu Rev Plant Biol. 2013;64:531–558. doi: 10.1146/annurev-arplant-050312-120050. [DOI] [PubMed] [Google Scholar]
- 2.Barberon M, et al. Adaptation of Root Function by Nutrient-Induced Plasticity of Endodermal Differentiation. Cell. 2016;164:447–459. doi: 10.1016/j.cell.2015.12.021. [DOI] [PubMed] [Google Scholar]
- 3.Peterson CA, Enstone DE. Functions of passage cells in the endodermis and exodermis of roots. Physiol Plant. 1996;97:592–598. [Google Scholar]
- 4.Kroemer H. Hypodermis und Endodermis der Angiospermenwurzel. 1903 Available at: https://www.schweizerbart.de/publications/detail/artno/144005900/Bibliotheca_Botanica_Heft_59.
- 5.Wu H, Jaeger M, Wang M, Li B, Zhang BG. Three-dimensional distribution of vessels, passage cells and lateral roots along the root axis of winter wheat (Triticum aestivum) Ann Bot. 2011;107:843–853. doi: 10.1093/aob/mcr005. [DOI] [PMC free article] [PubMed] [Google Scholar]
- 6.Mähönen AP, et al. Cytokinin Signaling and Its Inhibitor AHP6 Regulate Cell Fate During Vascular Development. Science. 2006;311:94–98. doi: 10.1126/science.1118875. [DOI] [PubMed] [Google Scholar]
- 7.Kurakawa T, et al. Direct control of shoot meristem activity by a cytokinin-activating enzyme. Nature. 2007;445:652–655. doi: 10.1038/nature05504. [DOI] [PubMed] [Google Scholar]
- 8.De Rybel B, et al. Integration of growth and patterning during vascular tissue formation in Arabidopsis. Science. 2014;345 doi: 10.1126/science.1255215. [DOI] [PubMed] [Google Scholar]
- 9.De Rybel B, Mähönen AP, Helariutta Y, Weijers D. Plant vascular development: from early specification to differentiation. Nat Rev Mol Cell Biol. 2016;17:30–40. doi: 10.1038/nrm.2015.6. [DOI] [PubMed] [Google Scholar]
- 10.Bishopp A, et al. A Mutually Inhibitory Interaction between Auxin and Cytokinin Specifies Vascular Pattern in Roots. Curr Biol. 2011;21:917–926. doi: 10.1016/j.cub.2011.04.017. [DOI] [PubMed] [Google Scholar]
- 11.Zürcher E, et al. A Robust and Sensitive Synthetic Sensor to Monitor the Transcriptional Output of the Cytokinin Signaling Network in Planta. Plant Physiol. 2013;161:1066–1075. doi: 10.1104/pp.112.211763. [DOI] [PMC free article] [PubMed] [Google Scholar]
- 12.Hwang I, Sheen J. Two-component circuitry in Arabidopsis cytokinin signal transduction. Nature. 2001;413:383–389. doi: 10.1038/35096500. [DOI] [PubMed] [Google Scholar]
- 13.Sakai H, et al. ARR1, a Transcription Factor for Genes Immediately Responsive to Cytokinins. Science. 2001;294:1519–1521. doi: 10.1126/science.1065201. [DOI] [PubMed] [Google Scholar]
- 14.Mason MG, et al. Multiple Type-B Response Regulators Mediate Cytokinin Signal Transduction in Arabidopsis. Plant Cell. 2005;17:3007–3018. doi: 10.1105/tpc.105.035451. [DOI] [PMC free article] [PubMed] [Google Scholar]
- 15.Liao C-Y, et al. Reporters for sensitive and quantitative measurement of auxin response. Nat Methods. 2015;12:207–210. doi: 10.1038/nmeth.3279. [DOI] [PMC free article] [PubMed] [Google Scholar]
- 16.Lavrekha . The Plant Journal. Wiley Online Library; 2017. [Accessed: 16th November 2017]. 3D analysis of mitosis distribution highlights the longitudinal zonation and diarch symmetry in proliferation activity of the Arabidopsis thaliana root meristem. [DOI] [PubMed] [Google Scholar]
- 17.Ioio RD, et al. A Genetic Framework for the Control of Cell Division and Differentiation in the Root Meristem. Science. 2008;322:1380. doi: 10.1126/science.1164147. [DOI] [PubMed] [Google Scholar]
- 18.Siligato R, et al. MultiSite Gateway-Compatible Cell Type-Specific Gene-Inducible System for Plants. Plant Physiol. 2016;170:627–641. doi: 10.1104/pp.15.01246. [DOI] [PMC free article] [PubMed] [Google Scholar]
- 19.Besnard F, et al. Cytokinin signalling inhibitory fields provide robustness to phyllotaxis. Nature. 2014;505:417–421. doi: 10.1038/nature12791. [DOI] [PubMed] [Google Scholar]
- 20.Harrison-Murray RS, Clarkson DT. Relationships between structural development and the absorption of ions by the root system of Cucurbita pepo. Planta. 1973;114:1–16. doi: 10.1007/BF00390280. [DOI] [PubMed] [Google Scholar]
- 21.Clarkson DT, Sanderson J, Russell RS. Ion Uptake and Root Age. Nature. 1968;220:805–806. [Google Scholar]
- 22.Hamburger D, Rezzonico E, MacDonald-Comber Petétot J, Somerville C, Poirier Y. Identification and Characterization of the Arabidopsis PHO1 Gene Involved in Phosphate Loading to the Xylem. Plant Cell. 2002;14:889–902. doi: 10.1105/tpc.000745. [DOI] [PMC free article] [PubMed] [Google Scholar]
- 23.Sasse J, et al. Asymmetric localizations of the ABC transporter PaPDR1 trace paths of directional strigolactone transport. Curr Biol CB. 2015;25:647–655. doi: 10.1016/j.cub.2015.01.015. [DOI] [PubMed] [Google Scholar]
- 24.Khan GA, et al. Coordination between zinc and phosphate homeostasis involves the transcription factor PHR1, the phosphate exporter PHO1, and its homologue PHO1;H3 in Arabidopsis. J Exp Bot. 2014;65:871–884. doi: 10.1093/jxb/ert444. [DOI] [PMC free article] [PubMed] [Google Scholar]
- 25.Naseer S, et al. Casparian strip diffusion barrier in Arabidopsis is made of a lignin polymer without suberin. Proc Natl Acad Sci U S A. 2012;109:10101–10106. doi: 10.1073/pnas.1205726109. [DOI] [PMC free article] [PubMed] [Google Scholar]
- 26.Müller B, Sheen J. Cytokinin and auxin interplay in root stem-cell specification during early embryogenesis. Nature. 2008;453:1094–1097. doi: 10.1038/nature06943. [DOI] [PMC free article] [PubMed] [Google Scholar]
- 27.Wendrich JR, Liao C-Y, van den Berg WAM, De Rybel B, Weijers D. Ligation-independent cloning for plant research. Methods Mol Biol Clifton NJ. 2015;1284:421–431. doi: 10.1007/978-1-4939-2444-8_21. [DOI] [PubMed] [Google Scholar]
- 28.Karimi M, Bleys A, Vanderhaeghen R, Hilson P. Building Blocks for Plant Gene Assembly. Plant Physiol. 2007;145:1183–1191. doi: 10.1104/pp.107.110411. [DOI] [PMC free article] [PubMed] [Google Scholar]
- 29.Siligato R, et al. MultiSite Gateway-Compatible Cell Type-Specific Gene-Inducible System for Plants. Plant Physiol. 2016;170:627–641. doi: 10.1104/pp.15.01246. [DOI] [PMC free article] [PubMed] [Google Scholar]
- 30.Kurihara D, Mizuta Y, Sato Y, Higashiyama T. ClearSee: a rapid optical clearing reagent for whole-plant fluorescence imaging. Development. 2015 doi: 10.1242/dev.127613. dev.127613. [DOI] [PMC free article] [PubMed] [Google Scholar]
- 31.Pfister A, et al. A receptor-like kinase mutant with absent endodermal diffusion barrier displays selective nutrient homeostasis defects. eLife. 2014;3:e03115. doi: 10.7554/eLife.03115. [DOI] [PMC free article] [PubMed] [Google Scholar]
- 32.Roppolo D, et al. A novel protein family mediates Casparian strip formation in the endodermis. Nature. 2011;473:380–383. doi: 10.1038/nature10070. [DOI] [PubMed] [Google Scholar]
- 33.Ursache R, Andersen TG, Marhavy P, Geldner N. A protocol for combining fluorescent proteins with histological stains for diverse cell wall components. Plant J. 2017 doi: 10.1111/tpj.13784. [DOI] [PubMed] [Google Scholar]
- 34.R Core Team. R. A Language and Environment for Statistical Computing. R Found Stat Comput. 2015 [Google Scholar]
Associated Data
This section collects any data citations, data availability statements, or supplementary materials included in this article.


