Figure 1.
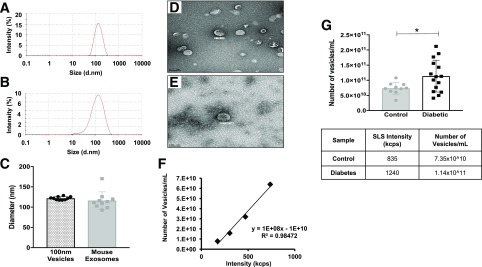
Comparison of plasma exosomes, isolated with ExoQuick, and 100-nm extruded microvesicles. A and B: DLS measurements of 100-nm extruded microvesicles (A) and plasma exosomes (B). d.nm, diameter, in nanometers. C: DLS measurements showed no difference in diameter between 100-nm extruded microvesicles (n = 9; dotted bar, black circles) and control mouse exosomes (n = 10; gray bar, gray squares). D and E: Electron microscopy images of 100-nm extruded vesicles (D) and plasma exosomes (E). Scale bars = 200 nm. F: Vesicle concentration (particles per milliliter) plotted against SLS measurement (kilocounts per second [kcps]). G: The number of plasma exosomes was increased significantly in diabetic mouse plasma. The number of exosomes isolated from plasma of control mice (n = 9; gray bar, gray circles) and STZ-induced diabetic (3 months) mice (n = 15; white bar, black squares) was measured through the use of SLS (kilocounts per second) (bottom). All data points are shown as univariate scatter plots with mean and SD. *P < 0.05.

