

Summary
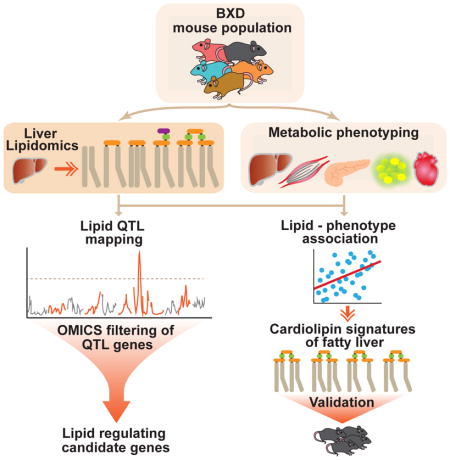
The genetics of individual lipid species and their relevance in disease is largely unresolved. We profiled a subset of storage, signaling, membrane and mitochondrial liver lipids across 385 mice from 47 strains of the BXD mouse population fed chow or high fat diet and integrated these data with complementary multi-omics datasets. We identified several lipid species and lipid clusters with specific phenotypic and molecular signatures and, in particular, cardiolipin species with signatures of healthy and fatty liver. Genetic analyses revealed quantitative trait loci for 68% of the lipids (lQTL). By multi-layered omics analyses, we show the reliability of lQTLs to uncover candidate genes that can regulate the levels of lipid species. Additionally, we identified lQTLs that mapped to genes associated with abnormal lipid metabolism in human GWAS. This work provides a foundation and resource for understanding the genetic regulation and physiological significance of lipid species.
eTOC Blurb
Jha et al. demonstrate the potential of liver lipid species to reflect liver associated phenotypic metabolic traits in the BXD mouse genetic population. They identify a subset of cardiolipin species—the essential inner mitochondrial membrane phospholipids—that are signatures of healthy or fatty liver. Furthermore, multi-layered omics data (genetic, transcriptomic, proteomic) was employed to filter genes from lipid-regulating loci and provide a resource of candidate genes that may regulate lipid species in mouse and human.
Introduction
An enormous number of chemically distinct molecular lipid species arise from the various combinations of fatty acids with backbone structures, such as glycerol. However, it is not intuitively clear why nature has created so many different forms of lipids (Wenk, 2005). Advancements of lipidomics technologies have provided the first step towards generating a repertoire of all lipid species on a systems scale. The next major challenge is to elucidate their regulation, function and physiological impact and to discover how these lipids interact to influence specific biological processes.
Combining systems genetics with multi-omics strategies is helpful to understand the association of lipid species with genes, proteins or physiological traits (Civelek and Lusis, 2014; Hyotylainen and Oresic, 2014). Similar to the novel insights gained from quantitative trait loci (QTL) analysis of transcripts, proteins or phenotypes (Andreux et al., 2012; Williams et al., 2016; Wu et al., 2014), the QTLs of lipid species in liver can provide insights into their genetic regulation. Transcriptomic, proteomic and phenotypic data can additionally be used to generate lipid–transcript, –protein or –phenotype correlations, providing a more comprehensive view of how lipids fit in the network of cellular processes. Likewise, reducing large lipidomic data to clusters of co-regulated lipids enables the identification of functionally related lipid species and helps to clarify the relationship of the lipid clusters with phenotypic traits.
It has long been possible to quantify entire classes of lipids en masse. Recently however, it has been shown that by dissecting broad lipid classes into specific lipid species, one can develop a more granular understanding of lipid-related disease etiology, thereby improving the capacity to find and validate drug targets. For instance, neutrophils from patients with periodontal tissue disease accumulate specific diacylglycerol (DAG) species, in particular 1,2-dipalmitoyl DAG (Gronert et al., 2004). Similarly, only some molecular species of ceramides were shown to be associated with certain types of cancers or with pathways that lead to ceramide-induced apoptosis (Koybasi et al., 2004; Kroesen et al., 2001). Given the challenges in identifying gene-environment interactions (GxE) influencing the levels of lipid species in humans (Franks and McCarthy, 2016), we exploited the BXD mouse genetic reference population (GRP), descending from crosses between C57BL/6J mothers and DBA/2J fathers (Peirce et al., 2004). In this genetically diverse population, we can tightly control the dietary state of the individual mice over months to analyze how genes (genotype), environment (diet) and their interactions influence hepatic lipid species. We used systems genetics strategies (Civelek and Lusis, 2014) including QTL mapping, network construction, and module-trait correlation integrated with multi-omics datasets (genomics, transcriptomics, proteomics, and phenomics) to understand the relationship between levels of lipid species and molecular and clinical traits. These approaches helped us to identify specific cardiolipin species with signatures of healthy or fatty liver and candidate genes that regulate the levels of specific lipid species.
Results
Liver lipid profiles and their relationship with clinical and molecular traits
We used targeted lipidomics to measure 96 hepatic lipid species in 385 mice belonging to 84 cohorts of the BXD GRP—43 fed CD and 41 fed HFD from 47 BXD strains. Over 29 weeks, mice underwent extensive metabolic phenotyping (Williams et al., 2016). After an overnight fast, mice were sacrificed and liver samples were collected for lipidomics analyses. To test the quality of mass spectrometry (MS) measurements, we performed pairwise-correlation of technical and extraction replicates, which showed consistently robust correlations (Figures S1A and S1B). Furthermore, we performed all possible pairwise correlations between the measured lipid species from different groups to assess the sensitivity of our measurements in detecting diet- and strain-driven differences (Figure S1C). The correlation of biological replicates within each strain in either diet was higher than within strain-across diet (CD vs. HFD) correlation, and, as expected, the correlation across strains on a given diet (either CD or HFD) was higher than across strain-across diet correlation (Figure S1C). The lipids measured include free fatty acids (FFA, 8 species), glycerolipids [triacylglycerol (TAG, 38 species) and diacylglycerol (DAG, 6 species)], glycerophospholipids [phospholipids (PL, 20 species) cardiolipins (CL, 23 species)] and coenzyme Q9 (Table. S1). Hierarchical cluster analysis demonstrated that BXD cohorts did not completely segregate based on their diet, indicating that the GxE interaction can overpower the strong dietary impact on lipid profiles (Figure 1A). To obtain an overview of the interaction between lipid species, we performed an unweighted correlation network analysis, which showed most lipids to be highly correlated and the correlations within class to be generally stronger (Figure 1B (p<1e-04) and S1D (p<1e-03)). Some dietary effects were evident in the correlation networks, such as TAG species, which formed a tight-knit cluster in CD but were more interspersed in HFD, revealing the change in neutral lipid homeostasis on HFD (green nodes; Figures 1B, and S1D). While the CLs, found primarily in the mitochondrial inner membrane, formed a tight cluster in both diets, the PLs, that are the general cellular membrane lipids, were highly interspersed between different lipid classes in both diets (red and yellow nodes, respectively; Figures 1B and S1D). This scattered PL profile is in line with the fact that PLs are the main substrates and intermediates in the biosynthesis of various lipid classes (Han, 2016).
Figure 1. Liver lipid species profile and their association with physiological and molecular traits.

(A) Heatmap analysis with unsupervised hierarchical clustering of 96 lipid species for each BXD cohort shows mixed dietary and genetic impact. (B) Spearman correlation network (p<1e-04) of all lipid species measured in CD and HFD. Lipid species are color coded as 7 major lipid classes. The side chain FA composition of lipids has been abbreviated (O, oleic; P, palmitic; Po, palmitoleic; S, stearic; L, linoleic and Dha, docosahexaenoic acid. Refer to table S1 for abbreviation and composition). (C) Legend of the module composition, indicating the range of total number of carbons and degree of unsaturation. (D) Lipid module-clinical trait correlation. Each cell is color-coded by the Pearson’s correlation coefficient according to the legend color on the right. The stars in the cells represent the p-value of the correlation (p < 0.05 *, p < 0.01 **, p < 0.001 ***). (E) Module and its corresponding KEGG enriched pathway correlation. Red and blue cells represent the enriched pathways with the positively (scale bar: log10 p-value) and negatively (scale bar: -log10 p-value) correlated proteins respectively. Lipid classes hereafter are abbreviated as follows: triacylglycerol, TAG/TG; diacylglycerol, DAG; free-fatty acid, FFA; phospholipid, PL (phosphatidic acid, PA; phosphatidylcholine, PC; phosphatidylethanolamine, PE; phosphatidylglycerol, PG; phosphatidylinositol, PI; phosphatidylserine, PS); cardiolipin, CL; monolysocardiolipin; MLCL. See also Figures S1, S2 and Tables S1 and S2.
To identify lipids with similar physiological and molecular characteristics, we performed weighted correlation network analysis (WGCNA), which clusters correlated groups of lipids into modules (Langfelder and Horvath, 2008). More than half of the lipids were clustered in 8 modules in both diets (66% in CD and 58% in HFD) (Figures 1C, S2A, and Table S2) and most module composition was conserved in both diets (Figures S2B and S2C). We then performed correlation analysis between the eigenlipid (first principal component) of each module and clinical traits related to liver function (Figure 1D). In CD, the DAG (black), TAG (brown) and CL (yellow) modules positively correlated with obesity and other traits associated with liver dysfunction, while the CD-specific TAG-PL purple module—containing species with a higher degree of unsaturation (Figure 1C)—negatively correlated with these traits (Figure 1D). In HFD, several modules showed positive correlation with obesity-associated traits, particularly DAG (black), TAG (brown and magenta) and CL (blue and yellow) modules (Figure 1D). Interestingly, none of the TAG modules correlated with the total TAG concentration in liver or plasma despite the significant correlation with liver weight (Figure 1D). This disparity can be explained by the fact that we measured only 38 TAG species and 6 DAG species which constitutes only a fraction (~15%) of all the TAGs and DAGs that exist in mouse liver. Therefore, this subset may not necessarily reflect the total TAG concentration measured by the enzymatic assay.
To identify molecular mechanisms underlying the lipid clustering, we correlated the module eigenlipids with liver proteome (2,622 proteins) from the same mouse cohort (Williams et al., 2016). We selected all proteins that significantly correlated with each module eigenlipid and performed KEGG enrichment analysis for all positively and negatively correlated proteins, separately. Interestingly, modules that earlier correlated with obesity and liver dysfunction in both diets, including DAG (black), TAG (brown and turquoise) and CL (blue and yellow) modules (Figure 1D), positively correlated with pathways associated with fatty acid and glycolytic metabolism, peroxisome and PPAR signaling (Figure 1E). Further, these modules correlated negatively with oxidative and proliferative pathways like oxidative phosphorylation, lysosome and ribosome pathways (Figure 1E). In line, the TAG & PL purple module showed the opposite trend, negatively correlating with fatty acid metabolic pathways and positively with oxidative pathways, following the same trend as in the module-trait correlations (Figure 1D and 1E). Collectively, these findings reveal that all lipid species of a lipid class do not necessarily have the same molecular regulation and phenotypic impact.
Identification of cardiolipin species as signatures of healthy and fatty liver
From all lipids measured, we identified two clusters of lipid species with strong diet-independent association with liver mass (Figure 2A). A cluster of 13 species composed of TAGs and DAGs with a low degree of unsaturation (1–3 double bonds; dominated by lipids from the black and brown modules) correlated positively with liver mass (Figure 2A; green font); whereas, another cluster of 6 lipids comprising highly unsaturated TAGs (6–7 double bonds; dominated by lipids from the purple module) along with two phosphatidylserine species, correlated negatively with liver mass (Figure 2A; orange font). Since the diet changed the landscape of most liver lipids, we next analyzed lipids that strongly associated with liver mass in each individual diet (Figure 2B). 27 lipids in CD and 40 in HFD (including all the 19 lipids from Figure 2A) strongly correlated with liver mass. Of note, liver mass was centrally positioned in the resulting HFD network showing dense correlations with the 40 lipid species compared to the CD network where liver mass was at the periphery of the network with 27 lipids (Figure 2B). Interestingly, a subset of nine CL and monolysocardiolipin (MLCL) species showed a predominant association with liver mass in HFD, but not in CD (Figure 2B; red nodes). This finding is noteworthy because CL—the signature phospholipid of the mitochondrial inner membrane—is indispensable for a range of mitochondrial activities (Claypool and Koehler, 2012). Alterations in the content and/or structure of CL have been reported in several tissues in a variety of pathological settings. However, a major unresolved question is whether CL molecules with different acyl chain compositions differ functionally (Claypool and Koehler, 2012). Of these nine CL species, only tetralinoleoyl-CL (CL(LLLL)) and its precursor/remodeling intermediate, trilinoleoyl-MLCL ((MLCL(LLL)) (neither belonging to any module) showed negative correlation with liver mass; whereas the other seven CLs enriched in monounsaturated FAs (MUFA), oleic (O) and palmitoleic (Po) acid (all from the yellow module), positively correlated with liver mass (Figure 2C). This demonstrates a change in CL remodeling under HFD that depletes the CL species predominant in healthy tissue—CL(LLLL) (Chicco and Sparagna, 2007), and its precursor, MLCL(LLL)—suggesting that these CL species may be signatures of healthy/normal liver. Conversely, the other seven MUFA enriched CLs that correlated positively with liver mass in HFD may be considered signatures of unhealthy/fatty liver.
Figure 2. Identification of cardiolipin signatures of healthy and fatty liver.

(A) Correlation diagram (corrgram) showing diet-independent association of lipid species with liver mass. Lipid species with Spearman’s correlation p-value <0.05 with liver mass (both normalized to body weight (%) and unnormalized (weight in g) in both CD and HFD were selected. (B) Spearman correlation network of diet specific significant correlation of lipid species with liver mass in CD (left) and HFD (right). (C) Corrgram of CLs that significantly correlate with liver mass in HFD. (D–F) C57BL6/J mice were fed with CD or high-fat high-sucrose (HFHS) diet for 18 weeks or nicotinamide riboside (NR) supplemented HFHS diet, 9 weeks after the start of the HFHS diet (HFHS+NR). Levels of healthy (D) and unhealthy (E) CL species in livers of the three cohorts. Note that the CLs—CL(LOOPo), CL(LLPoP) and CL(OOOP)—are shown in the figure with an additional CL species because the two are isobaric and were inseparable chromatographically. (F) Corrgram showing negative correlation of obesity and NAFLD traits with healthy CL species and positive correlation with unhealthy CL species.
We next tested whether this change in the profile of nine CL species is a general phenomenon in other dietary-induced models of hepatic steatosis and mitochondrial dysfunction and if the profile can be reverted by ameliorating hepato-steatosis via enhancing mitochondrial function. We have previously shown that nicotinamide riboside (NR) treatment ameliorates high-fat high-sucrose (HFHS) diet induced fatty liver disease by boosting nicotinamide adenine dinucleotide (NAD+) levels and thereby enhancing mitochondrial function (Gariani et al., 2016). Therefore, we performed lipidomic profiling from the livers of C57BL/6J mice—the most commonly used laboratory mouse strain—fed on (i) CD or (ii) HFHS diet for 18 weeks or (iii) HFHS + nicotinamide riboside (NR), added 9 weeks after the start of the HFHS diet (therapeutic approach) (Gariani et al., 2016). In line with our findings from the HFD-fed BXD study, HFHS diet decreased the CL signatures of healthy/normal liver—CL(LLLL) and MLCL(LLL)—whereas it increased the six CL signatures of unhealthy/fatty liver—MLCL(LOO), MLCL(LLO), CL(LOOPo), CL(LLPoP), CL(LOOO), CL(OOOP)—enriched in MUFAs (Figure 2D and 2E). [The CL, CL(OOOO), detected in the BXD study (Figure 2B/2C), was too low to be detected in all samples from the NR study]. Interestingly, NR treatment increased the levels of the healthy CLs, whereas it decreased the levels of the unhealthy CLs (Figure 2D and 2E). Importantly, the two healthy CLs correlated negatively with obesity and NAFLD traits while the unhealthy CLs showed positive correlation (Figure 2F). These data show that all lipid species within a class do not behave similarly, as demonstrated here with specific CL species that have signatures of healthy or fatty liver.
Liver lipids are influenced by multiple genomic loci
We next analyzed globally how genotype and diet influence lipid species (Figure 3A). 63% of the measured lipids were significantly impacted by diet: 28 upregulated in CD (green font) and 33 upregulated in HFD (blue font) (Figure 3A, Table S3). Approximately half of the lipids correlated positively between the diets, 24 of them being significant (orange bars, Figure 3A, Table S3). Next, we assessed the heritability (h2; percentage of trait variation attributed to additive genetic factors) for all lipid species within dietary groups (CD-light red and HFD-dark red, Figure 3A) and across both diets combined (CD+HFD/Mixed)(Belknap, 1998) (Table S4). Within a dietary cohort, 30% to 60% of the observed variance in lipid levels could be explained by genetic differences across strains (i.e. h2 ≥ 30%) for the strong majority of lipid species (66% in CD and 76% in HFD). Conversely, when dietary cohorts were combined, only 13% of lipids had h2 above 30% (Table S4).
Figure 3. Genetics of lipid species.

(A) Circos plot of all lipids measured. Blue bars in the outermost ring represent the log2 fold change (HFD vs. CD) of the lipids. Lipids increased in CD or HFD are shown in green and blue font respectively. Orange bars represent the correlation of lipids between CD and HFD. Significant correlations (adj. p-value<0.05) are represented by “*”. Red bars represent lipid h2 in CD (light red) and HFD (dark red). The inner ring of yellow bars represents the strength of lQTLs in CD (light yellow) and HFD (dark yellow). Number of bars per lipid is equivalent to the number of lQTLs. The lines between the two innermost rings stem from the peak lQTL bar (with LOD > 3) and terminates on their approximate chromosomal position of the innermost ring. Lipid pairs marked with “_1” and “_2” (TAGs 54:5, 54:6, 56:7; PI(Dha_S) and CL(LLOPo)) indicate two isobaric peaks. (B) Schematic representation of the lQTLs. 136 lQTLs (55 CD and 81 HFD) were mapped from 37/46 lipids in CD/HFD. The number of QTLs (red font) per lipid species (blue font) is indicated. See also Figure S3 and Tables S3–S5.
Next, we mapped QTLs for all lipid species (lQTL) and lipid modules (modQTL) (Table S5). Most chromosomes contained at least one lQTL and some hotspot regions on chromosomes 2, 4, 6, 9, 15 and X were quite distinct (Figure 3A). We detected 136 lQTLs: 55 in CD and 81 in HFD from 37 and 46 lipid species, respectively (Figure 3B). While over half of these lipids had only one QTL (26 CD and 21 HFD), the remaining lipids had more than one lQTL (11 in CD and 25 in HFD), indicating a polygenic regulation of these lipid species (Figure 3B). lQTLs were typically unique to either CD or HFD, with only one lipid species—TAG(58:8)—mapping to the same locus on chromosome 11 (118.9-118.5 Mb) in both diets (Figure S3A). Interestingly, this locus harbors genes involved in lipid (Acox1, Fasn, P4hb, St6galnac1) and carbohydrate metabolic processes (Afmid, Gaa, Galk1). Importantly, these genes (among others in this region) also have cis-e/pQTLs in liver and coding sequence variants in the BXDs (Figure S3A). Furthermore, TAG(58:8) levels were not significantly different across diets and were among those having high h2 in both dietary cohorts (h2>40%) and also when dietary cohorts were combined (33.5%) (Figure S3B). This indicates that TAG(58:8) is predominantly under the same genetic control in both diets. The lack of cross-diet overlap in rest of the lQTLs suggests that GxE factors regulate nearly all lipid species.
Genetic assessment of the lQTLs
To assess the efficacy of lQTLs and find candidate genes that regulate lipid levels, we performed an in-depth analysis of all significant and suggestive lQTLs (Figure 4A, lQTLs above the blue dotted line; 55 in CD and 81 in HFD). All genes under these lQTLs were filtered along four parallel pipelines (Figure 4B): genes under lQTLs (i) with non-synonymous SNPs in BXDs, (ii) with self-regulating QTLs (cis e- and/or p-QTL), (iii) with significant correlation (p<0.05) with the lipid itself, and (iv) with variable transcript expression (standard deviation >0.25). While the integration of proteomics data was advantageous, transcriptomics data was substantially more consequential to candidate selection as more genes were assayed (~20,000 with transcriptomic vs ~2600 with proteomic data) and this also avoids post-translational and protein regulation variations. Genes passing 2 of the 4 filters in either diet (299 of 2845 genes in CD and 327 of 3818 in HFD) were analyzed for gene ontology (GO) pathway enrichment (Figure 4B). Remarkably, the filtered lQTL candidate genes were enriched in lipid metabolic pathways (Figure 4C). We next applied the same filtering criteria for the top 14 lQTLs (Figure 4A, lQTLs above the black dotted line) comprising of 4 CL, 6 TAG, 2 PL, and the FFA 16:0 and 16:1n7 lQTLs (Figure 4D). These lQTLs had many genes fulfilling 3–4 of our filtering criteria (Figure 4D, genes indicated in orange and red font) and several with known association with metabolic and liver-associated phenotypes (Figure 4D, genes indicated with “*”). In total, 104 candidate genes that fulfilled 2 or more of the filtering criteria from these 14 lQTLs were subsequently analyzed for enrichment of KEGG pathways. In line with the above findings, these genes were enriched in FA metabolic processes in addition to inflammatory response (Figure 4E). We have provided an exhaustive list of candidate genes (based on the filtering pipeline of Figure 4B) for each lQTL (Table S6; CD and HFD lQTLs provided in separate excel sheets). Additionally, genes under the lQTLs that pass at least two filters are tabulated in Table S5. Taken together, these data show that lipid species of the same class can be regulated by several loci throughout the genome and demonstrate the utility of integrating multi-omics datasets with lQTLs in the identification of putative genetic regulators of lipid species.
Figure 4. Genetic assessment of lQTLs.

(A) Manhattan plot of lipid species in CD and HFD. Names of the lipid species with genome-wide p-value < 0.05 are indicated. (B) All genes under the lQTLs (±5 Mb from the peak) were filtered through four independent pipelines as indicated. Genes fulfilling 2 or more of the filtering criteria were analyzed for enrichment of GO biological process (BP). (C) Enriched GO BP from 566 filtered lQTL genes. (D) lQTL position of the top 14 QTLs (p-value < 0.05). The candidate genes fulfilling 4 (red font), 3 (orange font) and 2 (grey font) of the 4 filtering criteria are indicated below each lQTL peak. Genes indicated with “*” are associated with metabolic phenotypes. (E) KEGG enrichment analysis of genes under the top 14 lQTLs passing 2 or more of the filtering criteria. For A and D, blue and black dotted lines represent suggestive and significant QTL threshold respectively. See also Table S5 and S6
The FFA module maps to a genetic hotspot associated with FA metabolism and signaling
Next, we analyzed one of the diet-specific hotspot lQTL regions to demonstrate the validity of our lQTLs at the genetic and physiological level. Module-level QTL scans showed a QTL for the Red module (comprising six of the eight FFAs measured) only in HFD and not CD on chromosome 4 (Figure 5A). The QTL for the Red module overlapped with that of its constituent FFAs and contained several genes passing one or more of our filtering criteria (from Figure 4B), including 12 genes involved in fatty acid metabolism, insulin, interferon and toll-like receptor signaling, suggesting a robust hotspot region of these metabolic processes associated with FFAs (Figure 5B) (Jump, 2011; Malhi and Gores, 2008). Among these 12 genes, it is important to highlight methylthioadenosine phosphorylase (MTAP), which passes all 4 filtering criteria. MTAP deficiency has recently been shown to increase the risk for progression of chronic liver disease due to compromised liver proteome methylation (Bigaud and Corrales, 2016).
Figure 5. FFA module identifies a genetic hotspot locus associated with FA metabolism and signaling.

(A) Red module QTL showing significant peak on chromosome 4 (left) in HFD and the weighted correlation network of the FFAs (right) in the red module. (B) Hotspot region on chromosome 4 showing the overlapping QTL of the red module and the individual FFAs of the module. modQTL genes involved in FA metabolic processes and signaling are indicated along with their biological function. For A and B, blue and black dotted lines represent suggestive and significant QTL threshold respectively. (C) Schematic representation of monounsaturated FA (MUFA) synthesis. (D) Stearoyl-CoA Desaturase (SCD) activity index represented as ratios of MUFA to saturated FA (SFA). (E) Spearman correlation between hepatic expression of SCD transcript and protein (SWATH) with SCD activity index. (F) Pearson’s correlation between the basal RER and the red module.
Having identified the potential genetic regulatory region of these FFAs under HFD, we next tested if oleic and palmitoleic acids of the module—showing the strongest strength of association (Fig 5A (right), thickness of edges)—show the typical biological profile of Stearoyl-CoA Desaturase (SCD)-mediated MUFA synthesis under HFD (Figure 5C, adapted from (Jump, 2011)). Indeed, SCD activity index, as assessed by the ratios of MUFA to saturated FA (SFA)—16:1n7/16:0 and 18:1n9/18:0—was significantly increased in HFD cohorts (Figure 5D). Additionally, the lipid ratios as readouts of the SCD activity index showed positive correlation with both mRNA and protein levels of SCD in HFD, but not in CD (Figure 5E).
Since fat is the predominant energy source in HFD (60.3% kcal from fat; 27.3% kcal from carbohydrate) as opposed to carbohydrate in CD (6.2% kcal from fat; 44.2% kcal from carbohydrate), we tested whether the FFAs in this module reflect this at the physiological level. To do so, we tested if the Red module eigenlipid correlated negatively with respiratory exchange ratio (RER). RER is a measurement of the primary energy substrate used by an organism: lower RER values indicate fat is the predominant energy source, while higher values indicate higher contribution from carbohydrates. In line, the Red module correlated negatively with RER in HFD cohorts, which have lower basal RER (Figure 5F; black dots confined towards left of the x-axis), whereas no significant correlation was observed in CD cohorts (Figure 5F; green dots spread towards right of the x-axis). These findings demonstrate the validity of our QTL mapping and highlight the potential utility of WGCNA clustering of lipids in modules for lipidomics analysis and the identification of biologically relevant modQTLs.
Identification of lQTL genes associated with abnormal lipid metabolism in human GWAS and mapping of lQTLs in TAG biosynthetic pathway
Human GWAS have identified many genetic variants associated with plasma lipids and abnormal lipid metabolism (http://jjwanglab.org/gwasdb, https://www.ebi.ac.uk/gwas/). Taking advantage of these genes identified in GWAS studies (Table S7), we screened the lQTLs for the presence of any human GWAS genes associated with abnormal lipid metabolism (Figure 6A). We screened only those genes under the lQTLs which fulfilled at least two of the four filtering criteria, shown in Figure 4B. 27 lQTLs (7 CD and 20 HFD) harbored 20 out of 494 genes preselected from human GWAS for abnormal lipid metabolism (Figure 6A, and Table S7). [see table S7 for extended information on the identified hits]. To test the probability of this overlap by chance, we performed 10,000 permutations, each of which involved comparing the number of genes that overlap between a random set of 494 human genes and the 566 BXD lQTL genes (from table S5). The distribution of the overlap across all permutations formed the null distribution. Only 1.49% of random trials had an overlap greater than or equal to the true overlap of 20 genes (Figure S3C) corresponding to a p-value of 0.0149. This indicates that the probability that 20 or more GWAS genes found to overlap by chance under the calculated null distribution is only 1.49%.
Figure 6. lQTL genes associated with abnormal lipid metabolism in human GWAS and with TAG biosynthetic pathway.

(A) lQTL genes fulfilling 2 or more filtering criteria as shown in Figure 4B were screened for any known association with abnormal lipid metabolism in human GWAS. The screening identified 20 GWAS genes from 27 lQTLs (Top). Each box of the table represents the lQTL(s) for the indicated gene(s) and the GWAS phenotype associated with the genes. (B) QTL position of the three lipid species (TAG(54:6)_2, TAG(56:8) and PI(20:4_16:0)) which map to the indicated genes (in red) implicated in hepatic steatosis in human GWAS studies. The loci of Cilp2, Tm6sf2 and Ncan is syntenic in mice (left) as well as in humans (middle). The genomic location of the genes is shown in red in the positive strand for NCAN and CILP2 and in the negative strand for TM6SF2. Blue and black dotted lines represent suggestive and significant QTL threshold respectively (C) Schematic representation of TAG biosynthetic pathways showing only those candidate genes that are under the lQTLs and fulfill 1 or more of our filtering criteria. lQTLs are represented in grey. Genes under CD lQTLs are in blue, those under HFD lQTLs in red, and those under both CD and HFD lQTLs in purple. See also Figures S3C, S4 and Table S7.
Of note, the QTL position of three lipid species: TAG(54:6)_2, TAG(56:8) and PI(20:4_16:0) mapped to genes implicated in NAFLD in human GWAS, including TM6SF2, NCAN, CILP2, PPP1R3B and LYPLAL1(Anstee and Day, 2013; Kahali et al., 2015; Lusis et al., 2016) (Figure 6A and 6B). TAG(54:6)_2 mapped to Tm6sf2 (influences TG secretion and hepatic lipid droplet content), and Ncan (cell adhesion) on chromosome 8. Notably, these two genes along with Cilp2 (carbohydrate binding) have protein coding variants in the BXDs. Additionally, the region of Ncan, Tm6sf2 and Cilp2 is syntenic with the localization of these genes on human chromosome 19 (Figure 6B, middle) suggesting a conserved role/regulation of these genes in both mice and humans. TAG(56:8) mapped to Ppp1r3b (limits glycogen breakdown) on chromosome 8 and PI(20:4_16:0) mapped to Lyplal1 (having lysophospholipase activity) on chromosome 1 (Figure 6B), both of which have coding variants and cis-eQTLs in liver, heart, muscle and adipose tissue of BXDs. Taken together, these links from human GWAS to lQTLs provide a basis for understanding both the function of numerous understudied and/or uncharacterized GWAS genes and the role of the individual lipid species in health and disease.
Next, we tested whether the total TAG content mapped to any of the eight genes (PNPLA3, GCKR, TRIB1, LYPLAL1, PPP1R3B, TM6SF2, NCAN and CILP2) proven to cause or increase the susceptibility to hepatic steatosis/NAFLD in human GWAS (Anstee and Day, 2013; Kahali et al., 2015; Lusis et al., 2016). Hepatic TAG quantification (normalized to protein levels) in BXDs did not show any significant difference between the CD and HFD cohorts (Figure S4A). However, the TAG content in CD cohorts correlated with proteins and transcripts that were enriched in lipid metabolic processes (Figure S4B) and the TAG content in HFD cohorts correlated positively with body weight and fat mass and negatively with the lean mass (Figure S4C). This association of hepatic TAG content with its expected physiological and molecular function affirms the reliability of the TAG measurement despite no significant dietary difference. QTL mapping of the hepatic TAG content showed two suggestive QTLs at chromosomes 4 and 17 in HFD cohorts, whereas no QTL was observed in CD (Figure S4D). Notably, TAG content did not map to any of the eight human NAFLD GWAS genes stated above, nor to any of the individual TAG lQTLs. This indicates a diverse genetic regulation of individual TAG species, different from the regulation of total TAG content and highlights the importance of examining individual TAG species. Therefore, we examined whether genes known to be involved in the TAG biosynthesis pathway (Table S7) were found to fulfill any one of the four filtering criteria shown in Figure 4B in either diet for individual TAG, FFA, and PL lQTLs. 14 genes (4 CD, 7 HFD, and 3 CD+HFD) involved in TAG biosynthesis were found under 30 lQTLs (Figure 6C). Collectively, our data demonstrate the complexity of the genetic regulation of different lipid species and the importance of studying individual lipid species to find common targets between mice and humans.
DISCUSSION
Data on the genetic regulation and physiological significance of individual lipid species on a population scale is very limited for both mouse (Hui et al., 2015) and human populations (Gronert et al., 2004; Koybasi et al., 2004; Kroesen et al., 2001). Here, we profiled a subset of liver lipid species from different classes and integrated them with multi-omics datasets (genetics, transcriptomics, proteomics and phenomics) to understand their genetic, environmental and GxE regulations and physiological roles. We identified individual lipid species and lipid modules that impact different clinical traits, revealing a link between their levels and their physiological and molecular functions. In particular, specific CL species were identified that associate either positively or negatively with obesity and NAFLD signatures. Last, we demonstrate the reliability of lQTLs through several examples that were supported by multi-omics analysis and provide a resource of candidate genes that can regulate many of the lipid species we measured. Our findings illustrate the importance of studying individual lipid species and provide a platform for further mechanistic studies of lipid species.
Similar to the plasma lipids in our companion article [Jha et al., 2018], hepatic lipid species are also correlated across lipid class. By clustering lipids into modules, we established functional links between these modules and their molecular and physiological signatures. Two observations were particularly distinct between the plasma and liver lipids. First, in contrast to the plasma lipid profile, where unsupervised hierarchical clustering distinctly separated the CD and HFD groups [Jha et al., 2018], the liver lipid profile did not show a distinct dietary separation. Second, the h2 of the liver lipids was lower than that of plasma lipids. These differences can be attributed to the fact that (i) liver, being the hub of most metabolic processes, is more dynamic and influenced by a multitude of factors (diet, hormones, stress) vs. the plasma lipid profile, which represents an equilibrium state as a result of metabolic processes from all peripheral tissues; and (ii) additional steps such as tissue homogenization and normalization to protein levels are required for liver lipidomics, increasing the possibility of technical error.
A high fat dietary challenge had a striking impact on the cardiolipin profile, wherein the CL signatures of healthy liver (CL(LLLL) and MLCL(LLL)) were decreased and the signatures of fatty liver (MUFA-enriched CLs and MLCLs) were increased. Notably, CL(LLLL) comprises the majority of CLs in the inner mitochondrial membrane and a loss in CL(LLLL) content typically reflects the loss of mitochondrial mass (Koekemoer and Oelofsen, 2001). While a decrease in CL(LLLL) has been categorically associated with heart failure, senescence, and Barth syndrome (Chicco and Sparagna, 2007), its role in hepatic steatosis/NAFLD has not been clearly established (Cole et al., 2016). Therefore, we validated our findings from the HFD-BXD study in another model of HFHS-induced hepatic steatosis, which confirmed that indeed healthy CLs decrease in NAFLD and negatively correlate with obesity and NAFLD traits and conversely, unhealthy CLs increase in NAFLD and positively correlate with obesity and NAFLD traits. This suggests that this change in CL profile, in particular a decrease in CL(LLLL) content, could be one of the underlying causes of hepatic steatosis and/or may in itself serve as a disease biomarker. If this is the case, then interventions to ameliorate steatosis should be accompanied by increase in healthy CLs and a decrease in unhealthy CLs, as illustrated by treating mice having NAFLD with the NAD+ precursor, NR. This finding adds to the conceptual understanding of the pathways via which NR may act to boost mitochondrial function (Gariani et al., 2016), i.e. by increasing CL(LLLL) and MLCL(LLL) content in liver.
QTL analysis showed that about half of the lipids (having QTLs) mapped to multiple QTLs, suggesting a polygenic regulation of lipid species, which is in line with the diverse functional roles of lipids in signaling, protein-binding, membrane function, and as energy substrates (Han, 2016). These results furthermore show that lipid species are complex traits affected not only by the environment, but also by multiple genetic pathways—i.e. not regulated primarily by single rate-limiting enzymatic pathways. The complexity of lipidomics can be better appreciated when compared and contrasted with metabolomics/metabolites where often there is one key regulatory enzyme for a reaction or a pathway to which metabolite QTLs will frequently map to (Wu et al., 2014). In contrast, for most lipid species, it is uncommon that one enzyme regulates the level of a particular lipid species. The number of genes and proteins in a particular lipid biosynthetic pathway is a lot fewer than the species in each class of lipid, (Quehenberger and Dennis, 2011) indicating that (i) one gene regulates a number of lipid species and (ii) many genes can regulate one lipid species.
To prove the reliability of the lQTLs, we performed a multi-omics analysis of candidate genes under the lQTLs, which provided compelling candidate genes and enriched pathways associated with lipid metabolic processes. If the mouse is to serve as a model of metabolic and lipid traits in humans, it is important that the relevant pathways are conserved in the two species. One measure of such conservation is the degree of overlap between mouse QTLs and human GWAS data. Our data shows several lQTLs harboring human GWAS candidate genes for lipids and associated metabolic traits. Though with this overlap we cannot infer whether the lipid modulating allele associated with the gene is acting in the same direction in both mouse and human; for genes which have been mechanistically examined in the literature, this directionality can be checked. These findings build a strong foundation for future mechanistic studies to find common links between the genetic control of lipid metabolism between mouse and human, as has been successfully achieved by the hybrid mice diversity panel (HMDP) for other traits, such as osteoporosis, obesity, blood cell levels and heart failure (Lusis et al., 2016). Hence, we provide here candidate genes for all lQTLs, as a cornerstone for future research on the regulation of individual lipids across species, with human translational value.
Interestingly, total hepatic TAG content did not have any significant QTL overlap with individual TAG lQTLs. This highlights a key point: the regulation of individual lipid species is diverse and distinct from the total concentration of the class to which they belong. Therefore, it is necessary to have more focused studies on individual lipid species, which can uncover their functions as well. In agreement with this, we have illustrated in our companion article [Jha P et al., 2018] that specific TAG species can have positive or negative signatures of NAFLD. Future work on other important lipid classes including extensive coverage of ceramides, DAGs and eicosanoids will be helpful in dissecting other equally relevant NAFLD and metabolic syndrome signatures.
In summary, this liver-centric lipidomics study provides a framework to uncover the genetic regulation and physiological impact of individual lipid species, with an ultimate goal to improve our understanding of diseases linked to abnormal lipid metabolism. This insight may help to identify new drug targets involved in lipid disorders and to guide the development of clinically relevant disease signatures.
STAR METHODS
CONTACT FOR REAGENT AND RESOURCE SHARING
Further information and requests for resources and reagents should be directed to and will be fulfilled by the Lead Contact, Johan Auwerx (admin.auwerx@epfl.ch).
EXPERIMENTAL MODEL AND SUBJECT DETAILS
Mice
BXD strains were obtained from University of Tennessee Health Science Center (Memphis, TN, USA) and JAX (The Jackson Laboratory) and bred at the École Polytechnique Fédérale de Lausanne (EPFL) animal facility for more than two generations before incorporation into the study. Cohorts of 47 BXD strains with ~5 males each on CD and HFD were used in this study. Mice from 43 strains were fed a chow diet [CD; 2018 Teklad Global 18% Protein Rodent Diet (6.2% kcal from fat; 44.2% kcal from carbohydrate; 18.6% kcal from protein)] and from 41 strains a high fat diet [HFD; Harlan Teklad, TD.06414 (60.3% kcal from fat; 27.3% kcal from carbohydrate; 18.4% kcal from protein)] for 21 weeks, starting 8 weeks of age. During the course of 21 weeks, mice underwent extensive metabolic phenotyping as described (Williams et al., 2016). At week 29, animals were fasted overnight before sacrifice at 9:00 am. Blood was collected from isoflurane-anesthetized mice via the vena cavae, and immediately afterwards animals were perfused with 4°C PBS, through the left ventricle, then organs were harvested. Blood was collected in lithium-heparin (LiHep)–coated tubes (Microvette CB 300 Hep-Lithium, Sarstedt) shaken and kept in ice. The blood samples were centrifuged at 4500 revolutions per minute (rpm) for 10 min at 4°C before being flash-frozen in liquid nitrogen for subsequent measurement of plasma lipid species (see companion article [Jha et al., 2018]) and plasma clinical traits. Due to breeding limitations and unforeseen deaths of some mice during the course of phenotyping, all strains do not have 5 mice each, average being 3–5 mice/strain.
For in vivo validation of CL species, liver samples were used from our previous study (Gariani et al., 2016). In brief, male C57BL/6J mice were separated into three groups of 6–9 mice per group, at the age of 7 weeks. Animal cohorts were fed a CD, a Western high-fat and high-sucrose (HFHS) diet [HFHS; Harlan Teklad, TD.08811, (44.6% kcal from fat; 40.7% kcal from carbohydrate; 14.7% kcal from protein)] or a HFHS diet that was supplemented with NR (400 mg/kg/day) at week 16 till week 25 (9 weeks). Mice were sacrificed after a 4hr fast at 9:00 am. All experiments were approved by the Swiss cantonal veterinary authorities of Vaud under licenses 2257, 2257.1 and 2465.
Fatty acid composition (%) in the diet of BXD cohorts
| Fatty acids | Symbol | CD | HFD |
|---|---|---|---|
| Palmitic | C16:0 | 0.7 | 8.02 |
| Stearic | C18:0 | 0.2 | 3.93 |
| Oleic | C18:1n9 | 1.2 | 14.68 |
| Linoleic | C18:2n6 | 3.1 | 4.7 |
| Linolenic | C18:3n3 | 0.3 | 0.55 |
| Saturated fat | 0.9 | 12.48 | |
| Monounsaturated fat | 1.3 | 16.05 | |
| Polyunsaturated fat | 3.4 | 5.4 | |
| Total fat | 6.2 | 34.3 |
METHOD DETAILS
Plasma clinical traits of BXD cohorts
Plasma parameters were measured on 2 times diluted samples (1:1 ratio of plasma to diluent) using Dimension®Xpand Plus (Siemens Healthcare Diagnostics AG, Dudingen, Switzerland). The biochemical tests were performed according to the manufacturer instructions for each parameters: AST (Siemens Healthcare, DF41A), ALT (Siemens Healthcare, DF143), Glucose (Siemens Healthcare, DF40), HDL (Siemens Healthcare, DF48B), LDL (Siemens Healthcare, DF131), Cholesterol (Siemens Healthcare, DF27), LDH (Siemens Healthcare, DF54), TG (Siemens Healthcare, DF69A) and FFA (FUJIFILM Wako Dignostics, NEFA-HR (2)). Insulin concentration was measured with an ELISA assay kit (Mouse Insulin ELISA Kit; Mercodia).
Clinical traits used for correlation of lipid signatures with metabolic phenotypes in C57BL/6J mice (Figure 2F) was obtained from our previous study (Gariani et al., 2016). BXD metabolic and clinical data can be obtained from (Williams et al., 2016) and also available on GeneNetwork (http://www.genenetwork.org).
Body composition (EchoMRI)
In addition to the body weight measurements taken each week and before each phenotyping experiment, body composition was recorded at 16, 23, and 25 weeks of age. To do so, each mouse was placed briefly in an EchoMRI (magnetic resonance imaging) machine (the 3-in-1, EchoMedical Systems), where lean and fat mass are recorded, along with total body weight, taking ~1 min per individual. Data was normalized to total body.
TAG measurement of BXD Livers
For BXDs, 15μl of the liver lipid extract (same extract as used for liver lipid MS measurement, see companion article [Jha et al., 2018]) was used for TAG quantification using the Serum Triglyceride determination kit (Sigma-Aldrich), as per manufacturer’s instructions. The organic solvent mix used for dissolving lipids for the MS (mixture of acetonitrile (ACN)/isopropyl alcohol (IPA)/water (H2O), (65:30:5, v/v/v, 100μL)) was used as blank and for standard curve.
NAD+ measurement of C57BL/6J livers
~20mg of frozen liver samples were used for NAD+ extraction in 10%perchloric acid and neutralized in 3MK2CO3 on ice. After centrifugation, the supernatant was filtered and the internal standard (NAD-C13) was added and loaded onto a column (150 Å~ 2.1 mm; Kinetex EVO C18, 100 Å). HPLC was run for 1min at a flow rate of 300 ml/min with 100% buffer A (Methanol/H2O, 80/20% v,v). Then, a linear gradient to 100% buffer B [H2O + 5mM ammonium acetate] was performed (at 1 to 6min). Buffer B (100%) was maintained for 3 min (at 6 to 9 min), and then a linear gradient back to 100% buffer A (at 9 to 13 min) began. Buffer A was then maintained at 100% until the end (at 13 to 18 min). NAD+ eluted as a sharp peak at 3.3 min and was quantified on the basis of the peak area ratio between NAD+ and the internal standard and normalized to tissue weight.
Lipidomics sample preparation and analysis
Internal standards (IS) used
For BXD liver samples we used Q6, PC(15:0/15:0), PS(17:0/17:0), PE(15:0/15:0), PA(17:0/17:0), PG(15:0/15:0), CL(56:0) and FA(15:0/15:0) as internal standards. For NAFLD signature validation experiments in mice (Figure 2), we used the standard mix SPLASH® Lipidomix® Mass Spec Standard | 330707, supplemented with Q6 and CL(56:0).
Extractions
Liver samples were weighed and homogenized using a Potter-Elvehjem tissue grinder in 1.5 mL homogenization buffer (8 Murea, 50 mM TEAB, 100 mM NaCl, 1 mM CaCl, protease and phosphatase inhibitors (Roche)). Protein concentration was determined by BCA and all samples were diluted to 8 mg/mL with homogenization buffer. Samples were aliquoted with each tube containing 1 mg of protein (125 μL) and flash frozen in liquid N2 and stored at −80 °C. Frozen aliquots of liver extracts were thawed on ice and processed for lipid extraction as previously described (Stefely et al., 2016). In brief, liver extracts were thawed on ice then internal standards were added (20 μL) and samples were vortexed (30 s). Chloroform/methanol (1:1, v/v, 1000 μL) was added and samples were vortexed (60 s). Subsequently, HCl (1 M, 200 μL) was added to induce phase separation, followed by vortexing (60 s) and centrifugation (3,000 g, 3 min, 4°C) to complete phase separation. 550 μL of the organic phase was dried under Ar2(g). The organic residue was reconstituted in ACN/IPA/H2O (65:30:5, v/v/v, 100 μL) by vortexing (60 s) and transferred to a glass vial for LC-MS analysis. Samples were stored at −80 °C until further use. LC–MS analysis was performed on an Ascentis Express C18 column held at 50°C (150 mm × 2.1 mm × 2.7 μm particle size; Supelco) using an Accela LC Pump (500 μL/min flow rate; Thermo). Mobile phase A consisted of 10 mM ammonium acetate in ACN/H2O (70:30, v/v) containing 250 μL/L acetic acid. Mobile phase B consisted of 10 mM ammonium acetate in IPA/ACN (90:10, v/v) with the same additives. 10 μL of sample were injected by an HTC PAL autosampler (Thermo). Initially, mobile phase B was held at 40% for 30 s and then increased to 50% over an additional 30 s. It was then increased to 55% over 4 min after which, it was increased to 99% over 6 min and held there for 3 min. Prior to the next injection, the column was reequilibrated for 2 min. The LC system was coupled to a Q Exactive mass spectrometer (Build 2.3 SP2) by a HESI II heated ESI source kept at 325 °C (Thermo). The inlet capillary was kept at 320 °C, sheath gas was set to 35 units, aux iliary gas to 15 units, and the spray voltage was set to 3,000 V in negative mode and 4,000 V in positive mode.
Several scan functions, including targeted and untargeted, were used to ensure optimal data acquisition for each lipid class. For fatty acids, selected ion monitoring (SIM) scans were taken from 0–3 min. MS1 data was acquired in negative mode for 220–600 m/z at a resolving power of 17,500 and an AGC target of 1 × 10⁵. For phospholipids, diacylglycerols, and CoQ, parallel reaction monitoring (PRM) was used. The instrument was run in negative mode with a resolving power of 17,500, an AGC target of 2 × 10⁵, a maximum injection time of 75 ms, and isolation window of 1.2 Th. Scans targeting each species were scheduled between 0–10.3 min based on previously determined retention times. For triglycerides, a separate set of runs was done where in addition to the targeted method described above, the MS was operated in positive mode from 10.1–13 min with resolving power set at 17,500 and the AGC target set to 5 × 10⁵. Ions from 750–1,100 m/z were isolated (Top 2) and fragmented.
Measurement, normalization and quality control
The selection of lipid species for measurement was based on their abundance, stability, polarity and ease of ionization. For the BXDs, peaks were automatically integrated using TraceFinder software (Thermo) and integrations were checked manually. NR mice were processed as described in our companion article [Jha et al., 2018]. Lipids were normalized in three different ways - to internal standards (of each class), to total lipids in each sample and to all lipids in each class. Basic quality check and QTL analysis was performed from all the datasets, however the dataset normalized to total lipids was used for all the analyses and figures shown in the manuscript due to the overall low relative standard deviation in this dataset (data not shown). Additionally, normalization to total lipids has two major advantages over the other normalization methods; 1) All lipids measured did not have a true internal standard, 2) for lipid classes that have few lipid species measured, normalizing to class will be largely driven by one or two highly abundant lipids. Quality assessment of the MS measurements was performed by comparing the reproducibility of the technical and extraction replicates (see fig S1A–S1C). Note: lipid pairs marked with “_1” and “_2” (TAGs 54:5, 54:6, 56:7; PI(Dha/S) and CL(LLOPo) indicate two isobaric peaks. The TAGs are isobaric peaks with different fatty acid compositions while the PI and CL are isobaric because they have the exact same fatty acid composition but are likely ordered differently to cause chromatographic separation.
QUANTIFICATION AND STATISTICAL ANALYSIS
Bioinformatic and Genetic analyses
Data normality for each lipid species was checked by the Shapiro-Wilk test in R, with a W ≥ 0.90 considered normal distribution. Correlations are Pearson’s r or Spearman’s rho, as indicated. Student’s t-test was used for two group comparisons in normal data of equal variances, and Welch’s t-test otherwise. Heatmaps were generated using the “heatmap.2” function in R. Unweighted correlation network graphs were performed using Spearman correlation, keeping all edges with P values less than 1e-4, 1e-03 or 0.05 (indicated in the figure) in R using the custom package imsbInfer, currently on Github (https://github.com/wolski/imsbInfer). GO and KEGG pathway enrichment analysis for was performed using the R package “clusterProfiler” (Yu et al., 2012) (https://bioconductor.org/packages/release/bioc/html/clusterProfiler.html). Enriched pathways after Benjamini-Hochberg correction (p < 0.05) are shown in the figures. For Circos plot (Figure 3) data were pre-processed in R followed by plot construction using web based http://circos.ca/ (Krzywinski et al., 2009) and then modification in Adobe Illustrator.
QTL calculations were performed using the R/qtl (v 1.39–5) package (Arends et al., 2010) on the log2 transformed data. The BXD genotype used for QTL calculations is provided in the Table S8. Parametric QTL calculation was performed for normally distributed lipids and non-parametric for those that were not normally distributed. QTLs with logarithm of the odds ratio (LOD) score >2.5 and p-value <0.40 were used for all the analysis, which includes both significant (p-value < 0.05) and suggestive QTLs (p-value between 0.05 and 0.40) at genome-wide significant threshold, computed by permutation analysis. [Genome-wide p-values of 0.63 correspond approximately to a local p-value of 0.05, i.e. which is significant in case of prior knowledge used to search for a QTL at that specific location]. All significant and suggestive threshold lines in the paper represent genome-wide p-value of 0.05 and 0.63 respectively.
All graphs and analyses were performed either in R or GraphPad. For R, standard R plotting packages included in gplots or ggplot2—e.g., stripchart, plotCI, and barplot2 were used. Final figures were prepared with Adobe Illustrator.
QTL candidate gene retrieval
To perform QTL candidate gene retrieval biomaRt was used in R to obtain lists of genes located within each QTL region (+/− 5 Mb around the mapped SNP). Gene lists were imported into MATLAB for subsequent parallel filtering of candidate genes as follows: (i) genes with non-synonymous SNPs, insertion/deletion/splice site mutations, or high impact non-coding SNPs in the BXDs (Wang et al., 2016); (ii) genes under the lQTLs with cis e- and/or p-QTLs; (iii) genes/proteins with significant correlation (p<0.05) with the lipid itself; and (iv) genes with variable transcript expression (standard deviation >0.25) across BXD strains. Pearson’s correlation was used to correlate transcript and protein abundances with log2-transformed lipid levels. GeneNetwork was used to obtain liver gene transcript and peptide values for each BXD strain for mRNA standard deviation and mRNA/protein correlation calculations. Genes passing two or more of the above filtering criteria is provided in Table S5 and detailed list of each lQTL candidate gene with the information on each filtering criteria is provided in Table S6.
BXD lQTL and human GWAS genes overlap
Human GWAS genes (having p-value <1e-07) were retrieved from the database GWASdb2 (http://jjwanglab.org/gwasdb) (Li et al., 2016) and complemented with the data from the GWAS Catalog (https://www.ebi.ac.uk/gwas/) (MacArthur et al., 2017). The categories of GWAS genesets retrieved from these databases included “Abnormality of lipid metabolism” and “fatty liver disease”. Additionally, published papers reporting the relevant GWAS studies, not included in the above-mentioned databases (in particular, the references indicated by their PMID in Table S7) were manually mined to retrieve the candidate genes having p-value <1e-07. Taken together, the compiled list comprised of 494 genes (Table S7). Only those lQTL genes (±5Mb on either side of the peak QTL), which passed at least 2 filtering criteria (as shown in Figure 4B) were matched for any evidence of them being associated with abnormal lipid metabolism in human GWAS (i.e. matched for their presence in 494 human GWAS gene list).
Weighted gene correlation network analysis
Weighted gene correlation network analysis (WGCNA) (Figure 1 and S2) was performed as described (Langfelder and Horvath, 2008) by using the WGCNA R software package (v1.51). To construct the weighted lipid coexpression network, we calculated a correlation matrix containing all pairwise Pearson’s correlations between all pairs of lipids across all BXD strains for both CD and HFD. We defined a “signed hybrid” network in which the adjacency takes values between 0 and 1 when the correlation is positive and 0 if the correlation is negative. A power of 27 was chosen for both CD and HFD datasets. We selected the minimum power in which both datasets followed the Scale-Free Topology Criterion (model fitting index R2 > 0.8) and showed a similar connectivity. The selection of a high power (threshold) has the effect of suppressing low correlations that may be due to noise, penalize weaker connections and strengthen stronger connections. The result is a network adjacency that is zero for negatively correlated lipids and is positive for positively correlated lipids. Adjacency of weakly correlated lipids is nearly zero due to the power transformation. Next, the lipids were hierarchically clustered using the distance measure and modules were determined by choosing a height cutoff for the resulting dendrogram by using a dynamic tree-cutting algorithm, selecting a minimum module size of 5. Modules with a correlation higher than 0.75 were merged. The resulting lipid modules were assigned color names and identified using the eigenvector of each module, named as module eigenlipid. Module eigenlipid (ME) is defined as the first principal component of the standardized expression profiles and can be considered the best summary of the standardized module expression data. Each module is represented by different colors; lipids not grouped in any module (34% in CD and 42% in HFD) were represented in grey color. By and large, modules were dominated by lipids from the same class (Figure S2A). Modules containing lipids from the same class exhibited high adjacency between them in both diets (eg. CL modules). Correspondence analysis between CD and HFD was performed by calculating the overlaps of each pair of CD-HFD modules and analyzed using the Fisher’s exact test (Figure S2B). From the 8 modules identified in both diets, 3 of them showed total correspondence between CD and HFD: DAG (black), FFA (red) and TAG (brown) modules; while the 3 CL modules (green, blue and yellow) showed a very high correspondence between CD and HFD (Figure S2B). Module-trait relationships (Figure 1D) were calculated by Pearson’s correlation between MEs and selected metabolic phenotypes in order to identify modules related to metabolic functions. For module pathway association (Figure 1E), KEGG enrichment analysis was performed for all positively and negatively correlated proteins (p<0.05) separately, with the modules. Module QTL (modQTL) was calculated from the values of the MEs as phenotype traits using the R package R/qtl (v 1.39–5) (Broman et al., 2003) using the same methods and criteria as for lQTLs.
Enrichment analysis of proteins and transcripts with liver TAG concentration
KEGG enrichment analysis was performed for all proteins and transcripts that correlated with liver total TAG levels (Figure 6B). For liver proteomics correlation: 333 proteins in CD and 74 in HFD out of 2,622 measured proteins (by SWATH) significantly correlated with liver total TAG concentration. For liver transcriptomics correlation: 1,752 transcripts in CD and 879 transcripts in HFD out of 35,556 transcripts measured (using Affy Mouse Gene 1.0ST) significantly correlated with liver total TAG concentration. Benjamini-Hochberg corrected (p < 0.05) enriched pathways are shown in the figure. No significant enrichment was observed in HFD cohorts.
DATA AND SOFTWARE AVAILABILITY
Raw MS data files are available through the CHORUS project data repository (Project ID 1432, Experiment ID 3217 and 3218). Additionally, normalized MS data is deposited in GeneNetwork (http://www.genenetwork.org) as a resource for public use. To access and analyze the data in GeneNetwork, choose “Mouse (mm10)” for “Species”, “BXD” for “Group”, “Phenotypes” for “Type”, “BXD Published Phenotype” for “Data Set” and enter “LiverLipidomics” for “Get Any”. Normalized MS data (normalized to total lipids) is provided in Table S1. Lipid QTLs are provided in Table S5. lQTL genes passing two of the four filtering criteria (as shown in Figure 4B) are provided in Table S5 and the exhaustive list for the same is provided in table S6. BXD genotype data used for QTL calculation is provided in Table S8.
Supplementary Material
Tab1: Lipid abbreviation and the list of liver lipid species measured in each class along with their predominant side chain fatty acid (FA) composition.
Tab2: MS data (normalized to total lipids measured) of all lipid species measured.
Lipids in each module
Log2-fold change of the lipids measured (HFD vs. CD) and their p-value. Nominal p-value (Student’s t-test) and adjusted p-value (Benjamini-Hochberg corrected significance) are indicated for all lipids in columns G and H respectively. Spearman correlation between CD and HFD lipids and the p-value of the correlation are indicated in columns I and J.
Heritability (h2) of all lipid species. h2 was calculated by one-way (CD/HFD) or two-way (Mixed) ANOVA.
QTL position of all lipid species and lipid modules. Genes passing 2 or more filtering criteria (as shown in Figure 4B) for each lQTL with LOD score >2.5 and p-value <0.40 are indicated.
Candidate genes for each lQTL in CD and HFD is provided in their respective worksheet. All genes under the lQTLs were filtered along the parallel pipelines as indicated in Figure 4B. Score “1” and “0” indicate whether the gene fulfills the filtering criteria indicated in the 1st row (1=yes; 0=No). The 1st worksheet (summary) summarizes all the genes under the lQTls along with the scores of their filter. Candidate genes having lipid associated GO terms [“lipid metabolic process”, “lipid particle”, “lipid binding”, “transferase activity, transferring acyl groups” and “hydrolase activity, acting on carbon-nitrogen (but not peptide) bonds”] are denoted with “1”. GO annotations for candidate genes were obtained from EBI-EMBL QuickGO REST API, and the MATLAB Bioinformatics Toolbox was used to match specified GO terms to the gene annotations for filtering. To ensure precision of search, only genes with valid UniProt/Swiss-Prot IDs were scored for gene ontology. Additionally, the KEGG pathways of candidate genes are indicated.
Tab1: lQTLs harboring genes associated with abnormal lipid metabolism in human GWAS [Extended version of the table in Fig 6A]. lQTL genes fulfilling 2 filtering criteria as shown in Figure 4B were screened for any known association with abnormal lipid metabolism in human GWAS. The screening identified 20 GWAS genes from 17 lQTLs. Each box of the table represents the lQTL(s) in either diet (along with its chromosomal position, LOD score and the p-value) for the indicated gene(s) and the GWAS phenotype associated with the genes. The gene name and its metabolic function are also provided. Selective literature references for the GWAS phenotype of the given genes is provided as PMID. GWAS phenotypes abbreviations are as follows: NAFLD, non-alcoholic fatty liver disease; TG, triglyceride; TC, total cholesterol; HDL-C, HDL cholesterol; LDL-C, LDL cholesterol; PL, phospholipid; ALT, alanine transaminase; T2D, type 2 diabetes.
Tab2: List of all the human GWAS genes associated with abnormal lipid metabolism
Tab3: List of TAG biosynthetic pathway genes used for searching lQTL genes for Figure 6C.
Genotype data of the BXDs used for QTL estimation shown in Table S5.
Highlights.
Lipid modules are associated with phenotypic traits and metabolic pathways
Specific cardiolipin species are associated with healthy or fatty liver signatures
Most lipid species are complex traits, regulated by loci spread across the genome
A new lipid QTL mining pipeline identifies plausible genes regulating lipid species
Acknowledgments
We thank the Center of Phenogenomics (CPG, EPFL) for performing BXD phenotyping and R.W.Williams for BXDs and GeneNetwork maintenance. JA is supported by grants from the École Polytechnique Fédérale de Lausanne, the Swiss National Science Foundation (31003A-140780), the AgingX program of the Swiss Initiative for Systems Biology (51RTP0-151019), and the NIH (R01AG043930). DP is supported by a grant from NIH (R01GM115591) for lipidomics analysis. MM and EGW were supported by NIH fellowships (T32GM007215 and F32GM119190, respectively). JC is supported by NIH grants R35GM118110 and P41GM108538.
Footnotes
Competing interest statement
The authors declare no competing interests.
Author contributions
Conceptualization, P.J., D.P., and J.A; MS extractions, Methodology and measurement, M.T.M; Formal Analysis, M.B.S and P.J.; Investigation and Analysis, P.J. and P.M.Q.; Candidate genes retrieval, GWAS analysis and circus plot; P.J., P.M.Q., R.G. and L.D.; Data Curation, P.J. and E.G.W.; Supervision (MS), J.J.C, D.P.; Standardization (MS), A.J., A.U.; Validation, P.J., R.G. and K.G.; Writing-Original Draft, P.J. and J.A.; Writing – Review & Editing, P.J., J.A., D.P., R.G., M.T.M and E.G.W.; Visualization, P.J., E.G.W., J.A. and D.P; Project Administration and Funding Acquisition; J.A. and D.P.
Publisher's Disclaimer: This is a PDF file of an unedited manuscript that has been accepted for publication. As a service to our customers we are providing this early version of the manuscript. The manuscript will undergo copyediting, typesetting, and review of the resulting proof before it is published in its final citable form. Please note that during the production process errors may be discovered which could affect the content, and all legal disclaimers that apply to the journal pertain.
References
- Andreux PA, Williams EG, Koutnikova H, Houtkooper RH, Champy MF, Henry H, Schoonjans K, Williams RW, Auwerx J. Systems genetics of metabolism: the use of the BXD murine reference panel for multiscalar integration of traits. Cell. 2012;150:1287–1299. doi: 10.1016/j.cell.2012.08.012. [DOI] [PMC free article] [PubMed] [Google Scholar]
- Anstee QM, Day CP. The genetics of NAFLD. Nature reviews Gastroenterology & hepatology. 2013;10:645–655. doi: 10.1038/nrgastro.2013.182. [DOI] [PubMed] [Google Scholar]
- Arends D, Prins P, Jansen RC, Broman KW. R/qtl: high-throughput multiple QTL mapping. Bioinformatics. 2010;26:2990–2992. doi: 10.1093/bioinformatics/btq565. [DOI] [PMC free article] [PubMed] [Google Scholar]
- Belknap JK. Effect of within-strain sample size on QTL detection and mapping using recombinant inbred mouse strains. Behavior genetics. 1998;28:29–38. doi: 10.1023/a:1021404714631. [DOI] [PubMed] [Google Scholar]
- Bigaud E, Corrales FJ. Methylthioadenosine (MTA) Regulates Liver Cells Proteome and Methylproteome: Implications in Liver Biology and Disease. Molecular & cellular proteomics: MCP. 2016;15:1498–1510. doi: 10.1074/mcp.M115.055772. [DOI] [PMC free article] [PubMed] [Google Scholar]
- Broman KW, Wu H, Sen S, Churchill GA. R/qtl: QTL mapping in experimental crosses. Bioinformatics. 2003;19:889–890. doi: 10.1093/bioinformatics/btg112. [DOI] [PubMed] [Google Scholar]
- Chicco AJ, Sparagna GC. Role of cardiolipin alterations in mitochondrial dysfunction and disease. American journal of physiology Cell physiology. 2007;292:C33–44. doi: 10.1152/ajpcell.00243.2006. [DOI] [PubMed] [Google Scholar]
- Civelek M, Lusis AJ. Systems genetics approaches to understand complex traits. Nature reviews Genetics. 2014;15:34–48. doi: 10.1038/nrg3575. [DOI] [PMC free article] [PubMed] [Google Scholar]
- Claypool SM, Koehler CM. The complexity of cardiolipin in health and disease. Trends in biochemical sciences. 2012;37:32–41. doi: 10.1016/j.tibs.2011.09.003. [DOI] [PMC free article] [PubMed] [Google Scholar]
- Cole LK, Mejia EM, Vandel M, Sparagna GC, Claypool SM, Dyck-Chan L, Klein J, Hatch GM. Impaired Cardiolipin Biosynthesis Prevents Hepatic Steatosis and Diet-Induced Obesity. Diabetes. 2016;65:3289–3300. doi: 10.2337/db16-0114. [DOI] [PMC free article] [PubMed] [Google Scholar]
- Franks PW, McCarthy MI. Exposing the exposures responsible for type 2 diabetes and obesity. Science. 2016;354:69–73. doi: 10.1126/science.aaf5094. [DOI] [PubMed] [Google Scholar]
- Gariani K, Menzies KJ, Ryu D, Wegner CJ, Wang X, Ropelle ER, Moullan N, Zhang H, Perino A, Lemos V, et al. Eliciting the mitochondrial unfolded protein response by nicotinamide adenine dinucleotide repletion reverses fatty liver disease in mice. Hepatology. 2016;63:1190–1204. doi: 10.1002/hep.28245. [DOI] [PMC free article] [PubMed] [Google Scholar]
- Gronert K, Kantarci A, Levy BD, Clish CB, Odparlik S, Hasturk H, Badwey JA, Colgan SP, Van Dyke TE, Serhan CN. A molecular defect in intracellular lipid signaling in human neutrophils in localized aggressive periodontal tissue damage. Journal of immunology. 2004;172:1856–1861. doi: 10.4049/jimmunol.172.3.1856. [DOI] [PMC free article] [PubMed] [Google Scholar]
- Han X. Lipidomics for studying metabolism. Nature reviews Endocrinology. 2016;12:668–679. doi: 10.1038/nrendo.2016.98. [DOI] [PubMed] [Google Scholar]
- Hui ST, Parks BW, Org E, Norheim F, Che N, Pan C, Castellani LW, Charugundla S, Dirks DL, Psychogios N, et al. The genetic architecture of NAFLD among inbred strains of mice. eLife. 2015;4:e05607. doi: 10.7554/eLife.05607. [DOI] [PMC free article] [PubMed] [Google Scholar]
- Hyotylainen T, Oresic M. Systems biology strategies to study lipidomes in health and disease. Progress in lipid research. 2014;55:43–60. doi: 10.1016/j.plipres.2014.06.001. [DOI] [PubMed] [Google Scholar]
- Jump DB. Fatty acid regulation of hepatic lipid metabolism. Current opinion in clinical nutrition and metabolic care. 2011;14:115–120. doi: 10.1097/MCO.0b013e328342991c. [DOI] [PMC free article] [PubMed] [Google Scholar]
- Kahali B, Halligan B, Speliotes EK. Insights from Genome-Wide Association Analyses of Nonalcoholic Fatty Liver Disease. Seminars in liver disease. 2015;35:375–391. doi: 10.1055/s-0035-1567870. [DOI] [PMC free article] [PubMed] [Google Scholar]
- Koekemoer TC, Oelofsen W. Properties of porcine white adipose tissue and liver mitochondrial subpopulations. The international journal of biochemistry & cell biology. 2001;33:889–901. doi: 10.1016/s1357-2725(01)00064-4. [DOI] [PubMed] [Google Scholar]
- Koybasi S, Senkal CE, Sundararaj K, Spassieva S, Bielawski J, Osta W, Day TA, Jiang JC, Jazwinski SM, Hannun YA, et al. Defects in cell growth regulation by C18:0-ceramide and longevity assurance gene 1 in human head and neck squamous cell carcinomas. The Journal of biological chemistry. 2004;279:44311–44319. doi: 10.1074/jbc.M406920200. [DOI] [PubMed] [Google Scholar]
- Kroesen BJ, Pettus B, Luberto C, Busman M, Sietsma H, de Leij L, Hannun YA. Induction of apoptosis through B-cell receptor cross-linking occurs via de novo generated C16-ceramide and involves mitochondria. The Journal of biological chemistry. 2001;276:13606–13614. doi: 10.1074/jbc.M009517200. [DOI] [PubMed] [Google Scholar]
- Krzywinski M, Schein J, Birol I, Connors J, Gascoyne R, Horsman D, Jones SJ, Marra MA. Circos: an information aesthetic for comparative genomics. Genome research. 2009;19:1639–1645. doi: 10.1101/gr.092759.109. [DOI] [PMC free article] [PubMed] [Google Scholar]
- Langfelder P, Horvath S. WGCNA: an R package for weighted correlation network analysis. BMC bioinformatics. 2008;9:559. doi: 10.1186/1471-2105-9-559. [DOI] [PMC free article] [PubMed] [Google Scholar]
- Li MJ, Liu Z, Wang P, Wong MP, Nelson MR, Kocher JP, Yeager M, Sham PC, Chanock SJ, Xia Z, et al. GWASdb v2: an update database for human genetic variants identified by genome-wide association studies. Nucleic acids research. 2016;44:D869–876. doi: 10.1093/nar/gkv1317. [DOI] [PMC free article] [PubMed] [Google Scholar]
- Lusis AJ, Seldin MM, Allayee H, Bennett BJ, Civelek M, Davis RC, Eskin E, Farber CR, Hui S, Mehrabian M, et al. The Hybrid Mouse Diversity Panel: a resource for systems genetics analyses of metabolic and cardiovascular traits. Journal of lipid research. 2016;57:925–942. doi: 10.1194/jlr.R066944. [DOI] [PMC free article] [PubMed] [Google Scholar]
- MacArthur J, Bowler E, Cerezo M, Gil L, Hall P, Hastings E, Junkins H, McMahon A, Milano A, Morales J, et al. The new NHGRI-EBI Catalog of published genome-wide association studies (GWAS Catalog) Nucleic acids research. 2017;45:D896–D901. doi: 10.1093/nar/gkw1133. [DOI] [PMC free article] [PubMed] [Google Scholar]
- Malhi H, Gores GJ. Molecular mechanisms of lipotoxicity in nonalcoholic fatty liver disease. Seminars in liver disease. 2008;28:360–369. doi: 10.1055/s-0028-1091980. [DOI] [PMC free article] [PubMed] [Google Scholar]
- Peirce JL, Lu L, Gu J, Silver LM, Williams RW. A new set of BXD recombinant inbred lines from advanced intercross populations in mice. BMC Genet. 2004;5:7. doi: 10.1186/1471-2156-5-7. [DOI] [PMC free article] [PubMed] [Google Scholar]
- Quehenberger O, Dennis EA. The human plasma lipidome. N Engl J Med. 2011;365:1812–1823. doi: 10.1056/NEJMra1104901. [DOI] [PMC free article] [PubMed] [Google Scholar]
- Stefely JA, Kwiecien NW, Freiberger EC, Richards AL, Jochem A, Rush MJP, Ulbrich A, Robinson KP, Hutchins PD, Veling MT, et al. Mitochondrial protein functions elucidated by multi-omic mass spectrometry profiling. Nature biotechnology. 2016;34:1191–1197. doi: 10.1038/nbt.3683. [DOI] [PMC free article] [PubMed] [Google Scholar]
- Wang X, Pandey AK, Mulligan MK, Williams EG, Mozhui K, Li Z, Jovaisaite V, Quarles LD, Xiao Z, Huang J, et al. Joint mouse-human phenome-wide association to test gene function and disease risk. Nature communications. 2016;7:10464. doi: 10.1038/ncomms10464. [DOI] [PMC free article] [PubMed] [Google Scholar]
- Wenk MR. The emerging field of lipidomics. Nature reviews Drug discovery. 2005;4:594–610. doi: 10.1038/nrd1776. [DOI] [PubMed] [Google Scholar]
- Williams EG, Wu YB, Jha P, Dubuis S, Blattmann P, Argmann CA, Houten SM, Amariuta T, Wolski W, Zamboni N, et al. Systems proteomics of liver mitochondria function. Science. 2016;352:1292. doi: 10.1126/science.aad0189. [DOI] [PMC free article] [PubMed] [Google Scholar]
- Wu Y, Williams EG, Dubuis S, Mottis A, Jovaisaite V, Houten SM, Argmann CA, Faridi P, Wolski W, Kutalik Z, et al. Multilayered genetic and omics dissection of mitochondrial activity in a mouse reference population. Cell. 2014;158:1415–1430. doi: 10.1016/j.cell.2014.07.039. [DOI] [PMC free article] [PubMed] [Google Scholar]
- Yu G, Wang LG, Han Y, He QY. clusterProfiler: an R package for comparing biological themes among gene clusters. Omics: a journal of integrative biology. 2012;16:284–287. doi: 10.1089/omi.2011.0118. [DOI] [PMC free article] [PubMed] [Google Scholar]
Associated Data
This section collects any data citations, data availability statements, or supplementary materials included in this article.
Supplementary Materials
Tab1: Lipid abbreviation and the list of liver lipid species measured in each class along with their predominant side chain fatty acid (FA) composition.
Tab2: MS data (normalized to total lipids measured) of all lipid species measured.
Lipids in each module
Log2-fold change of the lipids measured (HFD vs. CD) and their p-value. Nominal p-value (Student’s t-test) and adjusted p-value (Benjamini-Hochberg corrected significance) are indicated for all lipids in columns G and H respectively. Spearman correlation between CD and HFD lipids and the p-value of the correlation are indicated in columns I and J.
Heritability (h2) of all lipid species. h2 was calculated by one-way (CD/HFD) or two-way (Mixed) ANOVA.
QTL position of all lipid species and lipid modules. Genes passing 2 or more filtering criteria (as shown in Figure 4B) for each lQTL with LOD score >2.5 and p-value <0.40 are indicated.
Candidate genes for each lQTL in CD and HFD is provided in their respective worksheet. All genes under the lQTLs were filtered along the parallel pipelines as indicated in Figure 4B. Score “1” and “0” indicate whether the gene fulfills the filtering criteria indicated in the 1st row (1=yes; 0=No). The 1st worksheet (summary) summarizes all the genes under the lQTls along with the scores of their filter. Candidate genes having lipid associated GO terms [“lipid metabolic process”, “lipid particle”, “lipid binding”, “transferase activity, transferring acyl groups” and “hydrolase activity, acting on carbon-nitrogen (but not peptide) bonds”] are denoted with “1”. GO annotations for candidate genes were obtained from EBI-EMBL QuickGO REST API, and the MATLAB Bioinformatics Toolbox was used to match specified GO terms to the gene annotations for filtering. To ensure precision of search, only genes with valid UniProt/Swiss-Prot IDs were scored for gene ontology. Additionally, the KEGG pathways of candidate genes are indicated.
Tab1: lQTLs harboring genes associated with abnormal lipid metabolism in human GWAS [Extended version of the table in Fig 6A]. lQTL genes fulfilling 2 filtering criteria as shown in Figure 4B were screened for any known association with abnormal lipid metabolism in human GWAS. The screening identified 20 GWAS genes from 17 lQTLs. Each box of the table represents the lQTL(s) in either diet (along with its chromosomal position, LOD score and the p-value) for the indicated gene(s) and the GWAS phenotype associated with the genes. The gene name and its metabolic function are also provided. Selective literature references for the GWAS phenotype of the given genes is provided as PMID. GWAS phenotypes abbreviations are as follows: NAFLD, non-alcoholic fatty liver disease; TG, triglyceride; TC, total cholesterol; HDL-C, HDL cholesterol; LDL-C, LDL cholesterol; PL, phospholipid; ALT, alanine transaminase; T2D, type 2 diabetes.
Tab2: List of all the human GWAS genes associated with abnormal lipid metabolism
Tab3: List of TAG biosynthetic pathway genes used for searching lQTL genes for Figure 6C.
Genotype data of the BXDs used for QTL estimation shown in Table S5.