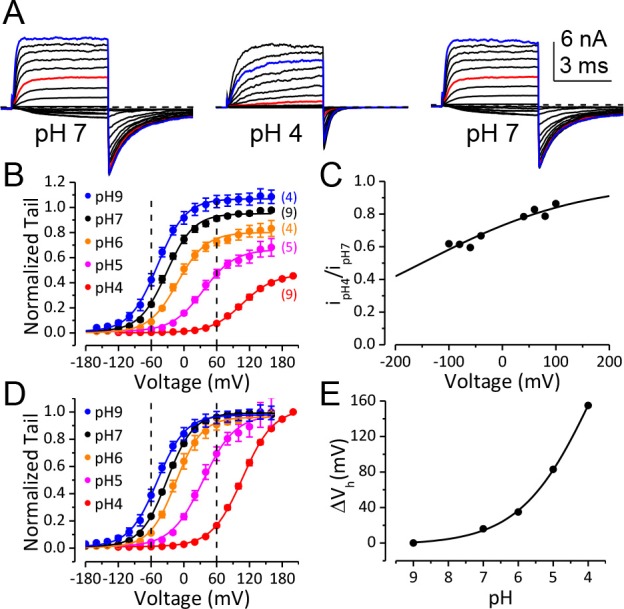
Figure 1. BK channel activation is strongly inhibited when pHO is lower than 5.
(A) Macroscopic BK currents recorded from an outside-out patch perfused with extracellular solutions at pH 7 (left), pH 4 (middle), and back to pH 7. Currents were evoked by steps from −160 to +160 mV at pHO 7 and by steps from −160 mV to +200 mV at pHO 4 (20 mV increments). The pre- and post-test pulse voltages were −140 and −120 mV, respectively. 300 μM Ca2+ was included in pipette (intracellular) solution. The red traces were evoked by +60 mV pulses to highlight the much larger fractional reduction in outward current at this voltage compared to that at +160 mV (blue traces). (B) G-V curves of BK channel generated from tail currents recorded at various pHOs with values normalized to the maximum value at pHO 7. Physiologically relevant voltage range (±60 mV) is marked by two vertical dotted lines here and in panel D. Boltzmann fit results (solid lines) are Gmax = 1.06 ± 0.01, z = 0.97 ± 0.03 e, Vh = −48.8 ± 1.0 mV (pH 9), Gmax = 0.95 ± 0.01, z = 1.00 ± 0.04 e, Vh = −32.4 ± 1.2 mV (pH 7), Gmax = 0.80 ± 0.01, z = 0.97 ± 0.06 e, Vh = −11.7 ± 1.8 mV (pH 6), Gmax = 0.66 ± 0.01, z = 0.86 ± 0.05 e, Vh =+34.8 ± 2.3 mV (pH 5), Gmax = 0.46 ± 0.02, z = 0.90 ± 0.09 e, Vh =+107 ± 3.7 mV (pH 4). The number in parentheses is the number of experiments contributing to each G-V relationship. (C) Voltage-dependent change of BK single channel current induced by extracellular acidification. The filled dots are fractional BK single channel current amplitude determined over the voltage range of ±100 mV when pHO changed from 7 to 4. The Woodhull model (refer to Materials and methods) fit results (solid line) are: kd0 = 0.27 ± 0.02 mM (pH 3.6) and δ = 0.17 e ± 0.02. The prediction of fractional BK single channel current amplitude by the Woodhull model is extended to ±200 mV. Note that the residual single channel current at −120 mV at pHO 4.0 is predicted to be 0.55 of that at pHO 7.0, which is comparable to the Gmax at pHO 4 in panel B. (D) BK G-V curves as those shown in panel B, but with the values at each pHO normalized to the maximum value within that pHO. Boltzmann fit results (solid lines) are Gmax = 0.97 ± 0.01, z = 0.98 ± 0.04 e, Vh = −48.3 ± 1.1 mV (pH 9), Gmax = 0.98 ± 0.01, z = 1.05 ± 0.04 e, Vh = −30.5 ± 1.1 mV (pH 7), Gmax = 0.96 ± 0.01, z = 1.04 ± 0.05 e, Vh = −14.5 ± 1.2 mV (pH 6), Gmax = 0.97 ± 0.01, z = 0.86 ± 0.04 e, Vh =+35.0 ± 1.6 mV (pH 5), Gmax = 1.01 ± 0.02, z = 0.90 ± 0.04 e, Vh =+107.6 ± 1.8 mV (pH 4). The Vh and z values are virtually identical to those determined from the G-Vs in Figure 1B. (E) Dose-response curve of BK gating shift (ΔVh) induced by extracellular H+. Hill equation (ΔVh=ΔVmax/(1+(IC50/[H+])n)) fit result (solid line) is: IC50 = 0.17 ± 0.28 mM (pH 3.8), n = 0.41 ± 0.07.


