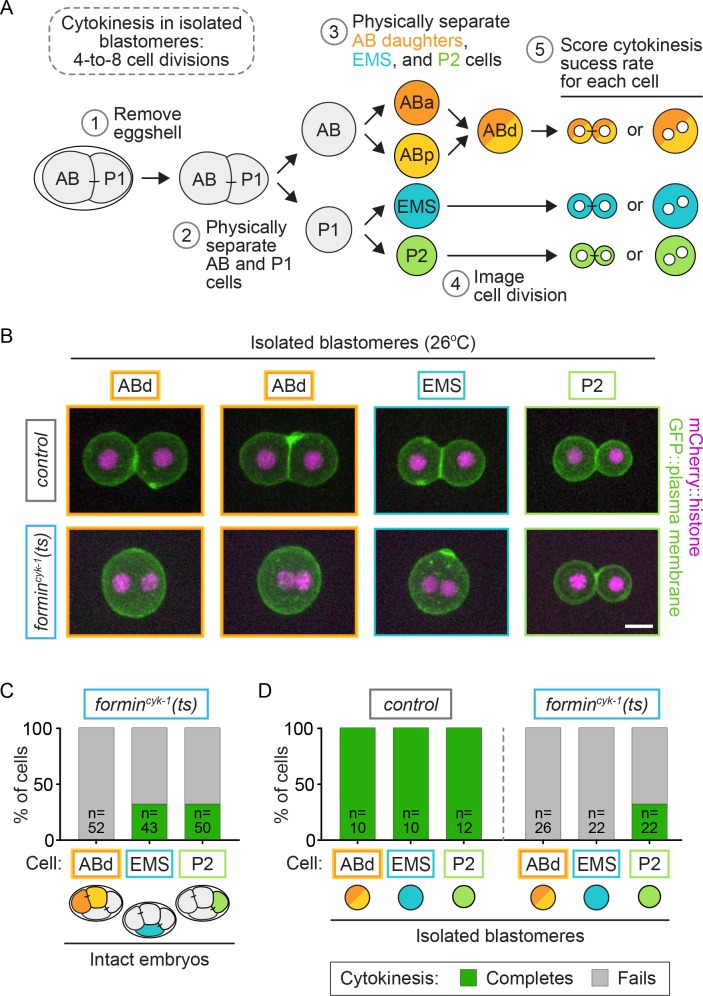
Figure 6. Cell-intrinsic and extrinsic regulation contribute to cytokinesis.
(A) Experimental protocol describing the microdissection, isolation, and separation of individual blastomeres. Steps 1–3 are performed at the permissive temperature (16°C) to ensure the first two-cell divisions occur normally. (B) Representative images showing the cytokinetic outcome of cells isolated from control and formincyk-1(ts) embryos. Cells that divide successfully are seen as two mononucleate daughter cells. Cells that fail in cytokinesis are seen as single binucleate cells. (C) Graph showing the frequency of successful cytokinesis in individual blastomeres in intact formincyk-1(ts) embryos upshifted prior to anaphase onset. Note: this data is sub-sampled from the temporally defined upshift experiments shown in Figure 2B, pooling only those cells upshifted before anaphase onset. ABa and ABp cells have been combined as AB daughters (ABd). (D) Graph showing the frequency of successful cytokinesis for blastomeres isolated from control and formincyk-1(ts) embryos. Temperature, 26°C; scale bar = 10 µm. See also Supplementary file 1.


