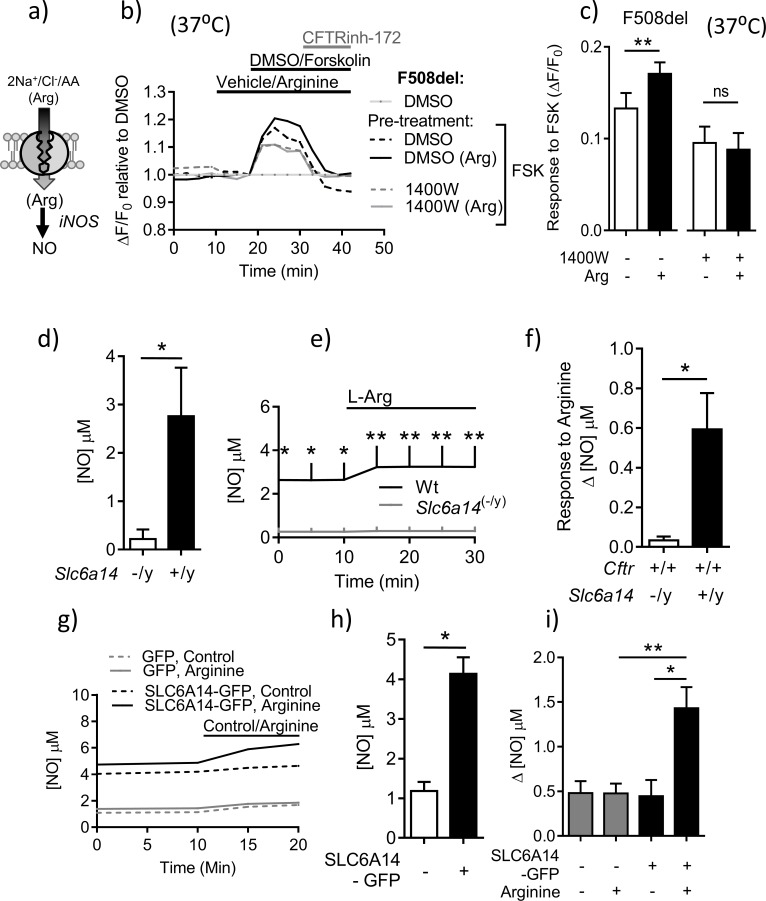
Figure 6. SLC6A14 expression enhances residual cAMP-dependent F508del channel function in murine intestinal tissues via arginine-mediated NO signaling.
(a) Hypothetical model depicting the role of SLC6A14 in transporting arginine across the apical surface thereby increasing intracellular nitric oxide (NO) levels. (b) Split-open colonic organoids from CF (CftrF508del/F508del) mice were studied using the ACC assay at physiological temperature (37°C). Line graph represents change in fluorescence relative to baseline (ΔF/F0) as a measure of F508del-CFTR, after pre-incubation with vehicle or inducible Nitric-oxide Synthase (iNOS) inhibitor 1400W (100 µM) for 30 mins. (c) Bar graph represents maximum change in ACC fluorescence from baseline (ΔF/F0) after acute addition of FSK, at physiological temperature (37°C) in F508del-CFTR split-open murine organoids (mean ± SEM), after 30 mins pre-incubation with vehicle or iNOS inhibitor 1400W (100 µM). (**p=0.006, ns = not significant, n = 4 biological replicates for each genotype). (d) Epithelial basal NO levels measured using DAF-FM fluorophore, by splitting open colonic organoids derived from Wt and Slc6a14(-/y) mice. Bar graph represents mean ± SEM. Unpaired t-test was performed (*p=0.022, n = 5 biological replicates). (e) Line graph represents change in NO levels upon acute addition of L-arginine (1 mM), in split-open colonic organoids derived from C57Bl/6 Wt and Slc6a14(-/y) mice. Two-way ANOVA with Sidak’s multiple comparison test was performed (p<0.0001, n ≥ 4 for each genotype, for t = 0, 5, 10 mins *p<0.05, for t = 15, 20, 25 mins **p=0.006) (f) Bar graph represents maximum change in intracellular NO levels upon acute addition of L-arginine (1 mM), in split-open colonic organoids from Wt and Slc6a14(-/y) mice (mean ± SD). Unpaired t-test was performed (*p=0.009, n ≥ 4 biological replicates for each genotype). (g) Line graph represents basal [NO] levels and change in [NO] after addition of SLC6A14 agonist L-arginine (1 mM) or control (buffer alone), in split-open murine FVB CftrF508del/F508del colonic organoids transduced with human SLC6A14-GFP or control GFP. (h) Bar graph represents basal [NO] levels in split-open murine organoids transduced with SLC6A14-GFP or just GFP. Mean ± SEM is plotted. Unpaired t-test was performed (*p<0.0001, n = 3 biological replicates). (i) Bar graph represents change in [NO] levels (Δ[NO]) after addition of SLC6A14 agonist L-arginine (1 mM) or control (buffer alone), in split open FVB CftrF508del/F508del colonic organoids transduced with human SLC6A14-GFP or control GFP. Mean ± SEM is plotted. One-way ANOVA with Tukey’s multiple comparison test was performed (*p=0.02, **p=0.006, n ≥ 3 biological replicates for each condition).
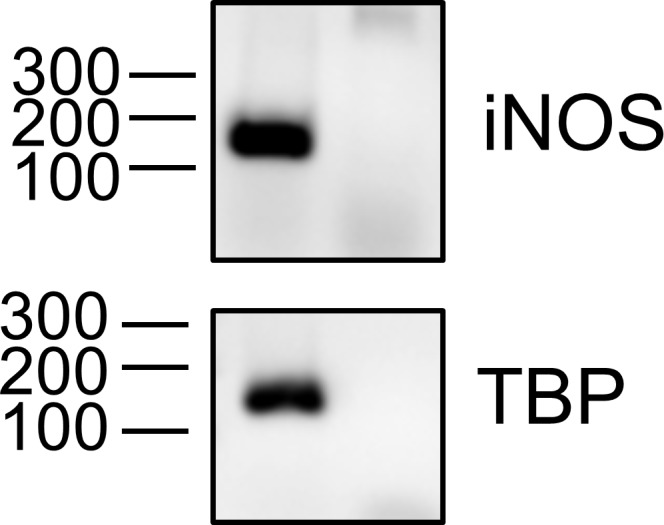
Figure 6—figure supplement 1. iNOS expression in primary murine colonic tissue.


