

Abstract
The selective pressures that shape clonal evolution in healthy individuals are largely unknown. Here we investigate 8,342 mosaic chromosomal alterations (mCAs) of length 50kb–249Mb that we uncovered in blood-derived DNA from 151,202 UK Biobank participants using new phase-based computational techniques (estimated false discovery rate, 6–9%). We found six loci at which inherited variants associated strongly with the acquisition of deletions or loss of heterozygosity in cis. At three such loci (MPL, TM2D3/TARSL2, and FRA10B), we identified a likely causal variant that acted with high penetrance (5–50%). Inherited alleles at one locus appeared to affect the probability of somatic mutation, and at three other loci to be objects of positive or negative clonal selection. Several specific mCAs strongly associated with future hematological malignancies. Our results reveal a multitude of paths toward clonal expansions with a wide range of effects on human health.
Clonal expansions of blood cells with somatic mutations are often observed in individuals without cancer1-13. Consistent with the idea that clonal mosaicism can be a precancerous state, detectable mosaicism confers >10× increased risk of future hematological malignancy1-4 and often involves pro-proliferative mutations. Several results suggest that inherited variation can influence the likelihood of clonal mosaicism11,14-21.
The limiting factor in almost all studies of clonal mosaicism has been sample size, with earlier insights arising from analyses of up to ∼1,000 mosaic events. Two key factors determine the number of detectable mosaic mutations: (i) the number of individuals analyzed, and (ii) the ability to detect clonal expansions present at low-to-modest cell fractions. Here we describe insights from an analysis of 8,342 mosaic chromosomal alterations (mCAs) which we ascertained in SNP-array data from 151,202 UK Biobank participants22 using a sensitive algorithm we developed to utilize long-range haplotype phase information (building on ref.8). We also draw upon data on health outcomes during 4–9 years after DNA sampling.
We report new insights into clonal expansion revealed by these data, including mechanisms by which inherited variants at several loci act in cis to generate or propel mosaicism. We also identify specific mCAs that associate strongly with future hematological malignancies.
Results
Mosaic chromosomal alterations in UK Biobank
We analyzed allele-specific SNP-array intensity data previously obtained by genotyping blood-derived DNA from 151,202 UK Biobank participants 40–70 years of age22; 607,525 genotyped variants remained after quality control (Methods). We detected mCAs at cell fractions as low as 1% by utilizing long-range phase information uniquely available in UK Biobank23,24. Intuitively, accurate phasing allows detection of subtle imbalances in the abundances of two haplotypes by combining allele-specific information across very many SNPs (Extended Data Fig. 1). To maximally utilize phase information, we developed a new statistical method for phase-based mCA detection (Methods and Supplementary Note 1).
We detected 8,342 mCAs (in 7,484 of the 151,202 individuals analyzed) at an estimated false discovery rate (FDR) of 6–9% (Fig. 1, Extended Data Fig. 2, Supplementary Table 1, and Supplementary Notes 2 and 3; validation rates could differ from this FDR estimate). We confidently classified 71% of the detected mCAs as either loss, copy-number neutral loss of heterozygosity (CNN-LOH), or gain; for the other 29% of events, copy-number state could not be inferred definitively (Fig. 2a and Supplementary Note 1). Most detected mCAs (5,901 of 8,342) were present at inferred cell fractions <5% (Supplementary Note 4) and would have been undetectable without long-range phasing (Supplementary Note 5). The genomic distribution of detected mCAs was broadly consistent with previous studies1,2,7,8, as was the observation that individuals acquire multiple mCAs much more frequently than expected by chance (Fig. 2b, Extended Data Fig. 3, Supplementary Tables 2 and 3, and Supplementary Note 6); differences (e.g., in relative rates of del(20q) calls; cf. ref.25) could be explained by differing methodological sensitivity or genotyping platforms (Supplementary Note 4).
Figure 1. Mosaic chromosomal alterations detected in 151,202 UK Biobank participants.

Each horizontal line corresponds to an mCA; a total of 5,562 autosomal events in 4,889 unique individuals are displayed. We detected an additional 2,780 chromosome X events in females (mostly whole-chromosome losses). Detected events are color-coded by copy number. Focal deletions are labeled in red with names of putative target genes. Loci containing inherited variants influencing somatic events in cis are labeled in the color of the mCA (red for del(10q)-associated FRA10B, green for CNN-LOH-associated loci). Enlarged per-chromosome plots are provided in Supplementary Note 2.
Figure 2. Distributional properties of detected mCAs.

(a) Log2 R ratio (LRR), measuring total allelic intensity, scales roughly linearly with B-allele frequency (BAF) deviation, measuring relative allelic intensity, among events with each copy number1,2,8. (b) Most individuals with a detected autosomal mCA have only one event, although a larger number than expected (441 vs. 100) have multiple events. Several pairs of mCA types co-occur much more frequently than expected by chance; edge weights in the co-occurrence graph scale with enrichment. (c) Autosomes with more gain events tend to have fewer loss events (excluding deletions involving V(D) J recombination on chromosomes 14 and 22); Spearman's test on n=22 autosomes. (d) Fractions of individuals with at least one detected autosomal event increase steadily with age, and this trend is even more pronounced for X chromosome events in females. Error bars, 95% CI. (e) Carriers of different mCA types have different age and sex distributions. Error bars, s.e.m. (f) Different mCAs are significantly enriched (FDR 0.05) among individuals with anomalous blood counts in different blood lineages (adjusted for age, sex, and smoking status; Methods). Numeric data including exact sample sizes used to compute error bars are provided in Supplementary Tables 1–6.
Commonly deleted regions (CDRs) <1Mb in length may indicate haploinsufficient tumor-suppressor genes for which loss of one copy promotes cell proliferation2. Focal deletions most frequently targeted 13q14, DNMT3A, and TET2, as previously observed2,8; we further observed that most CNN-LOH events on 13q, 2p, and 4q spanned these same CDRs (Fig. 1 and Supplementary Note 7). We detected new CDRs at ETV6, NF1, and CHEK2, which are commonly mutated in cancers, and at RPA2 and RYBP. We also detected a CDR at 16p11.2 overlapping a region whose deletion is a well-known risk factor for autism and other neuropsychiatric phenotypes, though we did not detect this mCA among 2,079 sequenced genomes from the Simons Simplex Collection (SSC)26,27 (Supplementary Note 8). Deletions tended to be concentrated on chromosomes that are seldom duplicated (Fig. 2c and Supplementary Table 1) (cf. ref.28), supporting the theory that cumulative haploinsufficiency and triplosensitivity shapes clonal evolution29.
We found several interesting exceptions to a general pattern in which acquired mutations are most common in the elderly and in males1,2,7,8 (Fig. 2d and Supplementary Table 4). Loss of chromosome X in females30 was by far the most common event we detected (Supplementary Table 1 and Supplementary Note 2), with frequency increasing dramatically with advancing age (Fig. 2d and Supplementary Table 4). (We did not examine Y loss, which has been studied elsewhere21.) Stratifying autosomal mCAs by location and copy number revealed a surprising relationship: although most gain events were (as expected) enriched in elderly individuals and in males, CNN-LOH events tended to affect both sexes equally (Fig. 2e and Supplementary Table 5). Three mCAs exhibited unusual age and sex distributions (FDR 0.05; binomial and z-tests): gains on chromosome 15 were much more frequent in elderly males31, while 16p11.2 deletions and 10q terminal deletions were much more frequent in females and exhibited no enrichment in the elderly. Age-independent events could occur early in development or take less time to reach high cell fractions; sex-skewing (which replicates in previous data sets1,2,8; Supplementary Note 3) will require future work to explain.
Some acquired mutations could in principle arise or be selected within specific hematopoietic lineages. We tested this hypothesis by examining individuals with top-1% indices of lymphocytes, basophils, monocytes, neutrophils, red blood cells, or platelets. We identified many mCAs that were significantly concentrated (FDR 0.05; Fisher's exact test) in one or more of these subsets of the cohort (Fig. 2f and Supplementary Table 6). Consistent with the idea that these relationships might reflect clonal selection in specific blood cell types, mutations commonly observed in chronic lymphocytic leukemia (CLL)32,33 were enriched among individuals with high lymphocyte counts, and JAK2-related 9p events (commonly observed in myeloproliferative neoplasms, MPNs) were most common among individuals with high myeloid indices. While future work will be needed to replicate and further explore these findings, our results suggest that mCAs may produce blood-composition phenotypes in individuals with no known malignancy.
Inherited variants affect acquisition of nearby mCAs
To identify inherited influences on mCA formation or selection, we performed chromosome-wide scans for associations between mCAs and germline variants on the same chromosome (Methods). This analysis revealed four loci at which inherited variation strongly associated with the acquisition of genomically nearby autosomal mCAs, and two loci on chromsome X associated with X loss in females (Table 1, Fig. 3, and Fig. 4). We also replicated an earlier association of JAK2 46/1 with 9p CNN-LOH15-18,20 (Extended Data Fig. 4). To discern potential mechanisms underlying these associations, we fine-mapped these loci using whole-genome sequence data and studied the phase of risk alleles relative to associated chromosomal alterations in cis.
Table 1. Novel genome-wide significant associations of mCAs with inherited variants.
| GWAS | Risk allelic shift in hets | |||||||||
|---|---|---|---|---|---|---|---|---|---|---|
|
| ||||||||||
| SV type | Locus | Variant | Location | Allelesa | RAFb | P | OR(95% CI) | Nincc | Ndec | P |
| cis | ||||||||||
| associations | ||||||||||
| 10q loss | FRA10B | rs118137427d | 10q25.2 | A/G | 0.05 | 6.1×10−42 | 18 (12–26) | 0 | 43 | 2.3×10⁻¹³ |
| 1p CNN-LOH | MPL | rs144279563 | 1p34.1 | C/T | 0.0005 | 6.2×10⁻¹⁶ | 53 (28–99) | 0 | 9 | 3.9×10⁻³ |
| rs182971382 | 1p34.1 | A/G | 0.0003 | 3.0×10⁻¹¹ | 63 (29–139) | 0 | 4 | 1.3×10⁻¹ | ||
| rs369156948e | 1p34.2 | C/T | 0.0001 | 7.3×10⁻⁸ | 103 (35–300) | 0 | 3 | 2.5×10⁻¹ | ||
| 11q CNN-LOH | ATM | rs532198118 | 11q22.3 | A/G | 0.0007 | 7.4×10⁻⁹ | 41 (18–94) | 6 | 0 | 3.1×10⁻² |
| 15q CNN-LOH and loss | TM2D3, TARSL2 | 70kb deletionf | 15q26.3 | CN=1/0 | 0.0003 | 1.3×10−86 | 698 (442–1102) | 39 | 2 | 7.8×10⁻¹⁰ |
| chrX loss | DXZ1 | rs2942875 | Xp11.1 | T/C | 0.55 | 9.7×10⁻⁴ | 1.09 (1.04–1.15) | 423 | 796 | 6.6×10⁻²⁷ |
| DXZ4 | rs11091036 | Xq23 | C/G | 0.73 | 1.1×10⁻³ | 1.10 (1.04–1.17) | 369 | 555 | 1.0×10⁻⁹ | |
|
| ||||||||||
| trans | ||||||||||
| associations | ||||||||||
| chrX loss | SP140L | rs725201 | 2q37.1 | G/T | 0.56 | 9.2×10⁻¹⁰ | 1.17 (1.12–1.24) | – | – | – |
| HLA | rs141806003 | 6p21.33 | C/CAAAG | 0.34 | 6.1×10⁻¹⁰ | 1.18 (1.12–1.25) | – | – | – | |
Results of two independent association tests are reported: (i) a Fisher test treating individuals with a given mCA type as cases; and (ii) (for cis associations) a binomial test for biased allelic imbalance in heterozygous cases (Methods). All loci reaching P<1×10⁻⁸ in either test are reported; each cis association detected by one test reached nominal (P<0.05) significance in the other test. At significant loci, the lead associated variant as well as additional independent associations reaching P<1×10⁻⁶ are reported.
Risk lowering/risk increasing allele.
Risk allele frequency (in UK Biobank European-ancestry individuals).
Number of mosaic individuals heterozygous for the variant in which the somatic event shifted the allelic balance in favor of the risk allele (by duplication of its chromosomal segment and/or loss of the homologous segment).
rs118137427 tags expanded repeats at FRA10B (Fig. 3).
rs369156948 is a nonsense mutation in MPL.
This deletion spans chr15:102.15–102.22Mb (hg19) and is tagged by rs182643535.
Figure 3. Repeat expansions at fragile site FRA10B driving breakage at 10q25.2.

(a) Germline variants at 10q25.2 associate strongly with terminal 10q mosaic deletion (Fisher's exact test, n=120,664 individuals). Left boundaries of the deletions are called with error; true breakpoints are probably near-identical (Supplementary Note 4). (b) UK Biobank carriers of terminal 10q deletion are predominantly female (51 of n=60 individuals; error bars, 95% CI) with age distribution similar to the overall study population (violin plot centers, means; error bars, 95% CI). (c) WGS samples with terminal 10q deletion (two parent-child duos) carry inherited expanded repeats at FRA10B.
Figure 4. Novel loci associated with mCAs in cis due to clonal selection.

(a) MPL, (b) ATM, (c), TM2D3/TARSL2. In each locus, one or more inherited genetic variants predispose chromosomal mutations to create a proliferative advantage. Bottom: genomic modifications; top: association P-values (Fisher's exact test, n=120,664 individuals). Independent lead associated variants are labeled, and variants are colored according to linkage disequilibrium with lead variants (in shades of red, gold, or green; variants in grey are not in LD with lead variants). In panel (c), the differing arrow weights to CNN-LOH and loss events indicate that CNN-LOH is the more common scenario (both in the population and among carriers of the risk variant).
Somatic terminal 10q deletions associated strongly (P=6.1×10−42; Fisher's exact test) with the common SNP rs118137427 near FRA10B, a known genomic fragile site34,35 at the estimated common breakpoint of the 10q deletions (Table 1 and Fig. 3a). All 60 individuals with these mosaic 10q deletions had inherited the rs118137427:G risk allele (allele frequency=5% in the population), which was always inherited on the same chromosome that subsequently acquired a terminal deletion (Table 1).
To identify a causal variant potentially tagged by the rs118137427:G risk allele, we searched for acquired 10q deletions in WGS data from 2,079 SSC individuals (Methods). We identified two parent-child duos in which both parent and child had acquired the 10q terminal deletion (in mosaic form); all four individuals possessed expanded AT-rich repeats at FRA10B on the rs118137427:G haplotype background (P=0.01; Fig. 3c). Further evidence that the rs118137427:G risk allele tags an unstable version of the FRA10B locus36 was provided by analysis of the variable number tandem repeat (VNTR) sequence at FRA10B (in all 2,079 individuals). This analysis revealed a diversity of novel VNTR sequence motifs (12 distinct primary repeat units carried by 26 individuals from 14 families), all on the rs118137427:G haplotype background (Extended Data Fig. 5a,b and Supplementary Note 8). (The VNTR motifs did not associate with autism status in the SSC cohort.) The motifs had lengths 38, 39, 42, and 43bp and exhibited evidence of repeat expansion (probably >75 copies in the longest alleles, based on ref.35); in contrast, the hg19 reference sequence at FRA10B contains three copies of a 40bp repeat. Imputing the VNTRs into UK Biobank showed that they explained 24 of 60 del(10q) cases, despite being present in only ∼0.7% of the cohort (Supplementary Table 7). Interestingly, 51 of 60 del(10q) individuals were female (binomial P=1.8×10⁻⁷), with no skew toward elderly age (Fig. 3b); these unusual patterns require further study (Supplementary Note 8).
CNN-LOH events on chr1p strongly associated (P=6.2×10⁻¹⁶, lead SNP rs144279563) with three independent, rare risk haplotypes (allele frequencies=0.01–0.05%) at the MPL proto-oncogene at 1p34.1; the three haplotypes increased risk for 1p CNN-LOH by factors of 53, 63, and 103 (95% CIs, 28–99, 29–139, and 35–300) (Table 1, Fig. 4a, and Supplementary Table 8). Other 1p CNN-LOH mosaic individuals also shared long haplotypes containing MPL, suggesting additional very rare risk variants (Extended Data Fig. 5c). Interestingly, although gain-of function mutations in MPL lead to myeloproliferative neoplasms37,38, the lead SNP on one haplotype, rs369156948, is a protein-truncating variant (PTV) in MPL with no association to hematological malignancies in UK Biobank (0 cases among 36 carriers).
We were able to identify an intriguing likely mechanism for selection of the CNN-LOH events involving MPL. For all 16 events for which we could confidently phase the inherited risk allele relative to the somatic CNN-LOH, the CNN-LOH mutation had replaced the risk allele with the reference allele (binomial P=3×10⁻⁵; Table 1 and Fig. 4a). These results suggest that among individuals with rare inherited variants that reduce MPL function, recovery of normal MPL gene activity via CNN-LOH provides a proliferative advantage.
CNN-LOH events on chr11q associated (P=7.4×10⁻⁹, OR=41 (18–94)) with a rare risk haplotype (allele frequency=0.07%) surrounding the ATM gene at 11q22.3 (Table 1, Fig. 4b, and Supplementary Table 8). For all 6 CNN-LOH events for which we could confidently phase the risk allele relative to the somatic mutation, the LOH mutation had caused the rare risk allele to become homozygous, suggesting that the risk allele confers a proliferative advantage in the homozygous state (Table 1 and Fig. 4b). (This dynamic contrasts with MPL, at which the rare, inherited risk haplotypes were eliminated by LOH and clonal selection.) While sequencing would be required to identify a causal variant, ATM is a clear putative target: ATM encodes a DNA-damage response kinase that promotes DNA repair and limits cell division, and ATM is often inactivated by mutation in cancers32,33. In our analysis, acquired 11q deletions also appeared to target ATM (Fig. 1 and Supplementary Note 2).
CNN-LOH and loss events at chr15q associated strongly (P=1.3×10−86) with a rare, inherited 70kb deletion (allele frequency=0.03%) that spanned all of TM2D3 and part of TARSL2 at 15q26.3 (Table 1, Fig. 4c, and Extended Data Figures 6 and 7). For 39 of 41 events with high-confidence phase calls, the CNN-LOH or loss was inferred to produce homozygosity or hemizygosity of the inherited deletion, removing the reference (non-deletion) allele from the genome. (This dynamic resembles ATM in suggesting clonal selection for the rare, inherited risk allele.) The 70kb deletion increased risk of 15q mosaicism by a factor of 698 (442–1102): 45 of 89 carriers exhibited detectable 15q events (32 CNN-LOH, 2 loss, 11 ambiguous between CNN-LOH and loss). Interestingly, the 70kb deletion was sometimes inherited on an allele that also had an independent 290kb duplication of the locus (Extended Data Fig. 6); on this more-complex allele, TM2D3 and TARSL2 gene dosage were normal. Carriers of the more-complex allele did not exhibit predisposition to mCAs. Further study will be required to determine a proliferative mechanism involving TM2D3, TARSL2, or noncoding elements within the region.
The high penetrances (up to 50%) for the above cis associations led us to suspect that some risk-allele carriers might harbor multiple subclonal cell populations with the associated alterations. Using a modified version of our methodology, we detected 39 individuals who had acquired two or more CNN-LOH mutations (with different breakpoints and allelic fractions) involving the same chromosome (Extended Data Fig. 8 and Supplementary Note 1). For all 39 individuals with multiple same-chromosome CNN-LOH events, all events involved recurrent selection of the same haplotype (in different clones). Of these 39 haplotypes, 16 carried a risk allele identified by our association scans, 13 appeared to involve other (still-undiscovered) alleles at the same loci, 5 duplicated 13q14 deletions, and 5 involved other genomic loci (Extended Data Fig. 8). This result indicates strong proliferative advantage conferred by CNN-LOH in these individuals and suggests that mitotic recombination occurs sufficiently frequently to yield multiple opportunities for clonal selection in individuals carrying inherited haplotypes with different proclivities for proliferation.
We also found two common variants on chromosome X that weakly increase risk of X loss while strongly influencing (in heterozygous females) which X chromosome is lost in the expanded clone. These involved a strong association (P=6.6×10⁻²⁷, 1.9:1 bias in the lost haplotype) at Xp11.1 near DXZ1 and a weaker association (P=1.0×10⁻⁹, 1.5:1 bias in the lost haplotype) at Xq23 near DXZ4 (Table 1, Supplementary Table 9, and Supplementary Note 9). These associations do not appear to be explained by biased X chromosome inactivation39 (Supplementary Table 10) and hint at yet another mechanism, different from those we have described.
trans associations with mCAs
Genetic variants near genes involved in cell proliferation and cell cycle regulation predispose for male loss of Y19,21, and female loss of X is also heritable (h2=26% (17.4–36.2%) in sib-pair analysis)21, but no associations for X loss have previously been reported. We confirmed the heritability of female X loss by performing BOLT-REML40 analysis (Methods), obtaining a SNP-heritability estimate of hg2=10.6% (s.e. 3.6%). Genome-wide association analysis for trans variants influencing X loss further revealed two genome-wide significant associations at the SP140L and HLA loci (Table 1).
Germline variants affecting cancer risk or chromosome-maintenance phenotypes could in principle increase risk of clonal expansions. We considered 86 variants implicated in previous GWAS on CLL, MPN, Y loss, clonal hematopoiesis, and telomere length and tested these variants for trans association with seven classes of mCAs, stratifying events by copy number and by autosome versus X chromosome. Four variants reached Bonferroni significance (P<8.3×10⁻⁵): two linked variants in TERT11,20,41, a rare frameshift SNP in CHEK220, and a low-frequency 3′ UTR SNP in TP5321,42 (Supplementary Table 11). The TERT and CHEK2 variants associated with multiple types of autosomal events; in contrast, the TP53 SNP primarily associated with losses (both focal autosomal deletions and X losses). Carriers of the CHEK2 frameshift SNP were especially prone to developing multiple mCAs (one-sided binomial P=0.008): 8 of 33 carriers with detected autosomal mosaicism had two or more mCAs, generally in multiple clones.
Mosaic chromomal alterations and subsequent health
Cancer-free individuals with detectable mosaicism (at any locus) have >10× elevated risk of subsequent hematological cancer1-4. For chronic lymphocytic leukemia, a slowly-progressing cancer that is known to be preceded by clonal mosaicism years before progression43,44, mosaic alterations observed in pre-CLL cases occur at the same loci as those observed in CLL32,33,45,46. Using data on health outcomes for UK Biobank participants 4–9 years (median 5.7 years) after DNA sampling, we identified nine specific mCAs significantly associated (FDR<0.05) with subsequent hematological cancer diagnoses (>1 year after DNA collection) in analyses corrected for age and sex and restricted to individuals with normal blood counts at assessment (Fig. 5a and Supplementary Table 12), confirming and providing additional resolution to previous findings1,2. A logistic model combining mosaic status for CLL-associated events with other risk factors—age, sex, CLL genetic risk score (GRS)47, and lymphocyte count—achieved high CLL prediction accuracy (AUC=0.81) in 10-fold cross-validation (Fig. 5b and Extended Data Fig. 9). Most of this predictive power came from early clones with trisomy 12, which we could detect at very low cell fractions (Extended Data Figures 9 and 10). Individuals with incident CLL exhibited clonality up to 6 years before diagnosis, and clonal fraction inversely correlated with time to malignancy (Fig. 5c). We further observed that detectable mosaicism roughly doubled risk for all-cause mortality (corrected for age, sex, and smoking status). This association was explained only partly by cancer deaths (Fig. 5d and Supplementary Table 13) and could reflect effects on cardiovascular illness12, although further study is needed to explore this finding and rule out residual confounding.
Figure 5. Associations between mCAs and incident cancers and mortality.

(a) Multiple mCA types confer increased risk of incident blood cancers diagnosed >1 year after DNA collection in n=109,819 individuals with normal blood counts at assessment (Cochran-Mantel-Haenszel test adjusting for age and sex; error bars, 95% CI). (b) A logistic model including mosaic status for 13q and trisomy 12 events along with other risk factors achieves high out-of-sample prediction accuracy for incident CLL (n=36 cases and 113,923 controls with no cancer history). (c) Time to malignancy tracks inversely with clonal cell fraction in n=46 individuals with detectable clonality (of any mCA) who received CLL diagnoses after assessment (one-sided Pearson's test). (d) Loss, gain, and CNN-LOH events (on any autosome) all confer increased mortality risk in n=128,854 individuals with no cancer history and n=15,782 with prevalent cancers (error bars, 95% CI). Sample exclusions are detailed in Methods. Numeric data are provided in Supplementary Tables 12 and 13.
Discussion
Mosaicism typically results from mutation followed by selective proliferation10, and our results uncover diverse biological mechanisms underlying this transformation. We identified very rare inherited variants that affect either the likelihood of mutation (at FRA10B) or its proliferative impacts (due to CNN-LOH in cis), and we also observed trans influences on clonal hematopoiesis in cell cycle genes TP53, CHEK2, and TERT. Our findings of cis risk loci for CNN-LOH expansions are particularly intriguing: while some CNN-LOH expansions have previously been observed to provide a second hit to a frequently-mutated locus48 or disrupt imprinting49, here we observed that CNN-LOHs can also achieve strong selective advantage by duplicating or removing inherited alleles. The high penetrances (up to 50%) for the inherited CNN-LOH risk variants we identified challenge what is usually seen as a fundamental distinction between inherited alleles and (more-capricious) acquired mutations. A large fraction of carriers of the inherited alleles subsequently acquire and then clonally amplify the mutations in question. The high penetrances imply that mitotic recombination is sufficiently common to predictably unleash latent, inherited opportunities for clonal selection of homozygous cells during the lifespan of an individual, corroborating a recent observation of this phenomenon in skin50. Similarly, we observed Mendelian inheritance patterns for 10q breakage at FRA10B despite this event involving an acquired mutation.
Clonal expansions exhibit varying levels of proliferation and biological transformation and thus have a spectrum of effects on health10. We found that many mCAs, including some of those driven by cis-acting genetic variation, had no discernible adverse effects. However, mCAs commonly seen in blood cancers strongly increased cancer risk and could potentially be used for early detection—although we caution that these results are based on relatively short follow-up (4–9 years of cancer outcomes) and need independent replication. As population-scale efforts to collect genotype data and health outcomes continue to expand—increasing both sample sizes and the power of population-based chromosomal phasing—we anticipate ever-more-powerful analyses of clonal hematopoiesis and its clinical sequelae.
Methods
UK Biobank cohort and genotyping intensity data
The UK Biobank is a very large prospective study of individuals aged 40–70 years at assessment22. Participants attended assessment centers between 2006–2010, where they contributed blood samples for genotyping and blood analysis and answered questionnaires about medical history and environmental exposures. In the years since assessment, health outcome data for these individuals (e.g., cancer diagnoses and deaths) have been accruing via UK national registries.
We analyzed genetic data from the UK Biobank interim release (∼30% of the full UK Biobank) consisting of 152,729 samples typed on the Affymetrix UK BiLEVE and UK Biobank Axiom arrays with ∼800K SNPs each and >95% overlap. We removed 480 individuals marked for exclusion from genomic analyses based on missingness and heterozygosity filters and 1 individual who had withdrawn consent, leaving 152,248 samples. We restricted the variant set to biallelic variants with missingness ≤10% and we further excluded 111 variants found to have significantly different allele frequencies between the UK BiLEVE array and the UK Biobank array, leaving 725,664 variants on autosomes and the X chromosome. Finally, we additionally excluded 118,139 variants for which fewer than 10 samples (or for chrX, fewer than 5 female samples) were called as homozygous for the minor allele; we observed that genotype calls at these variants were susceptible to errors in which rare homozgyotes were called as heterozygotes. We phased the remaining 607,525 variants using Eagle224 with – Kpbwt=40,000 and otherwise default parameters.
We transformed genotyping intensities to log2 R ratio (LRR) and B-allele frequency (BAF) values51 (which measure total and relative allelic intensities) after affine-normalization and GC wave-correction52 in a manner similar to Jacobs et al.1 (Supplementary Note 1). For each sample, we then computed s.d.(BAF) among heterozygous sites within each autosome, and we removed 320 samples with median s.d.(BAF)>0.11 indicating low genotyping quality. Finally, we removed an additional 725 samples with evidence of possible contamination8 (based on apparent short interstitial CNN-LOH events in regions of long-range linkage disequilibrium; Supplementary Note 1) and 1 sample without phenotype data, leaving 151,202 samples for analysis.
Detection of mCAs using long-range haplotype phase
Here we outline the key ideas of our approach to mCA detection; full details are provided in Supplementary Note 1. The core intuition is to harness long-range phase information to search for local imbalances between maternal vs. paternal allelic fractions in a cell population (Extended Data Fig. 1). The utility of haplotype phase for this purpose has previously been recognized8,53,54, but previous approaches have needed to account for phase switch errors occurring roughly every megabase, a general challenge faced by haplotype-based analyses55. In UK Biobank, we have phase information accurate at the scale of tens of megabases23,24, enabling a new modeling approach and considerable gains in sensitivity for detection of large events at low cell fractions (Supplementary Note 5). (We note that because our method is phase-based, it has the limitation that it cannot detect events contained within regions of homozygosity. While this issue is minor in our study of large events, other approaches originally developed for detection of shorter constitutional or high-cell-fraction CNVs are not subject to this limitation56,57.)
Our technique employs a three-state hidden Markov model (HMM) to capture mCA-induced deviations in allelic balance (|ΔBAF|) at heterozygous sites. (In contrast, the hapLOH method8,54 tabulates “switch consistency” between consecutive heterozygous sites.) Our model has a single parameter Θ representing the expected absolute BAF deviation at germline hets within an mCA. In computationally phased genotyping intensity data, multiplying phase calls with (signed) BAF deviations produces contiguous regions within the mCA in which the expected phased BAF deviation is either +Θ or −Θ (with sign flips at phase switch errors); outside the mCA, no BAF deviation is expected. The three states of our HMM encode these three possibilities, and emissions from the states represent noisy BAF measurements. Transitions between the +Θ and −Θ states represent switch errors, while transitions between ±Θ and the 0 state capture mCA boundaries.
Modeling observed phased BAF deviations using a parameterized HMM has the key benefit of naturally producing a likelihood ratio test statistic for determining whether a chromosome contains a mCA. Explicitly, for a given choice of Θ, we can compute the total probability of the observed BAF data under the assumption that mCA-induced BAF deviations have E[|ΔBAF|]=Θ, using standard HMM dynamic programming computations to integrate over uncertainty in phase switches and mCA boundaries. Taking the ratio of the maximum likelihood over all possible choices of Θ to the likelihood for Θ=0 (i.e., no mCA) yields a test statistic. If the HMM perfectly represented the data, this test statistic could be compared to an asymptotic distribution. However, we know in practice that parameters within the HMM (e.g., transition probabilities) are imperfectly estimated, so we instead calibrated our test statistic empirically: we estimated its null distribution by computing test statistics on data with randomized phase, and we used this empirical null to control FDR. Finally, for chromosomes passing the FDR threshold, we called mCA boundaries by sampling state paths from the HMM (using the maximum likelihood value of Θ).
The above detection procedure uses only BAF data and ignores LRR measurements by design (to be maximally robust to genotyping artifacts); however, after detecting events, we incorporated LRR data to call detected mCAs as loss, CNN-LOH, or gain. All mosaic chromosomal alterations cause BAF (measuring relative allelic intensity) to deviate from 0.5 at heterozygous sites, and losses and gains cause LRR (measuring total intensity) to deviate from 0, with deviations increasing with clonal cell fraction; accordingly, we observed that plotting detected events by LRR and BAF deviation produced three linear clusters (Fig. 2a), consistent with previous work1,2,8. We called copy number using chromosome-specific clusters to take advantage of the differing frequencies of event types on different chromosomes. Because the clusters converge as BAF deviation approaches zero, we left copy number uncalled for detected mCAs at low cell fraction (with <95% confident copy number), comprising 29% of all detected mCAs. We then estimated clonal cell fractions as in ref.1.
As a post-processing step to exclude possible constitutional duplications, we filtered events of length >10Mb with LRR>0.35 or with LRR>0.2 and |ΔBAF|>0.16, and we filtered events of length <10Mb with LRR>0.2 or with LRR>0.1 and |ΔBAF|>0.1. We chose these thresholds conservatively based on visual inspection of LRR and BAF distributions, in which likely constitutional duplications formed well-defined clusters (Supplementary Note 1). (Most constitutional duplications were already masked in a pre-processing step involving a separate HMM described in Supplementary Note 1.)
Enrichment of mCA types in blood lineages
We analyzed 14 blood count indices (counts and percentages of lymphocytes, basophils, monocytes, neutrophils, red cells, and platelets, as well as distribution widths of red cells and platelets) from complete blood count data available for 97% of participants. We restricted to individuals of self-reported European ancestry (96% of the cohort), leaving 140,250 individuals; we then stratified by sex and quantile normalized each blood index after regressing out age, age squared, and smoking status.
To identify classes of mCAs linked to different blood cell types, we first classified mCAs based on chromosomal location and copy number. For each autosome, we defined five disjoint categories of mCAs that comprised the majority of detected events: loss on p-arm, loss on q-arm, CNN-LOH on p-arm, CNN-LOH on q-arm, and gain. We subdivided loss and CNN-LOH events by arm but did not subdivide gain events because most gain events are whole-chromosome trisomies (Fig. 1). For chromosome X, we replaced the two loss categories with a single whole-chromosome loss category. Altogether, this classification resulted in 114 mCA types. We restricted our blood cell enrichment analyses to 78 mCA types with at least 10 occurrences, and we further excluded the chr17 gain category (because nearly all of these events arise from i(17q) isochromosomes already counted as 17p– events; Supplementary Note 2).
For each of the 77 remaining mCA types, we computed enrichment of mCAs among individuals with anomalous (top 1%) values of each normalized blood index using Fisher's exact test (two-sided; P-values reported throughout this manuscript are from two-sided statistical tests unless explicitly stated otherwise). We reported significant enrichments passing an FDR threshold of 0.05 (Fig. 2f and Supplementary Table 6).
Chromosome-wide association tests for cis associations with mCAs
To identify inherited variants influencing nearby mCAs, we performed two types of association analyses. First, we searched for variants that increased the probability of developing nearby mCAs. For each variant, we performed a Fisher test for association between the variant and up to three variant-specific case-control phenotypes, defined by considering samples to be cases if they contained (i) loss, (ii) CNN-LOH, or (iii) gain events containing the variant or within 4Mb (to allow for uncertainty in event boundaries). We tested phenotypes with at least 25 cases; in total, 48 out of 69=23×3 possible event types had at least 25 carriers, and the rest were excluded from association analyses. We performed these tests on 51 million imputed variants with minor allele frequency (MAF) >2×10⁻⁵ (imputed by UK Biobank using merged UK10K and 1000 Genomes Phase 3 reference panels58), excluding variants with non-European MAF greater than five times their European MAF, which tended to be poorly imputed. We analyzed 120,664 individuals who remained after restricting to individuals of self-reported British or Irish ancestry, removing principal component outliers (>4 standard deviations), and imposing a relatedness cutoff of 0.05 (using plink --rel-cutoff 0.05)59. (In our non-GWAS analyses, which focused on mosaic individuals, we did not apply any special handling of related individuals as the number of related pairs was very small: e.g., only 11 third-degree or closer relationships among 4,889 individuals with autosomal mosaicism.)
We also ran a second form of association analysis searching for variants for which mCAs tended to shift allelic balance (analogous to allele-specific expression). For a given class of mCAs, for each variant, we examined heterozygous mosaic individuals for which the mCA overlapped the variant, and we performed a binomial test to check whether the mCA was more likely to delete or duplicate one allele versus the other. We restricted the binomial test to individuals in which the variant was confidently phased relative to the mCA (i.e., no disagreement in five random resamples from the HMM used to call the mCA).
Given that the two association tests described above are independent, we applied a two-stage approach to identify robust genome-wide significant associations. We used a P-value threshold of 10−8 for discovery in either test and then checked for nominal P<0.05 significance in the other test (reasoning that variants influencing mCAs would exhibit both types of associations). At all loci with P<10−8 for either test, the most significant variant with P<10−8 in one test reached nominal significance in the other (Table 1). At identified loci, we further searched for secondary independent associations reaching P<10−6.
In our final analyses, we refined mCA phenotypes to slightly increase power to map associations. For the loci associated with 1p, 9p, and 15q CNN-LOH, we found that association strength improved by expanding case status to include all events reaching the telomere (because several detected telomeric events with uncertain copy number were probably actually CNN-LOH events associated with the same germline variants). For the association signal at FRA10B, we refined case status to only include terminal loss events extending from 10q25 to the telomere (because of the breakpoint specificity of this event). We verified that all association tests produced well-calibrated test statistics (Supplementary Note 3).
Identity-by-descent analysis at MPL and FRA10B
At loci for which we found evidence of multiple causal rare variants, we searched for long haplotypes shared identical-by-descent among mCA carriers to further explore the possibility of additional or recurrent causal variants. We called IBD tracts using GERMLINE with haplotype extension60.
Simons Simplex Collection WGS dataset
The Simons Simplex Collection (SSC) is a repository of genetic samples from autism simplex families collected by the Simons Foundation Autism Research Initiative (SFARI)26. We analyzed 2,079 whole-genome sequences from the first phase of SSC sequencing (median coverage 37.8X27) to examine whether mCAs we detected contributed to genetic risk of autism. (The main dataset consisted of 2,076 individuals in 519 quartets; we additionally analyzed three individuals that did not belong to a complete quartet but were of interest based on high read counts at FRA10B.)
Detection and calling of 70kb deletion at 15q26.3
We discovered the inherited 70kb deletion associated with 15q CNN-LOH and loss by mapping the 15q26.3 association signal (specifically, the rs182643535 tag SNP) in WGS data (Fig. 4c and Extended Data Fig. 6). We then called this deletion in the UK Biobank SNP-array data using genotyping intensities at 24 probes in the deleted region (Extended Data Fig. 7).
Detection and imputation of VNTRs at FRA10B
For all WGS samples with ≥10 reads at the FRA10B locus, we attempted to perform local assembly of the reads and identify a primary VNTR motif in the assembly. We identified 12 distinct primary motifs carried by 26 individuals in 14 families (Extended Data Fig. 5a,b and Supplementary Note 8). Due to read dropout in many samples, it is possible that these VNTR motifs may be found in additional samples, and that other VNTR motifs may not have been detected. We imputed the VNTR sequences into UK Biobank using Minimac361. Full details are provided in Supplementary Note 8.
GWAS and heritability estimation for trans drivers of clonality
We tested variants with MAF>1% for trans associations with six classes of mCAs (any event, any loss, any CNN-LOH, any gain, any autosomal event, any autosomal loss) on 120,664 unrelated European-ancestry individuals (described above) using BOLT-LMM62, including 10 principal components, age, and genotyping array as covariates. We also tested association with female X loss using an expanded set of 3,462 likely X loss calls at an FDR of 0.1, restricting this analysis to 66,685 female individuals. In our targeted analysis of 86 variants implicated in previous GWAS, we applied a Bonferroni significance threshold of 8.3×10⁻⁵ based on 86 variants and 7 phenotypes. We estimated SNP-heritability of X loss using BOLT-REML40, transforming estimates to the liability scale63.
Analysis of X chromosome inactivation in GEUVADIS RNA-seq data
To test for possible mediation of preferential X haplotype loss by biased X chromosome inactivation (XCI), we examined GEUVADIS RNA-seq data64 for evidence of biased XCI near the primary biased loss association at Xp11.1. We identified three coding SNPs in FAAH2 within the pericentromeric linkage disequilibrium block containing the association signal. We analyzed RNA-seq data for 61 European-ancestry individuals who were heterozygous for at least one SNP (60 of 61 were heterozygous for all three SNPs, and the remaining individual was heterozygous at two of the SNPs). We used GATK ASEReadCounter65 to identify allele-specific expression from RNA-seq BAM files. Most individuals displayed strong consistent allele-specific expression across the three SNPs, as expected for XCI in clonal lymphoblastoid cell lines39; however, we observed no evidence of systematically biased XCI in favor of one allele or the other (Supplementary Table 10).
UK Biobank cancer phenotypes
We analyzed UK cancer registry data provided by UK Biobank for 23,901 individuals with one or more prevalent or incident cancer diagnoses. Cancer registry data included date of diagnosis and ICD-O-3 histology and behavior codes, which we used to identify individuals with diagnoses of CLL, MPN, or any blood cancer66,67. Because our focus was on prognostic power of mCAs for predicting diagnoses of incident cancers >1 year after DNA collection, we excluded all individuals with cancers reported prior this time (either from cancer registry data or self-report of prevalent cancers). We also restricted our attention to the first diagnosis of cancer in each individual, and we censored diagnoses after September 30, 2014, as suggested by UK Biobank (resulting in a median follow-up time of 5.7 years, s.d. 0.8 years, range 4–9 years). Finally, we restricted analyses to individuals who self-reported European ancestry. These exclusions reduced the total counts of incident cases to 78 (CLL), 42 (MPN), and 441 (any blood cancer), which we analyzed with 119,330 controls. In our primary analyses, we further eliminated individuals with any evidence of potential undiagnosed blood cancer based on anomalous blood counts (lymphocyte count outside the normal range of 1–3.5×10⁹/L, red cell count >6.1×10¹²/L for males or >5.4×10¹²/L for females, platelet count >450×109/L, red cell distribution width >15%), leaving incident case counts of 36 (CLL), 23 (MPN), and 327 (any blood cancer).
Estimation of cancer risk conferred by mCAs
To identify classes of mCAs associated with incident cancer diagnoses, we classified mCAs based on chromosomal location and copy number into the 114 classes described above. We then restricted our attention to the 45 classes with at least 30 carriers (to reduce our multiple hypothesis burden, given that we would be underpowered to detect associations with the rarer events). For each mCA class, we considered a sample to be a case if it contained only the mCA or if the mCA had highest cell fraction among all mCAs detected in the sample (i.e., we did not count carriers of subclonal events as cases). We computed odds ratios and P-values for association between mCA classes and incident cancers using Cochran-Mantel-Haenszel (CMH) tests to stratify by sex and by age (in six 5-year bins). We used the CMH test to compute odds ratios (for incident cancer any time during follow-up) rather than using a Cox proportional hazards model to compute hazard ratios because both the mCA phenotypes and the incident cancer phenotypes were rare, violating normal approximations underlying regression. We reported significant associations passing an FDR threshold of 0.05 (Fig. 5a and Supplementary Table 12).
Prediction of incident CLL
We considered four nested logistic models for prediction of incident CLL. In the first model, a baseline, we included only age and sex as explanatory variables. In the second model, we added CLL genetic risk (computed using 14 high-confidence GWAS hits from ref.47 that had both been previously published and reached P<5×10⁻⁸). In the third model, we added log lymphocyte count. In the full model, we added explanatory variables for 13q and +12 events.
We assessed the accuracy of each model on two benchmark sets of samples. In our primary analyses, we restricted to individuals with normal lymphocyte counts (1–3.5×10⁹/L) at assessment (i.e., exhibiting at most slight clonality); in auxiliary analyses, we removed this restriction (and expanded the full prediction model to include 11q–, +12, 13q–, 13q CNN-LOH, 14q–, 22q–, and the total number of other autosomal events). We performed 10-fold stratified cross-validation to compare model performance. We assessed prediction accuracy by merging results from all cross-validation folds and computing area under the receiver operating characteristic curve (AUC) (Fig. 5b), and we also measured precision-recall performance (Extended Data Fig. 9). (We caution that while AUC is commonly used to assess discriminative power, AUC does not have a direct clinical interpretation68.)
Estimation of mortality risk conferred by mCAs
We analyzed UK death registry data provided by UK Biobank for 4,619 individuals reported to have died since assessment. We censored deaths after December 31, 2015, as suggested by UK Biobank, leaving 4,518 reported deaths over a median follow-up time of 6.9 years (range 5–10 years). We examined the relationship between mCAs and mortality, aiming to extend previous observations that mosaic point mutations increase mortality risk3,4,11. For this analysis, we were insufficiently powered to stratify mCAs by chromosome due to the weaker effects of mCAs on mortality risk and the relatively small number of deaths reported during follow-up. We therefore stratified mCAs only by copy number and computed the hazard ratio conferred by each event class using a Cox proportional hazards model. We restricted these analyses to individuals who self-reported European ancestry, and we adjusted for age and sex as well as smoking status, which was previously associated with clonal hematopoiesis3,11,69 and associates with mosaicism in UK Biobank (P=0.00017). We did not exclude individuals based on blood counts in these analyses (or in our time-to-malignancy versus clonal fraction analyses), hence the larger sample sizes in Fig. 5c,d versus Fig. 5a,b.
Code availability
Code used to perform the analyses in this study is available from the corresponding authors upon request.
Data availability
Mosaic event calls are available in Supplementary Data. Access to the UK Biobank Resource is available via application (http://www.ukbiobank.ac.uk/). Approved researchers can obtain the SSC population dataset described in this study by applying at https://base.sfari.org.
Extended Data
Extended Data Figure 1. Examples of mosaic events called using phased genotyping intensities.
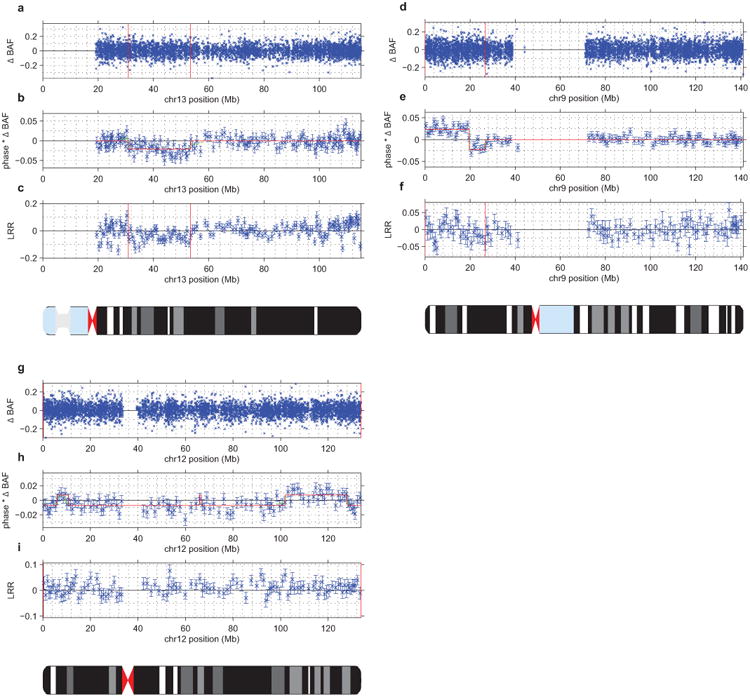
(a–c) UK Biobank mCA sample 2791 has a mosaic deletion of chr13 from ∼31–53Mb that cannot be confidently called from unphased B allele frequency (BAF) and log2 R ratio (LRR) data (a,c). However, the existence of an event is evident in the phased BAF data (b), and the regional decrease in LRR indicates that this event is a deletion. In panel (b), mean phased BAF is plotted for SNPs aggregated into bins spanning n=25 heterozygous sites; the same bins are used for panel (c). Error bars, s.e.m.
d–f) Sample 1645 has a mosaic CNN-LOH on chr9p from the 9p telomere to ∼26Mb that cannot be confidently called from unphased BAF data (d) but is evident in phased BAF data (e). A phase switch error causes a sign flip in phased BAF at ∼20Mb. The lack of a shift in LRR in the region (f) indicates that this event is a CNN-LOH. In panel (e), mean phased BAF is plotted for SNPs aggregated into bins spanning n=50 heterozygous sites; the same bins are used for panel (f). Error bars, s.e.m.
(g–i) Sample 2464 has a full-chromomose mosaic event on chr12 that cannot be confidently called from unphased BAF and LRR data (g,i) but is evident in phased BAF data (h). Several phase switch errors cause sign flips in phased BAF across chr12. The slight positive shift in mean LRR (i) indicates that this event is most likely a mosaic gain of chr12. In panel (h), mean phased BAF is plotted for SNPs aggregated into bins spanning n=50 heterozygous sites; the same bins are used for panel (i). Error bars, s.e.m.
Extended Data Figure 2. Estimation of true FDR using age distributions of individuals with mCA calls.
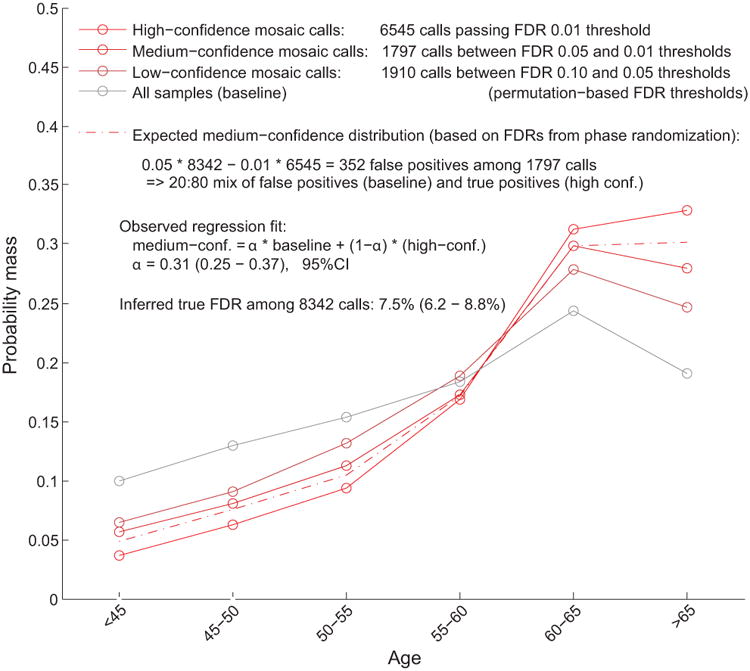
We generated age distributions for (i) “high-confidence” detected events passing a permutation-based FDR threshold of 0.01 (bright red), (ii) “medium-confidence” events below the FDR threshold of 0.01 but passing an FDR threshold of 0.05 (darker red), and (iii) “low-confidence” events below the FDR threshold of 0.05 but passing an FDR threshold of 0.10 (darkest red; not analyzed but plotted for context). We compared these distributions to the overall age distribution of UK Biobank participants (grey). Based on the numbers of events in each category, ≈20% of medium-confidence detected events are expected to be false positives. To estimate our true FDR, we regressed the medium-confidence age distribution on the high-confidence and overall age distributions, reasoning that the medium-confidence age distribution should be a mixture of (a) correctly-called events with age distribution similar to that of the high-confidence events and (b) spurious calls with age distribution similar to the overall cohort. We observed a regression weight of 0.31 for the component corresponding to spurious calls, in good agreement with expectation, and implying a true FDR of 7.5% (6.2–8.8%, 95% CI based on regression fit on n=6 age bins).
Extended Data Figure 3. Clonal cell fractions of co-occurring events generally suggest co-existence within the same cell population.
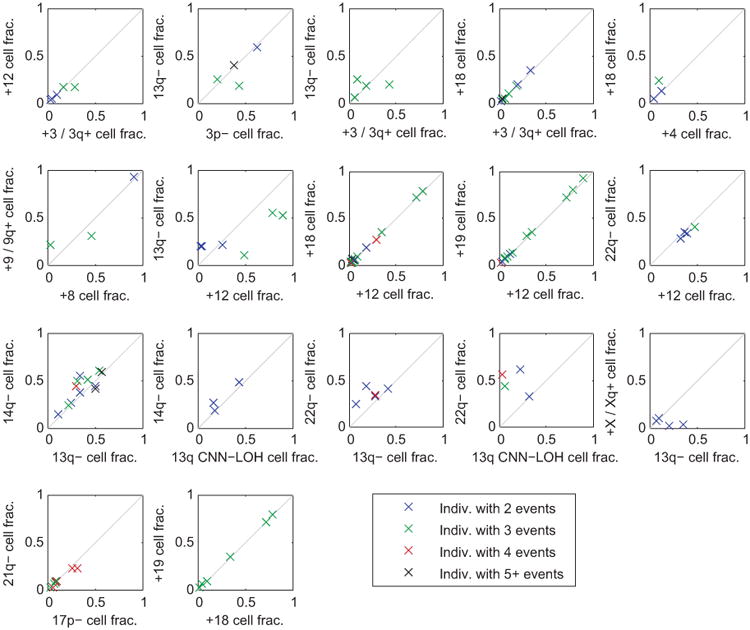
For each pair of significantly co-occurring events (Fig. 2b), we compared the clonal fractions of the two events within each individual that carried both events. Each point in the plots corresponds to an individual carrying the pair of events under consideration; individuals are color-coded by the total number of events they carry. For nearly all pairs of events, the clonal fractions of the two events were very similar in most individuals carrying both events, suggesting that the events occurred in the same clonal cell population. A few exceptions do seem to exist, e.g., 22q– vs. 13q CNN-LOH cell fraction; here, the cell fractions suggest that 13q CNN-LOH events may be present in a subclone. This observation is consistent with acquired uniparental disomy of 13q providing a second hit within a del(13q14) clonal expansion, as we see in Extended Data Fig. 8. (We did not include del(13q14) vs. 13q CNN-LOH in this plot because inference of clonal fractions is complex for these overlapping events; see Extended Data Fig. 8.)
Extended Data Figure 4. Replication of previous association between JAK2 46/1 haplotype and 9p CNN-LOH in cis due to clonal selection.
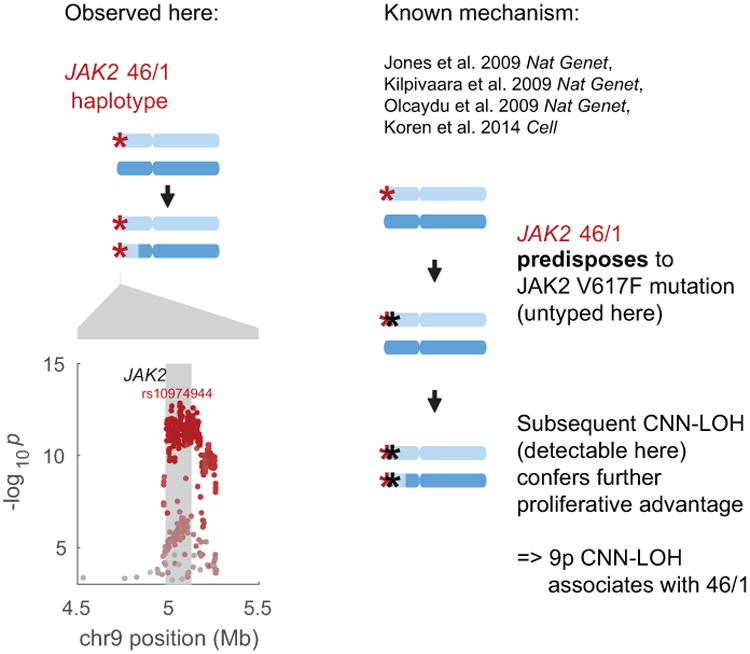
The common JAK2 46/1 haplotype has previously been shown to confer risk of somatic JAK2 V617F mutation such that subsequent 9p CNN-LOH produces a strong proliferative advantage15-18,20 (right side of figure). In our analysis, CNN-LOH on 9p is strongly associated with JAK2 46/1 (P=1.6×10⁻¹³, OR = 2.7 (2.1–3.5); Fisher's exact test on n=120,664 individuals) with the risk haplotype predominantly duplicated by CNN-LOH in hets (52 of n=61 heterozygous cases; binomial P=1.8×10⁻⁸). In the left side of this figure, the genomic modification is illustrated in the top panel and association signals are plotted in the bottom. The lead associated variant is labeled, and variants are colored according to linkage disequilibrium with the lead variant (scaled for readability).
Extended Data Figure 5. Evidence of multiple causal variants for 10q25.2 breakage and 1p CNN-LOH associations.
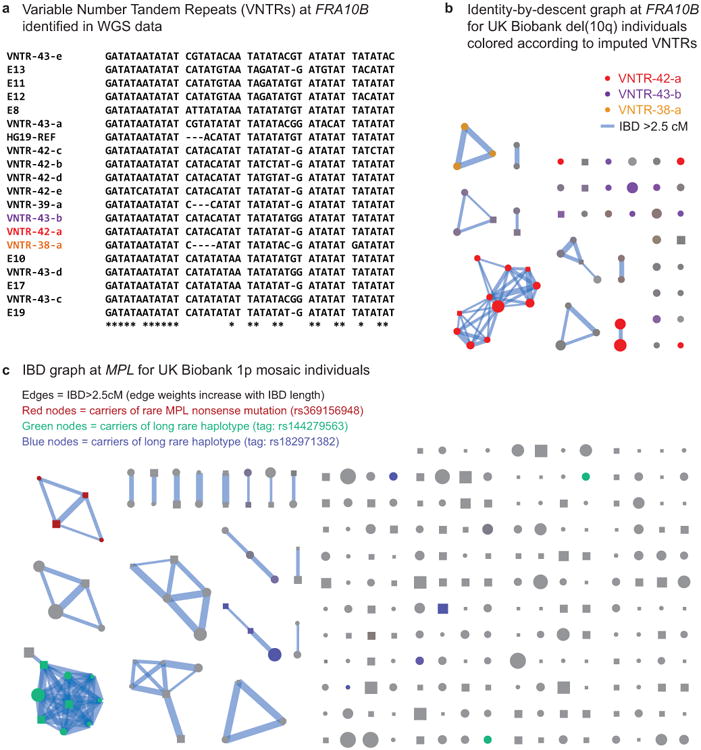
(a) Multiple expanded repeats at FRA10B drive breakage at 10q25.2. We identified 12 distinct primary repeat motifs at FRA10B in 26 whole-genome-sequenced individuals from 14 families (labeled VNTR-N-x, where N denotes length in base pairs); carriers of these repeats exhibit varying degrees of FRA10B repeat expansion (Supplementary Note 8). The repeat motifs are AT-rich and are similar to FRA10B repeats previously reported by Hewett et al.35. The alignment provided here includes the repeat motifs that ref.35 most frequently observed in FRA10B expanded alleles (E8, E13, E17, and E19) along with a few other closely related expanded repeat motifs (E10, E11, and E12). (b) Carriers of the 10q terminal deletion in UK Biobank share long haplotypes at 10q25.2 identical-by-descent. Square nodes in the IBD graph correspond to males and circles to females. Node size is proportional to cell fraction and edge weight increases with IBD length. Colored nodes indicate imputed carriers of variable number tandem repeats (VNTRs) at FRA10B (Supplementary Table 7); color intensity scales with imputed dosage. (c) Identity-by-descent graph at MPL locus (chr1:43.8Mb) on individuals with mCAs on chr1 extending to the p-telomere. Colored nodes indicate imputed carriers of SNPs independently associated with mosaic 1p CNN-LOH (Fig. 4a).
Extended Data Figure 6. Germline CNVs at 15q26.3.
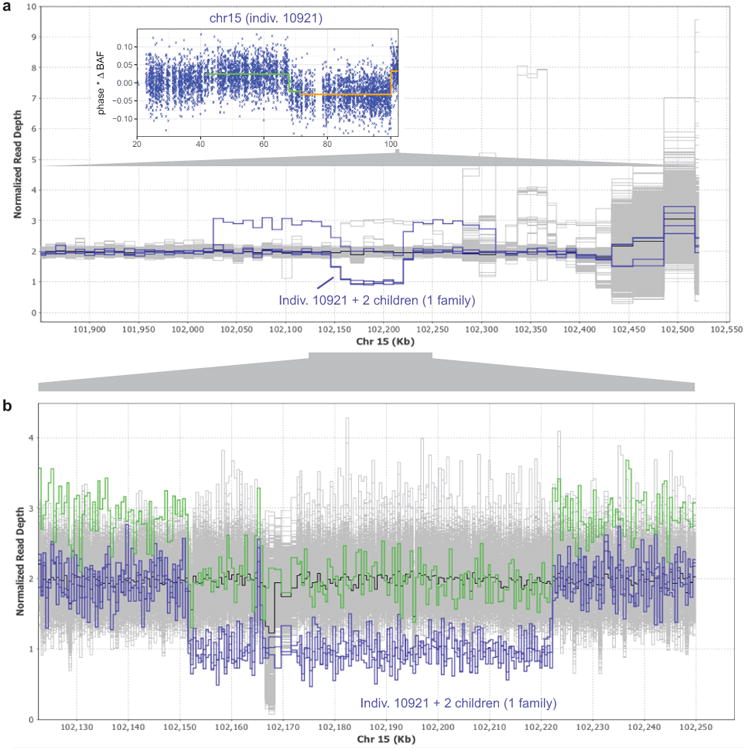
(a) Read depth profile plot of WGS samples in the terminal 700kb of chr15q. Three individuals in one family carry a ∼70kb deletion at 15q26.3, and a fourth carries the same deletion along with a ∼290kb duplication (probably on the same haplotype based on population frequencies of these events; see Extended Data Fig. 7). These four individuals (highlighted in blue) segregate with the rs182643535:T allele in the WGS cohort. Inset: The parental carrier in the family, individual 10921, has detectable mosaicism in two distinct 15q CNN-LOH subclones (one starting at 41.64Mb with 4.6% cell fraction, the other starting at 71.64Mb with an additional 2.0% cell fraction). (b) Zoomed-in read depth profile plot, with deletion-only individuals highlighted in blue and the del+dup individual highlighted in green. Breakpoint analysis indicates that the ∼70kb deletion spans chr15:102151467–102222161 and contains a 1139bp mid-segment (chr15:102164897–102166035) that is retained in inverted orientation. The ∼290kb duplication spans chr15:102026997–102314016.
Extended Data Figure 7. Mosaic chromosomal alterations and germline CNVs at 15q26.3.

Using identified breakpoints of the germline ∼70kb deletion and ∼290kb duplication (Extended Data Fig. 6), we computed mean genotyping intensity (LRR) in UK Biobank samples within the ∼70kb deletion region (24 probes) and within the flanking ∼220kb region (97 probes). Individuals are plotted by flanking 220kb mean LRR vs. 70kb mean LRR and colored by mosaic status for somatic 15q mCAs.
UK Biobank samples carrying the 70kb deletion, 290kb duplication, and del+dup are all easily identifiable in distinct clusters. The plot also appears to contain clusters with higher copy number. Of the three CNV-carrying alleles, the simple 70kb deletion is the only one that predisposes to mCAs. Most mosaic events containing the 70kb deletion are CNN-LOH events that make cells homozygous for the 70kb deletion; two individuals have somatic loss of the homologous (normal) chromosome, making cells hemizygous for the 70kb deletion.
Extended Data Figure 8. Phased BAF plots of chromosomes with multiple CNN-LOH subclones.
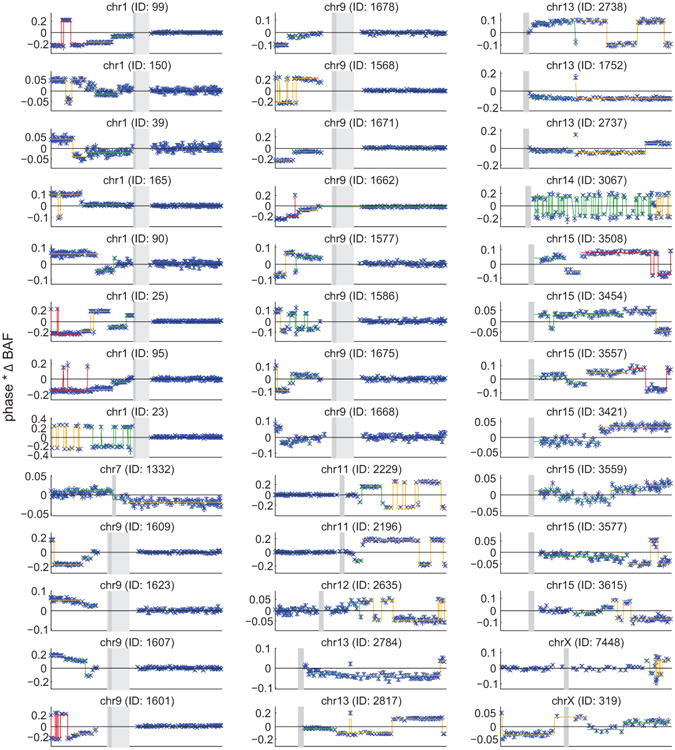
All of the plots exhibit step functions of increasing |ΔBAF| toward a telomere, which is the hallmark of multiple clonal cell populations containing distinct CNN-LOH events that affect different spans of a chromosomal arm (all extending to the telomere). Distinct |ΔBAF| values (called using an HMM) are indicated with different colors. Flips in the sign of phased BAF usually correspond to phase switch errors. Two samples exhibit high switch error rates: 14q individual 3067 (explained by non-European ethnicity), and 1p individual 23 (explained by very high |ΔBAF|; extreme shifts in genotyping intensities result in poor genotyping quality). All five individuals with multiple CNN-LOH events on chr13q appear to contain switch errors over 13q14, but these switches are actually explained by overlapping 13q14 deletions; see Supplementary Note 1 for detailed discussion.
Extended Data Figure 9. CLL prediction accuracy: ROC and precision-recall curves.
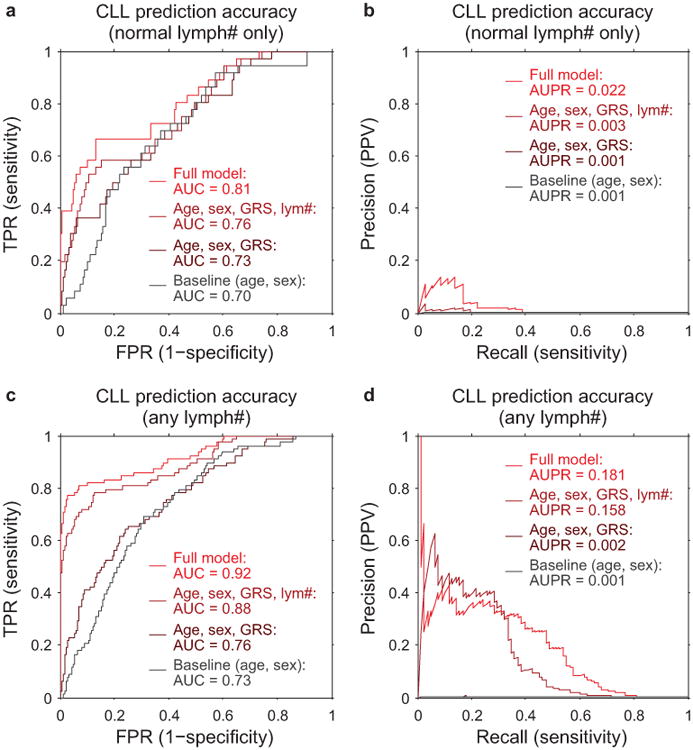
CLL prediction benchmarks using 10-fold stratified cross validation on: (a,b) only individuals with lymphocyte counts in the normal range (1×10⁹/L to 3.5×10⁹/L), as in our primary analyses (n=36 cases, 113,923 controls); and (c,d) individuals with any lymphocyte count (n=78 cases, 118,481 controls). Panel (a) matches Fig. 5b, and panel (b) shows the precision-recall curve from the same analysis. Panels (c) and (d) correspond to an analogous analysis in which we removed the restriction on lymphocyte count and also used additional mosaic event variables for prediction (11q–, 14q–, 22q–, and total number of autosomal events). In both benchmarks, individuals with previous cancer diagnoses or CLL diagnoses within 1 year of assessment are excluded; however, some individuals with very high lymphocyte counts pass this filter (and probably already had CLL at assessment despite being undiagnosed for >1 year), hence the difference in apparent prediction accuracy between the two benchmarks.
Extended Data Figure 10. Mosaic chromosomal alterations detected in CLL cases sorted by lymphocyte count.
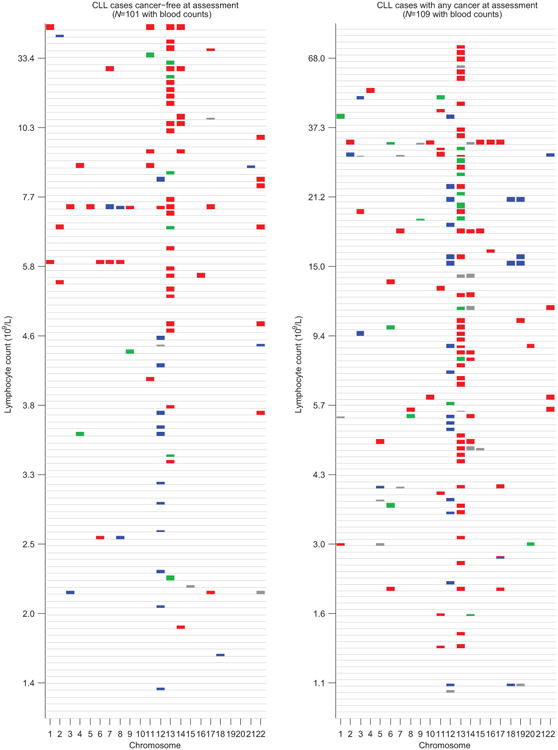
Individuals are stratified by cancer status at DNA collection (no previous diagnosis vs. any previous diagnosis), and mCAs (loss=red, CNN-LOH=green, gain=blue, undetermined=grey) are plotted per chromosome as colored rectangles (with height increasing with BAF deviation).
Supplementary Material
Acknowledgments
We thank Y. Jakubek for assistance with follow-up on del(10q) events in ref.8 and G. Bhatia, A. Gusev, M. Lipson, X. Liu, L. O'Connor, N. Patterson, and B. van de Geijn for helpful discussions. This research was conducted using the UK Biobank Resource under Application #19808. A.L.P. was supported by NIH grants R01 HG006399, R01 GM105857, R01 MH101244, and R21 HG009513. P.-R.L. was supported by NIH fellowship F32 HG007805, a Burroughs Wellcome Fund Career Award at the Scientific Interfaces, and the Next Generation Fund at the Broad Institute of MIT and Harvard. G.G., R.E.H., and S.A.M. were supported by NIH grant R01 HG006855 and the the Stanley Center for Psychiatric Research. H.K.F. was supported by the Fannie and John Hertz Foundation. S.F.B. and G.G. were supported by US Department of Defense Breast Cancer Research Breakthrough Awards W81XWH-16-1-0315 and W81XWH-16-1-0316. S.F.B. was supported by the Elsa U. Pardee Foundation and NCI MSKCC Cancer Center Core Grant P30 CA008748. M.E.T. was supported, in part, by NIH grants UM1 HG008900 and R01 HD081256. Computational analyses were performed on the Orchestra High Performance Compute Cluster at Harvard Medical School, which is partially supported by grant NCRR 1S10RR028832-01, and on the Genetic Cluster Computer (http://www.geneticcluster.org) hosted by SURFsara and financially supported by the Netherlands Scientific Organization (NWO 480-05-003 PI: Posthuma) along with a supplement from the Dutch Brain Foundation and the VU University Amsterdam. This work was supported by a grant from the Simons Foundation (SFARI Award #346042 and #385027, M.E.T.). We are grateful to all of the families at the participating Simons Simplex Collection (SSC) sites, as well as the principal investigators (A. Beaudet, R. Bernier, J. Constantino, E. Cook, E. Fombonne, D. Geschwind, R. Goin-Kochel, E. Hanson, D. Grice, A. Klin, D. Ledbetter, C. Lord, C. Martin, D. Martin, R. Maxim, J. Miles, O. Ousley, K. Pelphrey, B. Peterson, J. Piggot, C. Saulnier, M. State, W. Stone, J. Sutcliffe, C. Walsh, Z. Warren, E. Wijsman). We appreciate obtaining access to genetic and phenotypic data on SFARI Base.
Footnotes
Supplementary Information is available in the online version of the paper.
Author Contributions: P.-R.L., G.G., S.F.B., S.A.M., and A.L.P. designed the study. P.-R.L. and G.G. analyzed UK Biobank data. R.E.H. analyzed SSC data. P.-R.L., G.G., H.K.F., and Y.A.R. developed statistical methods. P.P. assisted with IBD analyses. B.M.B. assisted with cancer phenotype curation. M.E.T. and S.A.M. supervised SSC analyses. All authors wrote the paper.
Author Information: The authors declare no competing financial interests
References
- 1.Jacobs KB, et al. Detectable clonal mosaicism and its relationship to aging and cancer. Nature Genetics. 2012;44:651–658. doi: 10.1038/ng.2270. [DOI] [PMC free article] [PubMed] [Google Scholar]
- 2.Laurie CC, et al. Detectable clonal mosaicism from birth to old age and its relationship to cancer. Nature Genetics. 2012;44:642–650. doi: 10.1038/ng.2271. [DOI] [PMC free article] [PubMed] [Google Scholar]
- 3.Genovese G, et al. Clonal hematopoiesis and blood-cancer risk inferred from blood DNA sequence. New England Journal of Medicine. 2014;371:2477–2487. doi: 10.1056/NEJMoa1409405. [DOI] [PMC free article] [PubMed] [Google Scholar]
- 4.Jaiswal S, et al. Age-related clonal hematopoiesis associated with adverse outcomes. New England Journal of Medicine. 2014;371:2488–2498. doi: 10.1056/NEJMoa1408617. [DOI] [PMC free article] [PubMed] [Google Scholar]
- 5.Xie M, et al. Age-related mutations associated with clonal hematopoietic expansion and malignancies. Nature Medicine. 2014;20:1472–1478. doi: 10.1038/nm.3733. [DOI] [PMC free article] [PubMed] [Google Scholar]
- 6.McKerrell T, et al. Leukemia-associated somatic mutations drive distinct patterns of age-related clonal hemopoiesis. Cell Reports. 2015;10:1239–1245. doi: 10.1016/j.celrep.2015.02.005. [DOI] [PMC free article] [PubMed] [Google Scholar]
- 7.Machiela MJ, et al. Characterization of large structural genetic mosaicism in human autosomes. American Journal of Human Genetics. 2015;96:487–497. doi: 10.1016/j.ajhg.2015.01.011. [DOI] [PMC free article] [PubMed] [Google Scholar]
- 8.Vattathil S, Scheet P. Extensive hidden genomic mosaicism revealed in normal tissue. American Journal of Human Genetics. 2016;98:571–578. doi: 10.1016/j.ajhg.2016.02.003. [DOI] [PMC free article] [PubMed] [Google Scholar]
- 9.Young AL, Challen GA, Birmann BM, Druley TE. Clonal haematopoiesis harbouring AML-associated mutations is ubiquitous in healthy adults. Nature Communications. 2016;7 doi: 10.1038/ncomms12484. [DOI] [PMC free article] [PubMed] [Google Scholar]
- 10.Forsberg LA, Gisselsson D, Dumanski JP. Mosaicism in health and disease—clones picking up speed. Nature Reviews Genetics. 2017;18:128–142. doi: 10.1038/nrg.2016.145. [DOI] [PubMed] [Google Scholar]
- 11.Zink F, et al. Clonal hematopoiesis, with and without candidate driver mutations, is common in the elderly. Blood. 2017;130:742–752. doi: 10.1182/blood-2017-02-769869. [DOI] [PMC free article] [PubMed] [Google Scholar]
- 12.Jaiswal S, et al. Clonal hematopoiesis and risk of atherosclerotic cardiovascular disease. New England Journal of Medicine. 2017;377:111–121. doi: 10.1056/NEJMoa1701719. [DOI] [PMC free article] [PubMed] [Google Scholar]
- 13.Acuna-Hidalgo R, et al. Ultra-sensitive sequencing identifies high prevalence of clonal hematopoiesis-associated mutations throughout adult life. American Journal of Human Genetics. 2017;101:50–64. doi: 10.1016/j.ajhg.2017.05.013. [DOI] [PMC free article] [PubMed] [Google Scholar]
- 14.Laken SJ, et al. Familial colorectal cancer in Ashkenazim due to a hypermutable tract in APC. Nature Genetics. 1997;17:79–83. doi: 10.1038/ng0997-79. [DOI] [PubMed] [Google Scholar]
- 15.Jones AV, et al. JAK2 haplotype is a major risk factor for the development of myeloproliferative neoplasms. Nature Genetics. 2009;41:446–449. doi: 10.1038/ng.334. [DOI] [PMC free article] [PubMed] [Google Scholar]
- 16.Kilpivaara O, et al. A germline JAK2 SNP is associated with predisposition to the development of JAK2V617F-positive myeloproliferative neoplasms. Nature Genetics. 2009;41:455–459. doi: 10.1038/ng.342. [DOI] [PMC free article] [PubMed] [Google Scholar]
- 17.Olcaydu D, et al. A common JAK2 haplotype confers susceptibility to myeloproliferative neoplasms. Nature Genetics. 2009;41:450–454. doi: 10.1038/ng.341. [DOI] [PubMed] [Google Scholar]
- 18.Koren A, et al. Genetic variation in human DNA replication timing. Cell. 2014;159:1015–1026. doi: 10.1016/j.cell.2014.10.025. [DOI] [PMC free article] [PubMed] [Google Scholar]
- 19.Zhou W, et al. Mosaic loss of chromosome Y is associated with common variation near TCL1A. Nature Genetics. 2016;48:563–568. doi: 10.1038/ng.3545. [DOI] [PMC free article] [PubMed] [Google Scholar]
- 20.Hinds DA, et al. Germ line variants predispose to both JAK2 V617F clonal hematopoiesis and myeloproliferative neoplasms. Blood. 2016;128:1121–1128. doi: 10.1182/blood-2015-06-652941. [DOI] [PMC free article] [PubMed] [Google Scholar]
- 21.Wright DJ, et al. Genetic variants associated with mosaic Y chromosome loss highlight cell cycle genes and overlap with cancer susceptibility. Nature Genetics. 2017;49:674–679. doi: 10.1038/ng.3821. [DOI] [PMC free article] [PubMed] [Google Scholar]
- 22.Sudlow C, et al. UK Biobank: an open access resource for identifying the causes of a wide range of complex diseases of middle and old age. PLOS Medicine. 2015;12:1–10. doi: 10.1371/journal.pmed.1001779. [DOI] [PMC free article] [PubMed] [Google Scholar]
- 23.Loh PR, Palamara PF, Price AL. Fast and accurate long-range phasing in a UK Biobank cohort. Nature Genetics. 2016;48:811–816. doi: 10.1038/ng.3571. [DOI] [PMC free article] [PubMed] [Google Scholar]
- 24.Loh PR, et al. Reference-based phasing using the Haplotype Reference Consortium panel. Nature Genetics. 2016;48:1443–1448. doi: 10.1038/ng.3679. [DOI] [PMC free article] [PubMed] [Google Scholar]
- 25.Machiela MJ, et al. Mosaic chromosome 20q deletions are more frequent in the aging population. Blood Advances. 2017;1:380–385. doi: 10.1182/bloodadvances.2016003129. [DOI] [PMC free article] [PubMed] [Google Scholar]
- 26.Fischbach GD, Lord C. The Simons Simplex Collection: a resource for identification of autism genetic risk factors. Neuron. 2010;68:192–195. doi: 10.1016/j.neuron.2010.10.006. [DOI] [PubMed] [Google Scholar]
- 27.Werling DM, et al. Limited contribution of rare, noncoding variation to autism spectrum disorder from sequencing of 2,076 genomes in quartet families. Nature Genetics. 2018 In press. [Google Scholar]
- 28.Beroukhim R, et al. The landscape of somatic copy-number alteration across human cancers. Nature. 2010;463:899–905. doi: 10.1038/nature08822. [DOI] [PMC free article] [PubMed] [Google Scholar]
- 29.Davoli T, et al. Cumulative haploinsufficiency and triplosensitivity drive aneuploidy patterns and shape the cancer genome. Cell. 2013;155:948–962. doi: 10.1016/j.cell.2013.10.011. [DOI] [PMC free article] [PubMed] [Google Scholar]
- 30.Machiela MJ, et al. Female chromosome X mosaicism is age-related and preferentially affects the inactivated X chromosome. Nature Communications. 2016;7 doi: 10.1038/ncomms11843. [DOI] [PMC free article] [PubMed] [Google Scholar]
- 31.Sinclair EJ, Potter AM, Watmore AE, Fitchett M, Ross F. Trisomy 15 associated with loss of the Y chromosome in bone marrow: a possible new aging effect. Cancer Genetics and Cytogenetics. 1998;105:20–23. doi: 10.1016/s0165-4608(98)00003-x. [DOI] [PubMed] [Google Scholar]
- 32.Landau DA, et al. Mutations driving CLL and their evolution in progression and relapse. Nature. 2015;526:525–530. doi: 10.1038/nature15395. [DOI] [PMC free article] [PubMed] [Google Scholar]
- 33.Puente XS, et al. Non-coding recurrent mutations in chronic lymphocytic leukaemia. Nature. 2015;526:519–524. doi: 10.1038/nature14666. [DOI] [PubMed] [Google Scholar]
- 34.Sutherland G, Baker E, Seshadri R. Heritable fragile sites on human chromosomes. V. A new class of fragile site requiring BrdU for expression. American Journal of Human Genetics. 1980;32:542–548. [PMC free article] [PubMed] [Google Scholar]
- 35.Hewett DR, et al. FRA10B structure reveals common elements in repeat expansion and chromosomal fragile site genesis. Molecular Cell. 1998;1:773–781. doi: 10.1016/s1097-2765(00)80077-5. [DOI] [PubMed] [Google Scholar]
- 36.Richards RI, Sutherland GR. Dynamic mutations: a new class of mutations causing human disease. Cell. 1992;70:709–712. doi: 10.1016/0092-8674(92)90302-s. [DOI] [PubMed] [Google Scholar]
- 37.Gurney AL, Carver-Moore K, de Sauvage FJ, Moore MW. Thrombocytopenia in c-mpl-deficient mice. Science. 1994;265:1445–1448. doi: 10.1126/science.8073287. [DOI] [PubMed] [Google Scholar]
- 38.Tefferi A. Novel mutations and their functional and clinical relevance in myeloproliferative neoplasms: JAK2, MPL, TET2, ASXL1, CBL, IDH and IKZF1. Leukemia. 2010;24:1128–1138. doi: 10.1038/leu.2010.69. [DOI] [PMC free article] [PubMed] [Google Scholar]
- 39.Tukiainen T, et al. Landscape of X chromosome inactivation across human tissues. Nature. 2017;550:244–248. doi: 10.1038/nature24265. [DOI] [PMC free article] [PubMed] [Google Scholar]
- 40.Loh PR, et al. Contrasting genetic architectures of schizophrenia and other complex diseases using fast variance components analysis. Nature Genetics. 2015;47:1385–1392. doi: 10.1038/ng.3431. [DOI] [PMC free article] [PubMed] [Google Scholar]
- 41.Oddsson A, et al. The germline sequence variant rs2736100_C in TERT associates with myeloproliferative neoplasms. Leukemia. 2014;28:1371–1374. doi: 10.1038/leu.2014.48. [DOI] [PMC free article] [PubMed] [Google Scholar]
- 42.Stacey SN, et al. A germline variant in the TP53 polyadenylation signal confers cancer susceptibility. Nature Genetics. 2011;43:1098–1103. doi: 10.1038/ng.926. [DOI] [PMC free article] [PubMed] [Google Scholar]
- 43.Rawstron AC, et al. Monoclonal B-cell lymphocytosis and chronic lymphocytic leukemia. New England Journal of Medicine. 2008;359:575–583. doi: 10.1056/NEJMoa075290. [DOI] [PubMed] [Google Scholar]
- 44.Landgren O, et al. B-cell clones as early markers for chronic lymphocytic leukemia. New England Journal of Medicine. 2009;360:659–667. doi: 10.1056/NEJMoa0806122. [DOI] [PMC free article] [PubMed] [Google Scholar]
- 45.Landau DA, et al. Evolution and impact of subclonal mutations in chronic lymphocytic leukemia. Cell. 2013;152:714–726. doi: 10.1016/j.cell.2013.01.019. [DOI] [PMC free article] [PubMed] [Google Scholar]
- 46.Ojha J, et al. Monoclonal B-cell lymphocytosis is characterized by mutations in CLL putative driver genes and clonal heterogeneity many years before disease progression. Leukemia. 2014;28:2395–2398. doi: 10.1038/leu.2014.226. [DOI] [PMC free article] [PubMed] [Google Scholar]
- 47.Berndt SI, et al. Meta-analysis of genome-wide association studies discovers multiple loci for chronic lymphocytic leukemia. Nature Communications. 2016;7 doi: 10.1038/ncomms10933. [DOI] [PMC free article] [PubMed] [Google Scholar]
- 48.O'Keefe C, McDevitt MA, Maciejewski JP. Copy neutral loss of heterozygosity: a novel chromosomal lesion in myeloid malignancies. Blood. 2010;115:2731–2739. doi: 10.1182/blood-2009-10-201848. [DOI] [PMC free article] [PubMed] [Google Scholar]
- 49.Chase A, et al. Profound parental bias associated with chromosome 14 acquired uniparental disomy indicates targeting of an imprinted locus. Leukemia. 2015;29:2069–2074. doi: 10.1038/leu.2015.130. [DOI] [PMC free article] [PubMed] [Google Scholar]
- 50.Choate KA, et al. Mitotic recombination in patients with ichthyosis causes reversion of dominant mutations in KRT10. Science. 2010;330:94–97. doi: 10.1126/science.1192280. [DOI] [PMC free article] [PubMed] [Google Scholar]
- 51.Peiffer DA, et al. High-resolution genomic profiling of chromosomal aberrations using Infinium whole-genome genotyping. Genome Research. 2006;16:1136–1148. doi: 10.1101/gr.5402306. [DOI] [PMC free article] [PubMed] [Google Scholar]
- 52.Diskin SJ, et al. Adjustment of genomic waves in signal intensities from whole-genome SNP genotyping platforms. Nucleic Acids Research. 2008;36:e126. doi: 10.1093/nar/gkn556. [DOI] [PMC free article] [PubMed] [Google Scholar]
- 53.Nik-Zainal S, et al. The life history of 21 breast cancers. Cell. 2012;149:994–1007. doi: 10.1016/j.cell.2012.04.023. [DOI] [PMC free article] [PubMed] [Google Scholar]
- 54.Vattathil S, Scheet P. Haplotype-based profiling of subtle allelic imbalance with SNP arrays. Genome Research. 2013;23:152–158. doi: 10.1101/gr.141374.112. [DOI] [PMC free article] [PubMed] [Google Scholar]
- 55.Genovese G, Leibon G, Pollak MR, Rockmore DN. Improved IBD detection using incomplete haplotype information. BMC Genetics. 2010;11:58. doi: 10.1186/1471-2156-11-58. [DOI] [PMC free article] [PubMed] [Google Scholar]
- 56.Olshen AB, Venkatraman E, Lucito R, Wigler M. Circular binary segmentation for the analysis of array-based DNA copy number data. Biostatistics. 2004;5:557–572. doi: 10.1093/biostatistics/kxh008. [DOI] [PubMed] [Google Scholar]
- 57.Pique-Regi R, Cáceres A, González JR. R-gada: a fast and flexible pipeline for copy number analysis in association studies. BMC Bioinformatics. 2010;11:380. doi: 10.1186/1471-2105-11-380. [DOI] [PMC free article] [PubMed] [Google Scholar]
- 58.Huang J, et al. Improved imputation of low-frequency and rare variants using the UK10K haplotype reference panel. Nature Communications. 2015;6 doi: 10.1038/ncomms9111. [DOI] [PMC free article] [PubMed] [Google Scholar]
- 59.Chang CC, et al. Second-generation PLINK: rising to the challenge of larger and richer datasets. GigaScience. 2015;4:1–16. doi: 10.1186/s13742-015-0047-8. [DOI] [PMC free article] [PubMed] [Google Scholar]
- 60.Gusev A, et al. Whole population, genome-wide mapping of hidden relatedness. Genome Research. 2009;19:318–326. doi: 10.1101/gr.081398.108. [DOI] [PMC free article] [PubMed] [Google Scholar]
- 61.Das S, et al. Next-generation genotype imputation service and methods. Nature Genetics. 2016;48:1284–1287. doi: 10.1038/ng.3656. [DOI] [PMC free article] [PubMed] [Google Scholar]
- 62.Loh PR, et al. Efficient Bayesian mixed model analysis increases association power in large cohorts. Nature Genetics. 2015;47:284–290. doi: 10.1038/ng.3190. [DOI] [PMC free article] [PubMed] [Google Scholar]
- 63.Lee SH, Wray NR, Goddard ME, Visscher PM. Estimating missing heritability for disease from genome-wide association studies. American Journal of Human Genetics. 2011;88:294–305. doi: 10.1016/j.ajhg.2011.02.002. [DOI] [PMC free article] [PubMed] [Google Scholar]
- 64.Lappalainen T, et al. Transcriptome and genome sequencing uncovers functional variation in humans. Nature. 2013;501:506–511. doi: 10.1038/nature12531. [DOI] [PMC free article] [PubMed] [Google Scholar]
- 65.Castel SE, Levy-Moonshine A, Mohammadi P, Banks E, Lappalainen T. Tools and best practices for data processing in allelic expression analysis. Genome Biology. 2015;16:195. doi: 10.1186/s13059-015-0762-6. [DOI] [PMC free article] [PubMed] [Google Scholar]
- 66.Turner JJ, et al. InterLymph hierarchical classification of lymphoid neoplasms for epidemiologic research based on the WHO classification (2008): update and future directions. Blood. 2010;116:e90–e98. doi: 10.1182/blood-2010-06-289561. [DOI] [PMC free article] [PubMed] [Google Scholar]
- 67.Arber DA, et al. The 2016 revision to the World Health Organization (WHO) classification of myeloid neoplasms and acute leukemia. Blood. 2016;127:2391–2405. doi: 10.1182/blood-2016-03-643544. [DOI] [PubMed] [Google Scholar]
- 68.Chatterjee N, Shi J, García-Closas M. Developing and evaluating polygenic risk prediction models for stratified disease prevention. Nature Reviews Genetics. 2016;17:392–406. doi: 10.1038/nrg.2016.27. [DOI] [PMC free article] [PubMed] [Google Scholar]
- 69.Dumanski JP, et al. Smoking is associated with mosaic loss of chromosome Y. Science. 2015;347:81–83. doi: 10.1126/science.1262092. [DOI] [PMC free article] [PubMed] [Google Scholar]
Associated Data
This section collects any data citations, data availability statements, or supplementary materials included in this article.
Supplementary Materials
Data Availability Statement
Mosaic event calls are available in Supplementary Data. Access to the UK Biobank Resource is available via application (http://www.ukbiobank.ac.uk/). Approved researchers can obtain the SSC population dataset described in this study by applying at https://base.sfari.org.