

Abstract
OBJECTIVE
Human obesity is a complex metabolic disorder disproportionately affecting people of lower socioeconomic strata, and ethnic minorities, especially African Americans and Hispanics. Although genetic predisposition and a positive energy balance are implicated in obesity, these factors alone do not account for the excess prevalence of obesity in lower socioeconomic populations. Therefore, environmental factors, including exposure to pesticides, heavy metals, and other contaminants, are agents widely suspected to have obesogenic activity, and they also are spatially correlated with lower socioeconomic status. Our study investigates the causal relationship between exposure to the heavy metal, cadmium (Cd), and obesity in a cohort of children and in a zebrafish model of adipogenesis.
DESIGN
An extensive collection of first trimester maternal blood samples obtained as part of the Newborn Epigenetics Study (NEST) was analyzed for the presence of Cd, and these results were cross analyzed with the weight-gain trajectory of the children through age five years. Next, the role of Cd as a potential obesogen was analyzed in an in vivo zebrafish model.
RESULTS
Our analysis indicates that the presence of Cd in maternal blood during pregnancy is associated with increased risk of juvenile obesity in the offspring, independent of other variables, including lead (Pb) and smoking status. Our results are recapitulated in a zebrafish model, in which exposure to Cd at levels approximating those observed in the NEST study is associated with increased adiposity.
CONCLUSION
Our findings identify Cd as a potential human obesogen. Moreover, these observations are recapitulated in a zebrafish model, suggesting that the underlying mechanisms may be evolutionarily conserved, and that zebrafish may be a valuable model for uncovering pathways leading to Cd-mediated obesity in human populations.
INTRODUCTION
The prevalence of obesity has more than doubled among children and more than tripled among adolescents in the last 30 years [1, 2]. While obesity prevalence has plateaued overall in the last two years, the disparities in the prevalence of obesity in children of lower socioeconomic status (SES) and racial/ethnic minorities appear to be widening [3-5]. Genetic predisposition and energy imbalance, where caloric input exceeds energy output, are implicated in obesity; however, these factors alone cannot explain the disproportionate incidence of obesity in lower SES populations. The increased use of organic and inorganic chemicals for a wide range of applications in the last century has been paralleled by increases in the body burden of environmental pollutants, many of them endocrine disruptors. In animal models, in vitro and in humans, many of these chemicals have been associated with lipid accumulation and progressive cardiometabolic dysfunction. However, these data have been difficult to interpret and use to recommend public action, as the specificity of the associations between many of these chemicals and the cardiometabolic disease risk phenotype has not been demonstrated, and the doses of exposure in model systems are often at or above human occupational levels.
Cadmium (Cd) is a ubiquitous environmental contaminant ranked seventh on the list of toxicants of concern by the Agency for Toxic Substances and Disease Registry (ATSDR)[6]. Two to three decades leading up to the 1970s saw a rapid increase in the use of Cd in the manufacture of fertilizer and nickel-cadmium batteries, that paralleled an increase in blood Cd concentrations in the US population [7-10]. Major sources of human exposure include ingestion of foods contaminated with Cd, cigarette smoke, and breathing contaminated air in occupational settings or in neighborhoods near contaminated industrial facilities. The mechanisms by which Cd elicits toxicity are not entirely clear, although induction of oxidative stress has been implicated. Understanding the connection between exposure and Cd-mediated outcomes may be further complicated by its long half-life, estimated to be between 10 and 45 years, in the kidney, liver, lung and pancreas[11, 12]. Cd is a known human carcinogen and is associated with respiratory, renal, neurological, and bone disorders. In addition, some studies[13-15], including reviews[12, 16-18], but not others[19, 20] link lower levels of Cd to cardiovascular and metabolic diseases; however, these associations are limited to adults.
Epidemiological and animal studies over the past 15 years have demonstrated that in utero and neonatal environmental exposures alter programming of endocrine systems involved in growth, energy metabolism, adipogenesis, appetite, and glucose-insulin homeostasis of the developing fetus[21-25]. Cd exposure has been associated with lower birth weight[26-28], a phenomenon known to be a persistent risk factor for accelerated adiposity gain in young children, which has been linked to cardio-metabolic impairment in adulthood[29-35]. Exposures occurring during critical developmental windows have been shown to stably alter the function of target organ systems, and initiate processes that increase the risk of cardiometabolic diseases later in life[29, 36]. Currently cohort data linking low-level prenatal Cd exposure to cardiometabolic outcomes are limited and derive from studies with short follow-up[37-39]. Thus, it remains unclear whether early indications of metabolic dysfunction that have been associated with developmental exposure to Cd persist into middle childhood or adulthood. Furthermore, because prenatal Cd exposure also disproportionately affects lower SES strata, disentangling the contributions of Cd from competing risk factors including physical activity, dietary patterns, and other non-chemical stressors, has thus far not been possible[40]. Additional models are needed to isolate the effects of early developmental exposure to Cd on metabolic indicators.
Zebrafish (Danio rerio) is a powerful model system for toxicological research[41, 42]. Its genome is sequenced and its conservation with humans is facilitating mechanism-based understanding of chemical effects on diverse human conditions[43]. Its experimental strengths include its small size, high fecundity, availability of transgenic lines for live imaging of complex physiological processes, embryonic transparency, experimental tractability, and conserved but simplified anatomy[41, 42]. Zebrafish larvae and adults are semitransparent and offer unique opportunities to study the effects of environmental exposures on adipogenesis and metabolic function in vivo[44]. Adipose tissue is recognized as a dynamic endocrine organ that plays a critical role in regulating metabolic homeostasis[45], in addition to storing excess fat. Adipose tissue is first detected in zebrafish at about two weeks post-fertilization, embryonic and early larval stages are sensitive to compounds that modulate fat metabolism[44, 46-48]. The deposition and mobilization of lipid within zebrafish adipose tissue can be altered by nutritional manipulation, suggesting that energy storage functions of adipose tissue are conserved between zebrafish and mammals[49]. In addition, gene expression studies on unfractionated zebrafish adipose tissue show shared pathophysiologic pathways indicating that zebrafish studies involving adipogenesis and metabolic function may be directly translatable to humans[49, 50].
Here, we present human data linking prenatal Cd exposure to obesity in children at five years of age, and demonstrate that this effect is recapitulated in juvenile zebrafish exposed to Cd during the larval stage. Despite the likely presence of confounders in the human data, our findings in zebrafish, in which the exposure profile is strictly controlled, demonstrate for the first time that Cd may be a human obesogen, and that prenatal human exposure to Cd likely initiates a cascade of molecular events leading to increased adiposity.
MATERIALS AND METHODS
Study participants
Study participants were pregnant women enrolled in the Newborn Epigenetic STudy (NEST), a prospective cohort study of women and their offspring enrolled from 2009 to 2011 from six prenatal clinics in Durham County, North Carolina. Participant accrual procedures were previously described[51, 52]. Briefly, inclusion criteria were: age 18 years or older, pregnant, and intention to use one of two participating obstetric facilities in Durham County for delivery. Exclusions were: plans to relinquish custody of the index child, move states in the subsequent three years, or an established HIV infection. In the 18-months beginning April, 2009, 2,548 women were approached and 1,700 consented (66.7% response rate). The present analyses are limited to the first 319 infant-mother pairs in whom we measured first trimester blood Cd, arsenic (As) and lead (Pb). Maternal race, smoking status, BMI before pregnancy, parity, delivery route, and education were comparable in the 319 infant-mother pairs included in this study and the remainder of the cohort (p>0.05). The study protocol was approved by the Duke University Institutional Review Board.
Data and specimen collection
Participants completed a self- or interviewer-administered questionnaire at the time of enrollment that included social and demographic characteristics, reproductive history, lifestyle factors, and anthropometric measurements. At study enrollment, maternal peripheral blood samples were collected; the mean gestational age at maternal blood draw was 12 weeks. Blood aliquots were prepared and stored at −80°C.
Measurement of cadmium
Prenatal Cd blood levels were measured in whole blood as nanograms per gram (ng/g; 1000ng/g=1035ng/μl) using well-established solution-based ICP-MS methods[53-56]. Procedures were described previously[26]. Briefly, frozen maternal blood samples were equilibrated at room temperature, homogenized with a laboratory slow shaker (GlobalSpec, East Greenbrush, NY) and ~0.2 mL aliquots were pipetted into a trace-metal-clean test tube and verified gravimetrically to ±0.001mg using a calibrated mass balance. Samples were spiked with internal standards consisting of known quantities (10 and 1 ng/g, respectively) of indium (In) and bismuth (Bi) (SCP Science, USA), used to correct for instrument drift. The solutions were then diluted using water purified to 18.2 MΩ/cm resistance, hereinafter referred to as Milli-Q water (Millipore, Bedford, Mass., USA) and acidified using ultra-pure 12.4 mol/L hydrochloric acid to result in a final concentration of 2% hydrochloric acid (by volume). All standards, including aliquots of the certified NIST 955c, and procedural blanks were prepared by the same process.
Cd concentrations were measured using a Perkin Elmer DRC II (Dynamic Reaction Cell) axial field ICP-MS at the University of Massachusetts-Boston[53-56]. To clean sample lines and reduce memory effects, sample lines were sequentially washed using Milli-Q water for 90 seconds and a 2% nitric acid solution for 120 seconds between analyses. Procedural blanks were analyzed within each block of 10 samples, to monitor and correct for instrument and procedural backgrounds. Calibration standards used to determine metal in blood included aliquots of Milli-Q water, and NIST 955c SRM spiked with known quantities of each metal in a linear range from 0.025 to 10 ng/g. Standards were prepared from 1000 mg/L single element standards (SCP Science, USA). Method detection limits (MDLs) were calculated according to the two-step approach using the t99SLLMV method (USEPA, 1993) at 99% CI (t=3.71). The MDLs yielded values of 0.006, 0.005, and 0.071 μg/dL, for Cd, Pb, and As, respectively. Limits of detection (LOD) were 0.002, 0.002, and 0.022 μg/dL, for Cd, Pb and As, respectively, and limits of quantification (LOQ) (according to Long and Winefordner, 1983) were 0.0007, 0.0006, and 0.0073 μg/dL for Cd, Pb, and As, respectively. The number of samples below the LOD for Cd, Pb, and As were two, two, and one, respectively.
Statistical analyses
Childhood obesity at age five was defined by the weight-for-height z score (WHZ)[57]. Children with WHZ scores greater than 85% of their same sex peers at age five were classified as overweight/obese. Logistic regression was implemented to evaluate the association between childhood obesity and the concentration of Cd, adjusting for other co-occurring metals (Pb and As) in maternal blood, maternal smoking (never, quit during pregnancy, pregnant smoker), breastfeeding (over three months or less), and sex of child. To reduce bias related to episodic growth acceleration, we additionally adjusted for child weight trajectory from birth to 36 months. These growth trajectories were computed as growth curves for each child, and functional principal component analysis (FPCA) was implemented to summarize growth curves. In the final model the top three FPCs, which explain >95% of the variability in the original growth curves, were included as covariates in the regression model; modeling with the top two FPCs did not alter the conclusions and produced a modest decrease in accounting for variability (94%). Similar to PCA (which aims to extract orthogonal PCs that retain maximal amount of variation in the original variables by estimating the eigenvalues and eigenvectors of the sample variance-covariance matrix), FPCA aims to obtain orthogonal functional PCs that retain the maximal amount of variation in the original weight curves by estimating the eigenvalues and eigenfunctions of the sample variance-covariance function.
Zebrafish husbandry and embryo collection
Wildtype (AB) zebrafish were maintained in a zebrafish facility at NC State University according to standard protocols,[58] and in conformity with guidelines of the NC State Animal Care and Use Committee (ACUC), which also approved all animal experiments reported. Briefly, adults were maintained at 28.5° C and a 14/10-hour light/dark cycle, and fed a standard diet twice daily. Spawning took place at a ratio of three females to one male; embryos were collected every 30 minutes and scored for viability prior to use in downstream applications.
Radioassay to assess cadmium uptake by larval zebrafish
To assess total body concentrations of Cd in zebrafish, triplicate groups of zebrafish embryos (n=25/group) were exposed from four hours post-fertilization (hpf) to seven days post-fertilization (dpf) to 60 μg/L (60 parts per billion; ppb) Cd in the form of CdCl2 (Cd mass fraction: 0.613; 0.534 μM CdCl2) in 0.5× embryo media (E2), spiked with 109Cd as a tracer (1592 Bq μg−1). Solutions were replaced daily during the course of the experiment. Larval uptake of Cd was monitored daily beginning at three dpf by measuring radioactive decay corrected for background activity. Briefly, larvae were washed three times with five ml of Cd-free, non-radioactive 0.5× E2 media followed by transfer to clean scintillation vials in two mL of the final wash. An additional two mL of the final wash were transferred to a second clean scintillation vial to measure background activity. The radioactivity uptake was measured using a Wallac Wizard 1480 Gamma counter. All larval measurements had counting errors <5%.
Cadmium and lead exposure
Cohort: Although the sources of Cd are not known with certainty, we previously reported detecting Cd in soil samples collected from neighborhoods of pregnant women with elevated Cd blood levels, but not in water. However, the correlation between Cd concentrations in soil and blood were weak and not significant (King, 2015) suggesting other unmeasured sources such as house dust or ambient air may also contribute as sources. Zebrafish: Stock solutions of CdCl2 ([Cd], 99.99% purity; Sigma-Aldrich, MO) were made at 60 parts per million in Milli-Q water; stock solutions of Pb(II) acetate (Pb2(C3O2H)2; Sigma-Aldrich, MO) were made at 100 ppm in milliQ water. Zebrafish embryos were collected as described and exposed to 60 parts per billion (ppb) Cd or 100 ppb Pb in 0.5× embryo media[58] from four hpf to seven dpf at a density of 10 embryos/mL with daily replacement, and fed beginning at five dpf. After removal of Cd or Pb, larvae were raised for lipid content analysis at one and two months post-fertilization.
Lipid analysis
The vital dye, Nile red, was used to stain lipids in juvenile zebrafish (one and two months post-fertilization), which allows repeated analysis of the same individual to assess amount and location of lipid droplets over time[49]. A 1.25 mg/mL stock solution was made in acetone. Immediately before use, a working solution was made by diluting 10 μL of the stock solution into 25 mL of aquarium system water to provide a final concentration of 0.5 μg/mL. Live zebrafish were stained in the dark for 30 minutes at 28˚C[44, 49]. Fish were removed from the Nile red solution and anesthetized in aquarium system water containing 0.25 mg/mL phosphate buffered (pH 7) Tricaine-S (Western Chemical, Ferndale, WA).
Imaging and quantitative analysis
Nile red-stained zebrafish were imaged using a Leica MZ FLIII fluorescence stereomicroscope. Images were analyzed using Fiji[59]. Color thresholding was used to select Nile red-containing sections by setting the hue value at 20-50. Background fluorescence was removed by setting a minimum brightness threshold of 120. Remaining fluorescence was selected and analyzed using the measure tool[44, 60, 61]. To account for differences in body size, fluorescence was normalized by taking the ratio of fluorescence to the dorsal-ventral height at the point where the anal fin attaches anteriorly to the body [62].
RESULTS
Study subjects
The distributions of first trimester blood Cd concentrations were compared by social and demographic characteristics of the mother-child pairs (Table 1). The Cd geometric means were comparable to the U.S. population; however, our cohort included a geographically clustered group of women with blood Cd levels at or above reportable levels, and we have complied with the reporting requirements. African Americans comprised 35% of the study population while Whites, Hispanics and Others comprised 30%, 32% and 4%, respectively. Nearly two thirds were younger than 30 years; approximately half had at least a high school education level, and reported a household income of at least $25,000 per year. Seventy-three percent were married or living with a partner. Fifteen percent of mothers reported smoking during pregnancy and 55% were overweight, obese, or extremely obese (29%, 15%, or 11% respectively). The majority of offspring (89%) had a birth weight within normal range (2.5 to 4 kg) and 88% were born at term. Blood Cd and Pb concentrations did not vary by maternal age, obesity, gestational age at delivery, or by sex and birth weight of offspring. However, blood levels of these heavy metals were higher among infants born to African Americans, Asians and Hispanics compared to Whites (p=0.03), smokers (p=0.01), and those who were obese before pregnancy (p=0.02). These factors were considered as potential confounders.
Table 1.
Description of characteristics for study participants
| Category | N | Cadmium (ng/g) quantile: median [IQR*] | Lead (ng/g) quantile: median [IQR*] | |
|---|---|---|---|---|
| Maternal age (in years) | <30 | 182 | 0.1 [0, 0.2] | 1.6 [0, 3.5] |
| 30<35 | 76 | 0.1 [0, 0.2] | 1.5 [0.5, 2.8] | |
| 35+ | 56 | 0.1 [0, 0.1] | 2.0 [0.4, 5] | |
| Maternal educational levels | Less than high school or high school | 162 | 0.1 [0, 0.3] | 2.1 [0, 4.1] |
| College | 151 | 0.1 [0, 0.1] | 1.4 [0.4, 2.9] | |
| Graduate degree | 1 | 0.2 [0.2, 0.2] | 1.7 [1.7, 1.7] | |
| Ethnic composition | White | 96 | 0.1 [0, 0.1] | 1.3 [0.4, 2.4] |
| Black | 108 | 0.1 [0, 0.3] | 1.6 [0, 3.3] | |
| Hispanic | 98 | 0.1 [0, 0.2] | 2.2 [0, 4.9] | |
| Other | 12 | 0.1 [0, 0.2] | 2.7 [0.7, 5.3] | |
| Cigarette smoking | Never Smoked | 228 | 0.1 [0, 0.2] | 1.5 [0.4, 3.5] |
| Smoking during pregnancy | 46 | 0.3 [0, 0.4] | 1.7 [0, 3.2] | |
| Smoking prior to pregnancy only | 40 | 0.1 [0, 0.2] | 1.7 [0, 2.6] | |
IQR: interquartile range
Associations between first trimester cadmium and obesity
Maternal first trimester blood Cd concentrations were 0.3 ng/g of blood weight (IQR0.1-0.7), i.e. 0.03μg/dL, which is comparable to the US population[63]. Higher prenatal Cd levels were associated with higher obesity risk at five years of age (Table 2). The effect of Cd (β=3.18, se=1.30, p=0.014) was robust and corresponds to a ~25-fold increase in obesity odds at age five for every one ng/g increase in blood weight of Cd. These analyses were adjusted for prenatal cigarette smoking, blood concentrations of As and Pb, offspring sex, and breastfeeding, and the first three functional principal components of growth trajectories. Figure 1 also shows the increase in the magnitude of the adjusted associations between first trimester Cd exposure and obesity at each month with increasing age, until 30 months when it plateaus, indicating that Cd-associated obesity is likely sustained, at least in childhood. Furthermore, this pattern of association persisted among non-smokers when these analyses were repeated in the absence of the 10 smokers (β=3.55, se=2.00, p=0.077), and was independent of the persistent and monotonic relationship between growth trajectories and obesity observed in Figure 1. Additional adjustment for pre-pregnancy obesity did not alter these associations.
Table 2.
Adjusted regression coefficients for associations between cadmium exposure and obesity parameters, in children at age 4–5 years*.
| Parameter | Regression Coefficient | Std. Error | p-value |
|---|---|---|---|
| Intercept | 6.085 | 3.655 | 0.096 |
| Functional principal components for growth trajectories** | 1.323 | 2.846 | 0.004 |
| Functional principal components for growth trajectories | 1.396 | 1.500 | 0.352 |
| Prenatal blood Cd concentrations | 3.184 | 1.296 | 0.014 |
| Prenatal blood As concentrations | −18.466 | 9.396 | 0.049 |
| Prenatal blood Pb concentrations | −0.007 | 0.070 | 0.925 |
Model also adjusted for cigarette smoking, sex, and breastfeeding for at least 3 months.
Functional principal components summarize growth trajectories form birth to age 3 years and are mutually exclusive.
Figure 1. Effect of weight trajectory (via the first FPC) on obesity risk at age five.
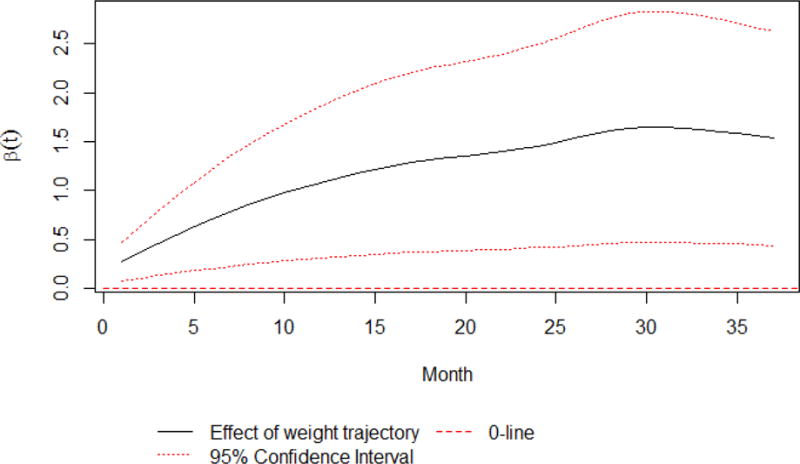
The solid line indicates the effect of child weight by month via the first FPC on obesity risk at age five; the flanking dashed lines represent the 95% simultaneous confidence band of the weight effect, accounting for multiple comparisons of all months; the dotted line indicates zero effects. The simultaneous confidence band lies above zero, indicating a significant, positive effect of child weight on obesity risk at age five. The solid line also suggests that the magnitude of the weight effect increases over time.
Cadmium uptake by larval zebrafish
Larval zebrafish began to accumulate measurable amounts of Cd from three dpf onward (Figure 2). The delay in Cd uptake correlated with the presence of the chorion, an embryonic membrane surrounding the developing embryo that typically ruptures at or about 48 hpf. Beginning at three dpf, Cd accumulation was approximately linear, and at seven dpf the total body burden of Cd reached 0.54 ng ± 0.1 ng/larvae. On average, a seven dpf larval zebrafish weighs 1.4 mg (wet weight)[64]; by extrapolation, this equates to 386 ng Cd per gram of larvae. Since Cd burden is commonly reported as a serum concentration, we used the Cd toxicokinetic model proposed by Kjellström and Nordberg[65] to estimate a larval serum concentration. This model estimates that 0.06% of the total body burden of Cd can be found in the serum; therefore, the calculated serum concentration per larvae is 0.23 ng/g, in agreement with the values observed in the NEST cohort.
Figure 2. Total cadmium uptake during zebrafish development.

Total internal Cd was measured as described after zebrafish embryos were exposed continuously from four hpf to seven dpf to Cd spiked with 109Cd. Measurements began at three dpf after hatching from the chorion, which provides a significant barrier to Cd uptake. Measurements are mean ± SEM.
Cadmium-induced juvenile lipid accumulation
Zebrafish undergo rapid development, with free-feeding larvae emerging after five dpf. However, a prolonged juvenile period of approximately three months follows, resulting in sexually mature adults at about 3-3.5 months post-fertilization. Based on the Cd uptake assay, we exposed zebrafish to 60 ppb Cd during embryonic/larval development (0-7 dpf), at which point their estimated Cd plasma burden is in agreement with values measured in the NEST cohort. The exposed fish had significantly increased lipid accumulation at one and two months post-exposure as seen in size-adjusted Nile red fluorescence following exposure from four hpf to one week post-fertilization (Figure 3, p < 0.05). This increase in Nile red fluorescence was not seen at 3.5 months post-fertilization (data not shown) at which point the Nile red fluorescence was significantly decreased in the Cd-exposed group vs controls (p < 0.01). These data indicate that limited (developmental) exposure to Cd results in increased lipid accumulation in juvenile zebrafish, which persists throughout the pre- and peri-pubertal stages but likely reverses at or before the onset of sexual maturity in the absence of continuous exposure. Unlike the results from Cd exposure, Pb at 100 ppb had no effect on adiposity (Supplemental Fig. 1).
Figure 3. Developmental exposure to cadmium increases lipid deposition in juvenile zebrafish.

Nile red fluorescence was significantly greater in zebrafish larvae exposed to 60 ppb Cd vs. water controls at one (A) and two (B) months post-fertilization (p<0.05). Representative live images of Nile red staining are shown for control (C, D) and Cd-exposed (E, F) zebrafish at one- and two-months post-fertilization, respectively.
DISCUSSION
Although genetic predisposition and energy imbalance, where energy input exceeds output, are established risk factors fueling the obesity epidemic in children, caloric excess and physical inactivity alone fail to fully account for the magnitude and the steep trajectory followed by the obesity epidemic[66]. A growing consensus suggests that exposure to some lipophilic or metalloid contaminants is obesogenic; the most studied are persistent organic compounds such as polychlorinated bisphenyls[67], and metalloids such as arsenic[68-71]. However, the obesogenic potential of ubiquitous inorganic metals, including Cd, is unclear.
We evaluated associations between prenatal Cd exposure and obesity in children, and determined the plausibility of this relationship in a controlled experimental zebrafish model. After adjusting for cigarette smoking, sex, breastfeeding and co-occurring metals (Pb and/or As), we found persistent associations between prenatal Cd exposure and increased risk of obesity from birth to age five years. Our data also suggest that these children were also more likely to have steeper growth trajectories between birth to age five years. In support of this association, we also found that zebrafish exposed developmentally to Cd at 60 ppb had estimated Cd plasma levels at seven dpf similar to those measured in the NEST cohort at term. Assuming human and zebrafish developmental landmarks scale with lifespan, the two time-points are developmentally similar stages. These fish went on to exhibit significantly higher lipid accumulation as juveniles, when compared to unexposed controls. Surprisingly, lipid accumulation plateaued at or near the onset of sexual maturity. Although similar data observations are suggested in human data, follow-up is short and sample sizes small as evidenced by the wide confidence intervals. However, if similar plateauing of obesity risk were replicated in larger studies, these findings would support the intriguing possibility that, without postnatal exposure, Cd-associated obesity may in fact be transient.
To our knowledge, our study represents the first direct measure of association between prenatal Cd exposure and increased obesity risk in children, the results of which are supported by similar findings in an evolutionarily related model organism. Whether Cd is measured in biological materials that reflect long term chronic exposure, such as toe nails or urine or in blood, reflecting shorter term, concurrent exposure, data linking elevated Cd levels to obesity related cardiometabolic diseases among adults are inconsistent[13-15],[12, 16-18],[19, 20]. However, in early life, exposure to Cd is consistently associated with lower birth weight[26, 27, 72-74], although the few studies that have examined the association between prenatal Cd and growth[74] found that maternal Cd was associated with lower head circumference, height and weight. Reasons for inconsistent findings are unclear although differences in exposure dose, i.e., circulating concentration, could be a factor, which may depend on the source of exposure. Cd doses that are ingested or inhaled from contaminated air or dust are likely higher than levels in contaminated grains, which form only a fraction of the total diet. Inconsistent findings could also be due to co-exposure to other metals, which together with Cd, may have antagonistic effects, e.g., selenium. Differences could also be due to inadequate control for confounding by socioeconomic status, which in turn may influence not only dietary factors but also residence in geographic locations of higher exposure[75]. In zebrafish exposed only to Cd, limited to the human-equivalent periconceptional and early prenatal period and the elimination of socioeconomic effects, Cd exposure was associated with lipid accumulation. Whether the plateauing effect is sustained into puberty and beyond is still unknown.
Mechanisms linking low dose Cd exposure and subclinical cardiometabolic dysfunction are unclear; however, single metal analysis in adults suggests that blood Cd below reportable levels of 0.5 μg/dL was associated with elevated glucose[76-80], higher blood pressure, presumably via kidney dysfunction [81, 82], and oxidative stress[83], which depletes antioxidants[84, 85]. In autopsy specimens, higher liver Cd levels were associated with hypertension[86]. In mice and in vitro, early Cd exposure increased inflammation, oxidative stress, and blood pressure, doubled adipocyte numbers[87], and lowered the expression of lipid synthesis genes[88]; thus obesity could result directly from this increased capacity for lipid storage. In these model systems, early Cd exposure also dysregulated the release of chemokines, leptin and adiponectin[87, 88] leading to insulin resistance later in life[89]. As these chemokines are involved in appetite regulation and energy expenditure[90-92], cardiometabolic dysfunction indicators may also result indirectly via altered satiety responsiveness and increased caloric intake. Disentangling these possibilities will be critical in the future, to guide intervention efforts aimed at reducing Cd-related cardiometabolic dysfunction.
A major strength of our study is the ability to demonstrate in humans and in zebrafish that Cd increases lipid accumulation, leading to obesity, and associations are free from the influence of co-exposure to other metals and socioeconomic factors. However, our study had a limited sample size as evidenced by the wide confidence bands. While the sample size was adequate to demonstrate significant associations in overall analyses, we were under-powered to examine sex differences in children; Cd exposure effects may vary by sex. In addition, although prospective, children were followed from birth to age five years, and without serial specimens, the effects of postnatal exposure could not be disentangled in children. However, zebrafish that were exposed only “prenatally” had significantly higher lipid accumulation that the unexposed controls, suggesting that postnatal exposure did not unduly influence our findings in children. Moreover, the extent to which Cd-related obesity will be maintained after age five years is unknown. Zebrafish that were followed until sexual maturity exhibited reduced lipid accumulation.
Despite these limitations, our data support the causal association between in utero exposure to Cd and obesity at age five years. Larger studies are required to confirm these findings and determine Cd effects vary by sex.
Supplementary Material
Acknowledgments
We thank participants of the NEST project. We also acknowledge Stacy Murray, Kennetra Irby, Siobhan Greene and Anna Tsent for recruiting NEST participants, Carole Grenier and Erin Erginer for technical assistance, Carson Lunsford for assistance with the zebrafish lipid assay, and David C. Cole for zebrafish husbandry. AJG was supported by the Ruth L. Kirschstein National Research Service Award Institutional Training grant number T32ES007046. This publication was supported in part by NIH under award numbers P30ES025128 (CH, CJM, AP) and R01ES016772 (CH), and by a generous donation from Howard and Julia Clark.
Footnotes
CONFLICTS OF INTEREST
Authors declare there are no competing financial interests in relation to the work described.
References
- 1.Ogden CL, Carroll MD, Kit BK, Flegal KM. Prevalence of childhood and adult obesity in the United States, 2011-2012. Jama. 2014;311(8):806–14. doi: 10.1001/jama.2014.732. Epub 2014/02/27. [DOI] [PMC free article] [PubMed] [Google Scholar]
- 2.National Center for Health Statistics. Health, United States, 2011: With Special Features on Socioeconomic Status and Health. Hyattsville, MD: U.S. Department of Health and Human Services; 2012. [PubMed] [Google Scholar]
- 3.Claire Wang Y, Gortmaker SL, Taveras EM. Trends and racial/ethnic disparities in severe obesity among US children and adolescents, 1976-2006. Int J Pediatr Obes. 2011;6(1):12–20. doi: 10.3109/17477161003587774. Epub 2010 Mar 17. [DOI] [PubMed] [Google Scholar]
- 4.Ogden CL, Carroll MD, Kit BK, Flegal KM. Prevalence of obesity and trends in body mass index among US children and adolescents, 1999-2010. JAMA. 2012;307(5):483–90. doi: 10.1001/jama.2012.40. Epub Jan 17. [DOI] [PMC free article] [PubMed] [Google Scholar]
- 5.Olds T, Maher C, Zumin S, Peneau S, Lioret S, Castetbon K, et al. Evidence that the prevalence of childhood overweight is plateauing: data from nine countries. Int J Pediatr Obes. 2011;6(5-6):342–60. doi: 10.3109/17477166.2011.605895. Epub 2011 Aug 12. [DOI] [PubMed] [Google Scholar]
- 6.ATSDR. Agency for Toxic Substances and Disease Registry. 2011 [cited 2014 28 Feburary]. Available from: http://www.atsdr.cdc.gov/
- 7.Albin M, Skerfving S. Pollutant levels at home and in food–low but dangerous. Lakartidningen. 2007;104(48):3659–63. Epub 2008/01/16. [PubMed] [Google Scholar]
- 8.Bergdahl IA. Another fundamental error in “What is the meaning of non-linear dose-response relationships between blood lead concentrations and IQ?” became obvious in the authors’ response to comments. Neurotoxicology. 2007;28(3):705–6. doi: 10.1016/j.neuro.2007.02.005. author reply 6. Epub 2007/04/03. [DOI] [PubMed] [Google Scholar]
- 9.Dietrich KN, Berger OG, Succop PA, Hammond PB, Bornschein RL. The developmental consequences of low to moderate prenatal and postnatal lead exposure: intellectual attainment in the Cincinnati Lead Study Cohort following school entry. Neurotoxicology and teratology. 1993;15(1):37–44. doi: 10.1016/0892-0362(93)90043-n. Epub 1993/01/01. [DOI] [PubMed] [Google Scholar]
- 10.Elliott P, Arnold R, Cockings S, Eaton N, Jarup L, Jones J, et al. Risk of mortality, cancer incidence, and stroke in a population potentially exposed to cadmium. Occup Environ Med. 2000;57(2):94–7. doi: 10.1136/oem.57.2.94. Epub 2000/03/11. [DOI] [PMC free article] [PubMed] [Google Scholar]
- 11.Lamas GA, Navas-Acien A, Mark DB, Lee KL. Heavy Metals, Cardiovascular Disease, and the Unexpected Benefits of Chelation Therapy. J Am Coll Cardiol. 2016;67(20):2411–8. doi: 10.1016/j.jacc.2016.02.066. Epub 2016/05/21. [DOI] [PMC free article] [PubMed] [Google Scholar]
- 12.Solenkova NV, Newman JD, Berger JS, Thurston G, Hochman JS, Lamas GA. Metal pollutants and cardiovascular disease: mechanisms and consequences of exposure. American heart journal. 2014;168(6):812–22. doi: 10.1016/j.ahj.2014.07.007. Epub 2014/12/03. [DOI] [PMC free article] [PubMed] [Google Scholar]
- 13.Li XT, Yu PF, Gao Y, Guo WH, Wang J, Liu X, et al. Association between Plasma Metal Levels and Diabetes Risk: a Case-control Study in China. Biomedical and environmental sciences: BES. 2017;30(7):482–91. doi: 10.3967/bes2017.064. Epub 2017/08/02. [DOI] [PubMed] [Google Scholar]
- 14.Tinkov AA, Filippini T, Ajsuvakova OP, Aaseth J, Gluhcheva YG, Ivanova JM, et al. The role of cadmium in obesity and diabetes. The Science of the total environment. 2017:601–602. 741–55. doi: 10.1016/j.scitotenv.2017.05.224. Epub 2017/06/04. [DOI] [PubMed] [Google Scholar]
- 15.Asgary S, Movahedian A, Keshvari M, Taleghani M, Sahebkar A, Sarrafzadegan N. Serum levels of lead, mercury and cadmium in relation to coronary artery disease in the elderly: A cross-sectional study. Chemosphere. 2017;180:540–4. doi: 10.1016/j.chemosphere.2017.03.069. Epub 2017/04/22. [DOI] [PubMed] [Google Scholar]
- 16.Pruss-Ustun A, Vickers C, Haefliger P, Bertollini R. Knowns and unknowns on burden of disease due to chemicals: a systematic review. Environmental health: a global access science source. 2011;10:9. doi: 10.1186/1476-069x-10-9. Epub 2011/01/25. [DOI] [PMC free article] [PubMed] [Google Scholar]
- 17.Pruss-Ustun A, Bonjour S, Corvalan C. The impact of the environment on health by country: a meta-synthesis. Environmental health: a global access science source. 2008;7:7. doi: 10.1186/1476-069x-7-7. Epub 2008/02/27. [DOI] [PMC free article] [PubMed] [Google Scholar]
- 18.Cosselman KE, Navas-Acien A, Kaufman JD. Environmental factors in cardiovascular disease. Nat Rev Cardiol. 2015;12(11):627–42. doi: 10.1038/nrcardio.2015.152. Epub 2015/10/16. [DOI] [PubMed] [Google Scholar]
- 19.Barregard L, Bergstrom G, Fagerberg B. Cadmium exposure in relation to insulin production, insulin sensitivity and type 2 diabetes: a cross-sectional and prospective study in women. Environ Res. 2013;121:104–9. doi: 10.1016/j.envres.2012.11.005. Epub 2012/12/25. [DOI] [PubMed] [Google Scholar]
- 20.Borne Y, Fagerberg B, Persson M, Sallsten G, Forsgard N, Hedblad B, et al. Cadmium exposure and incidence of diabetes mellitus–results from the Malmo Diet and Cancer study. PLoS One. 2014;9(11):e112277. doi: 10.1371/journal.pone.0112277. Epub 2014/11/14. [DOI] [PMC free article] [PubMed] [Google Scholar]
- 21.Krauss-Etschmann S, Bush A, Bellusci S, Brusselle GG, Dahlen SE, Dehmel S, et al. Of flies, mice and men: a systematic approach to understanding the early life origins of chronic lung disease. Thorax. 2013;68(4):380–4. doi: 10.1136/thoraxjnl-2012-201902. Epub 2012/07/12. [DOI] [PubMed] [Google Scholar]
- 22.Gluckman P, Hanson M, Beedle A. Early life events and their consequences for later disease: A life history and evolutionary perspective. Am J Hum Biol. 2007;19(1-19) doi: 10.1002/ajhb.20590. [DOI] [PubMed] [Google Scholar]
- 23.Lin X, Lim IY, Wu Y, Teh AL, Chen L, Aris IM, et al. Developmental pathways to adiposity begin before birth and are influenced by genotype, prenatal environment and epigenome. BMC medicine. 2017;15(1):50. doi: 10.1186/s12916-017-0800-1. Epub 2017/03/08. [DOI] [PMC free article] [PubMed] [Google Scholar]
- 24.Tomar AS, Tallapragada DS, Nongmaithem SS, Shrestha S, Yajnik CS, Chandak GR. Intrauterine Programming of Diabetes and Adiposity. Current obesity reports. 2015;4(4):418–28. doi: 10.1007/s13679-015-0175-6. Epub 2015/09/10. [DOI] [PubMed] [Google Scholar]
- 25.Dearden L, Ozanne SE. Early life origins of metabolic disease: Developmental programming of hypothalamic pathways controlling energy homeostasis. Frontiers in neuroendocrinology. 2015;39:3–16. doi: 10.1016/j.yfrne.2015.08.001. Epub 2015/08/25. [DOI] [PubMed] [Google Scholar]
- 26.Vidal AC, Semenova V, Darrah T, Vengosh A, Huang Z, King K, et al. Maternal cadmium, iron and zinc levels, DNA methylation and birth weight. BMC Pharmacol Toxicol. 2015;16(1):20. doi: 10.1186/s40360-015-0020-2. Epub 2015/07/16. [DOI] [PMC free article] [PubMed] [Google Scholar]
- 27.Johnston JE, Valentiner E, Maxson P, Miranda ML, Fry RC. Maternal cadmium levels during pregnancy associated with lower birth weight in infants in a North Carolina cohort. PLoS One. 2014;9(10):e109661. doi: 10.1371/journal.pone.0109661. Epub 2014/10/07. [DOI] [PMC free article] [PubMed] [Google Scholar]
- 28.Everson TM, Armstrong DA, Jackson BP, Green BB, Karagas MR, Marsit CJ. Maternal cadmium, placental PCDHAC1, and fetal development. Reproductive toxicology (Elmsford, NY. 2016;65:263–71. doi: 10.1016/j.reprotox.2016.08.011. Epub 2016/08/22. [DOI] [PMC free article] [PubMed] [Google Scholar]
- 29.Barker DJ. Developmental origins of adult health and disease. J Epidemiol Community Health. 2004;58(2):114–5. doi: 10.1136/jech.58.2.114. [DOI] [PMC free article] [PubMed] [Google Scholar]
- 30.Whincup PH, Kaye SJ, Owen CG, Huxley R, Cook DG, Anazawa S, et al. Birth weight and risk of type 2 diabetes: a systematic review. Jama. 2008;300(24):2886–97. doi: 10.1001/jama.2008.886. Epub 2008/12/26. [DOI] [PubMed] [Google Scholar]
- 31.Ezzahir N, Alberti C, Deghmoun S, Zaccaria I, Czernichow P, Levy-Marchal C, et al. Time course of catch-up in adiposity influences adult anthropometry in individuals who were born small for gestational age. Pediatric research. 2005;58(2):243–7. doi: 10.1203/01.pdr.0000169980.35179.89. Epub 2005/08/02. [DOI] [PubMed] [Google Scholar]
- 32.Meas T, Deghmoun S, Armoogum P, Alberti C, Levy-Marchal C. Consequences of being born small for gestational age on body composition: an 8-year follow-up study. The Journal of clinical endocrinology and metabolism. 2008;93(10):3804–9. doi: 10.1210/jc.2008-0488. Epub 2008/07/17. [DOI] [PMC free article] [PubMed] [Google Scholar]
- 33.Howe LD, Tilling K, Benfield L, Logue J, Sattar N, Ness AR, et al. Changes in ponderal index and body mass index across childhood and their associations with fat mass and cardiovascular risk factors at age 15. PloS one. 2010;5(12):e15186. doi: 10.1371/journal.pone.0015186. Epub 2010/12/21. [DOI] [PMC free article] [PubMed] [Google Scholar]
- 34.Anderson EL, Howe LD, Fraser A, Callaway MP, Sattar N, Day C, et al. Weight trajectories through infancy and childhood and risk of non-alcoholic fatty liver disease in adolescence: the ALSPAC study. Journal of hepatology. 2014;61(3):626–32. doi: 10.1016/j.jhep.2014.04.018. Epub 2014/04/29. [DOI] [PMC free article] [PubMed] [Google Scholar]
- 35.de Kroon ML, Renders CM, van Wouwe JP, van Buuren S, Hirasing RA. The Terneuzen Birth Cohort: BMI change between 2 and 6 years is most predictive of adult cardiometabolic risk. PloS one. 2010;5(11):e13966. doi: 10.1371/journal.pone.0013966. Epub 2010/11/26. [DOI] [PMC free article] [PubMed] [Google Scholar]
- 36.Barker DJ. The developmental origins of adult disease. J Am Coll Nutr. 2004;23(6 Suppl):588S–95S. doi: 10.1080/07315724.2004.10719428. [DOI] [PubMed] [Google Scholar]
- 37.Nye MD, K K, Darrah TH, Maguire RL, Jima DD, Huang Z, Mendez MA, Fry RC, Jirtle RL, Murphy SK, Hoyo C. Maternal Blood Lead Concentrations, DNA Methylation of MEG3 DMR Imprinted Domain and Early Growth in a Multiethnic Cohort. Environmental Epigenomics. 2016 doi: 10.1093/eep/dvv009. in press. [DOI] [PMC free article] [PubMed] [Google Scholar]
- 38.Cassidy-Bushrow AE, Havstad S, Basu N, Ownby DR, Park SK, Johnson CC, et al. Detectable Blood Lead Level and Body Size in Early Childhood. Biol Trace Elem Res. 2016;171(1):41–7. doi: 10.1007/s12011-015-0500-7. Epub 2015/09/12. [DOI] [PMC free article] [PubMed] [Google Scholar]
- 39.Kim R, Hu H, Rotnitzky A, Bellinger D, Needleman H. A longitudinal study of chronic lead exposure and physical growth in Boston children. Environmental health perspectives. 1995;103(10):952–7. doi: 10.1289/ehp.95103952. Epub 1995/10/01. [DOI] [PMC free article] [PubMed] [Google Scholar]
- 40.Tyrrell J, Melzer D, Henley W, Galloway TS, Osborne NJ. Associations between socioeconomic status and environmental toxicant concentrations in adults in the USA: NHANES 2001-2010. Environment international. 2013;59:328–35. doi: 10.1016/j.envint.2013.06.017. Epub 2013/07/31. [DOI] [PubMed] [Google Scholar]
- 41.Cheng KC, Hinton DE, Mattingly CJ, Planchart A. Aquatic models, genomics and chemical risk management. Comparative biochemistry and physiology Toxicology & pharmacology: CBP. 2012;155(1):169–73. doi: 10.1016/j.cbpc.2011.06.009. [DOI] [PMC free article] [PubMed] [Google Scholar]
- 42.Planchart A, Mattingly CJ, Allen D, Ceger P, Casey W, Hinton D, et al. Advancing toxicology research using in vivo high throughput toxicology with small fish models. ALTEX. 2016 doi: 10.14573/altex.1601281. [DOI] [PMC free article] [PubMed] [Google Scholar]
- 43.Planchart A, Mattingly CJ, Allen D, Ceger P, Casey W, Hinton D, et al. Advancing toxicology research using in vivo high throughput toxicology with small fish models. Altex. 2016;33(4):435–52. doi: 10.14573/altex.1601281. Epub 2016/11/04. [DOI] [PMC free article] [PubMed] [Google Scholar]
- 44.Tingaud-Sequeira A, Ouadah N, Babin PJ. Zebrafish obesogenic test: a tool for screening molecules that target adiposity. Journal of lipid research. 2011;52(9):1765–72. doi: 10.1194/jlr.D017012. Epub 2011/07/05. [DOI] [PMC free article] [PubMed] [Google Scholar]
- 45.Coelho M, Oliveira T, Fernandes R. Biochemistry of adipose tissue: an endocrine organ. Archives of medical science: AMS. 2013;9(2):191–200. doi: 10.5114/aoms.2013.33181. Epub 2013/05/15. [DOI] [PMC free article] [PubMed] [Google Scholar]
- 46.Jones KS, Alimov AP, Rilo HL, Jandacek RJ, Woollett LA, Penberthy WT. A high throughput live transparent animal bioassay to identify non-toxic small molecules or genes that regulate vertebrate fat metabolism for obesity drug development. Nutrition & metabolism. 2008;5:23. doi: 10.1186/1743-7075-5-23. Epub 2008/08/30. [DOI] [PMC free article] [PubMed] [Google Scholar]
- 47.Imrie D, Sadler KC. White adipose tissue development in zebrafish is regulated by both developmental time and fish size. Developmental dynamics: an official publication of the American Association of Anatomists. 2010;239(11):3013–23. doi: 10.1002/dvdy.22443. Epub 2010/10/07. [DOI] [PMC free article] [PubMed] [Google Scholar]
- 48.Elo B, Villano CM, Govorko D, White LA. Larval zebrafish as a model for glucose metabolism: expression of phosphoenolpyruvate carboxykinase as a marker for exposure to anti-diabetic compounds. Journal of molecular endocrinology. 2007;38(4):433–40. doi: 10.1677/jme-06-0037. Epub 2007/04/21. [DOI] [PubMed] [Google Scholar]
- 49.Minchin JE, Rawls JF. In vivo analysis of white adipose tissue in zebrafish. Methods in cell biology. 2011;105:63–86. doi: 10.1016/b978-0-12-381320-6.00003-5. Epub 2011/09/29. [DOI] [PMC free article] [PubMed] [Google Scholar]
- 50.Seth A, Stemple DL, Barroso I. The emerging use of zebrafish to model metabolic disease. Dis Model Mech. 2013;6(5):1080–8. doi: 10.1242/dmm.011346. Epub 2013/09/21. [DOI] [PMC free article] [PubMed] [Google Scholar]
- 51.Liu Y, Murphy SK, Murtha AP, Fuemmeler BF, Schildkraut J, Huang Z, et al. Depression in pregnancy, infant birth weight and DNA methylation of imprint regulatory elements. Epigenetics. 2012;7(7):735–46. doi: 10.4161/epi.20734. Epub 2012/06/09. [DOI] [PMC free article] [PubMed] [Google Scholar]
- 52.Vidal AC, Murphy SK, Murtha AP, Schildkraut JM, Soubry A, Huang Z, et al. Associations between antibiotic exposure during pregnancy, birth weight and aberrant methylation at imprinted genes among offspring. International journal of obesity (2005) 2013 doi: 10.1038/ijo.2013.47. Epub 2013/04/24. [DOI] [PMC free article] [PubMed] [Google Scholar]
- 53.Darrah TH, Prutsman-Pfeiffer JJ, Poreda RJ, Ellen Campbell M, Hauschka PV, Hannigan RE. Incorporation of excess gadolinium into human bone from medical contrast agents. Metallomics. 2009;1(6):479–88. doi: 10.1039/b905145g. Epub 2009/11/01. [DOI] [PubMed] [Google Scholar]
- 54.DeLoid G, Cohen JM, Darrah T, Derk R, Rojanasakul L, Pyrgiotakis G, et al. Estimating the effective density of engineered nanomaterials for in vitro dosimetry. Nature communications. 2014;5:3514. doi: 10.1038/ncomms4514. Epub 2014/03/29. [DOI] [PMC free article] [PubMed] [Google Scholar]
- 55.McLaughlin MP, Darrah TH, Holland PL. Palladium(II) and platinum(II) bind strongly to an engineered blue copper protein. Inorg Chem. 2011;50(22):11294–6. doi: 10.1021/ic2017648. Epub 2011/10/27. [DOI] [PMC free article] [PubMed] [Google Scholar]
- 56.Sprauten M, Darrah TH, Peterson DR, Campbell ME, Hannigan RE, Cvancarova M, et al. Impact of long-term serum platinum concentrations on neuro- and ototoxicity in Cisplatin-treated survivors of testicular cancer. J Clin Oncol. 2012;30(3):300–7. doi: 10.1200/jco.2011.37.4025. Epub 2011/12/21. [DOI] [PMC free article] [PubMed] [Google Scholar]
- 57.Kuczmarski RJ, Ogden CL, Guo SS, Grummer-Strawn LM, Flegal KM, Mei Z, et al. CDC Growth Charts for the United States: methods and development. Vital and health statistics Series 11, Data from the national health survey. 2000;2002(246):1–190. Epub 2002/06/05. [PubMed] [Google Scholar]
- 58.Westerfield M. A Guide for the Laboratory Use of Zebrafish (Danio Rerio) 4th. Eugene: Univ. of Oregon Press; 2000. The Zebrafish Book. [Google Scholar]
- 59.Schindelin J, Arganda-Carreras I, Frise E, Kaynig V, Longair M, Pietzsch T, et al. Fiji: an open-source platform for biological-image analysis. Nature methods. 2012;9(7):676–82. doi: 10.1038/nmeth.2019. Epub 2012/06/30. [DOI] [PMC free article] [PubMed] [Google Scholar]
- 60.Jensen EC. Quantitative analysis of histological staining and fluorescence using ImageJ. Anatomical record (Hoboken, NJ: 2007) 2013;296(3):378–81. doi: 10.1002/ar.22641. Epub 2013/02/06. [DOI] [PubMed] [Google Scholar]
- 61.Raldua D, Babin PJ. Simple, rapid zebrafish larva bioassay for assessing the potential of chemical pollutants and drugs to disrupt thyroid gland function. Environ Sci Technol. 2009;43(17):6844–50. doi: 10.1021/es9012454. Epub 2009/09/22. [DOI] [PubMed] [Google Scholar]
- 62.Parichy DM, Elizondo MR, Mills MG, Gordon TN, Engeszer RE. Normal table of postembryonic zebrafish development: staging by externally visible anatomy of the living fish. Developmental dynamics: an official publication of the American Association of Anatomists. 2009;238(12):2975–3015. doi: 10.1002/dvdy.22113. Epub 2009/11/06. [DOI] [PMC free article] [PubMed] [Google Scholar]
- 63.Luo Y, McCullough LE, Tzeng JY, Darrah T, Vengosh A, Maguire RL, et al. Maternal blood cadmium, lead and arsenic levels, nutrient combinations, and offspring birthweight. BMC Public Health. 2017;17(1):354. doi: 10.1186/s12889-017-4225-8. Epub 2017/04/26. [DOI] [PMC free article] [PubMed] [Google Scholar]
- 64.Hu N, Sedmera D, Yost HJ, Clark EB. Structure and function of the developing zebrafish heart. Anat Rec. 2000;260(2):148–57. doi: 10.1002/1097-0185(20001001)260:2<148::AID-AR50>3.0.CO;2-X. Epub 2000/09/20. [DOI] [PubMed] [Google Scholar]
- 65.Kjellstrom T, Nordberg GF. A kinetic model of cadmium metabolism in the human being. Environ Res. 1978;16(1-3):248–69. doi: 10.1016/0013-9351(78)90160-3. Epub 1978/07/01. [DOI] [PubMed] [Google Scholar]
- 66.Heindel JJ, Vandenberg LN. Developmental origins of health and disease: a paradigm for understanding disease cause and prevention. Curr Opin Pediatr. 2015;27(2):248–53. doi: 10.1097/mop.0000000000000191. Epub 2015/01/31. [DOI] [PMC free article] [PubMed] [Google Scholar]
- 67.Heindel JJ, Newbold R, Schug TT. Endocrine disruptors and obesity. Nature reviews Endocrinology. 2015;11(11):653–61. doi: 10.1038/nrendo.2015.163. Epub 2015/09/24. [DOI] [PubMed] [Google Scholar]
- 68.Agay-Shay K, Martinez D, Valvi D, Garcia-Esteban R, Basagana X, Robinson O, et al. Exposure to Endocrine-Disrupting Chemicals during Pregnancy and Weight at 7 Years of Age: A Multi-pollutant Approach. Environmental health perspectives. 2015;123(10):1030–7. doi: 10.1289/ehp.1409049. Epub 2015/05/09. [DOI] [PMC free article] [PubMed] [Google Scholar]
- 69.Lin HC, Huang YK, Shiue HS, Chen LS, Choy CS, Huang SR, et al. Arsenic methylation capacity and obesity are associated with insulin resistance in obese children and adolescents. Food and chemical toxicology: an international journal published for the British Industrial Biological Research Association. 2014;74:60–7. doi: 10.1016/j.fct.2014.08.018. Epub 2014/09/23. [DOI] [PubMed] [Google Scholar]
- 70.Rodriguez-Hernandez A, Camacho M, Henriquez-Hernandez LA, Boada LD, Ruiz-Suarez N, Valeron PF, et al. Assessment of human health hazards associated with the dietary exposure to organic and inorganic contaminants through the consumption of fishery products in Spain. The Science of the total environment. 2016;557-558:808–18. doi: 10.1016/j.scitotenv.2016.03.035. Epub 2016/04/10. [DOI] [PubMed] [Google Scholar]
- 71.Su CT, Lin HC, Choy CS, Huang YK, Huang SR, Hsueh YM. The relationship between obesity, insulin and arsenic methylation capability in Taiwan adolescents. The Science of the total environment. 2012;414:152–8. doi: 10.1016/j.scitotenv.2011.10.023. Epub 2011/11/23. [DOI] [PubMed] [Google Scholar]
- 72.Menai M, Heude B, Slama R, Forhan A, Sahuquillo J, Charles MA, et al. Association between maternal blood cadmium during pregnancy and birth weight and the risk of fetal growth restriction: the EDEN mother-child cohort study. Reproductive toxicology (Elmsford, NY) 2012;34(4):622–7. doi: 10.1016/j.reprotox.2012.09.002. Epub 2012/09/29. [DOI] [PubMed] [Google Scholar]
- 73.Kippler M, Tofail F, Gardner R, Rahman A, Hamadani JD, Bottai M, et al. Maternal cadmium exposure during pregnancy and size at birth: a prospective cohort study. Environmental health perspectives. 2012;120(2):284–9. doi: 10.1289/ehp.1103711. Epub 2011/08/25. [DOI] [PMC free article] [PubMed] [Google Scholar]
- 74.Lin CM, Doyle P, Wang D, Hwang YH, Chen PC. Does prenatal cadmium exposure affect fetal and child growth? Occup Environ Med. 2011;68(9):641–6. doi: 10.1136/oem.2010.059758. Epub 2010/12/28. [DOI] [PubMed] [Google Scholar]
- 75.King KE, Darrah TH, Money E, Meentemeyer R, Maguire RL, Nye MD, et al. Geographic clustering of elevated blood heavy metal levels in pregnant women. BMC Public Health. 2015;15(1):1035. doi: 10.1186/s12889-015-2379-9. Epub 2015/10/10. [DOI] [PMC free article] [PubMed] [Google Scholar]
- 76.Gallagher CM, Meliker JR. Blood and urine cadmium, blood pressure, and hypertension: a systematic review and meta-analysis. Environmental health perspectives. 2010;118(12):1676–84. doi: 10.1289/ehp.1002077. [DOI] [PMC free article] [PubMed] [Google Scholar]
- 77.Wallia A, Allen NB, Badon S, El Muayed M. Association between urinary cadmium levels and prediabetes in the NHANES 2005-2010 population. International journal of hygiene and environmental health. 2014;217(8):854–60. doi: 10.1016/j.ijheh.2014.06.005. [DOI] [PMC free article] [PubMed] [Google Scholar]
- 78.Tellez-Plaza M, Jones MR, Dominguez-Lucas A, Guallar E, Navas-Acien A. Cadmium exposure and clinical cardiovascular disease: a systematic review. Current atherosclerosis reports. 2013;15(10):356. doi: 10.1007/s11883-013-0356-2. Epub 2013/08/21. [DOI] [PMC free article] [PubMed] [Google Scholar]
- 79.Kuo CC, Moon K, Thayer KA, Navas-Acien A. Environmental chemicals and type 2 diabetes: an updated systematic review of the epidemiologic evidence. Current diabetes reports. 2013;13(6):831–49. doi: 10.1007/s11892-013-0432-6. Epub 2013/10/12. [DOI] [PMC free article] [PubMed] [Google Scholar]
- 80.Schober SE, Mirel LB, Graubard BI, Brody DJ, Flegal KM. Blood lead levels and death from all causes, cardiovascular disease, and cancer: results from the NHANES III mortality study. Environmental health perspectives. 2006;114(10):1538–41. doi: 10.1289/ehp.9123. Epub 2006/10/13. [DOI] [PMC free article] [PubMed] [Google Scholar]
- 81.Huang M, Choi SJ, Kim DW, Kim NY, Bae HS, Yu SD, et al. Evaluation of factors associated with cadmium exposure and kidney function in the general population. Environ Toxicol. 2013;28(10):563–70. doi: 10.1002/tox.20750. Epub 2011/07/26. [DOI] [PubMed] [Google Scholar]
- 82.Liang Y, Lei L, Nilsson J, Li H, Nordberg M, Bernard A, et al. Renal function after reduction in cadmium exposure: an 8-year follow-up of residents in cadmium-polluted areas. Environmental health perspectives. 2012;120(2):223–8. doi: 10.1289/ehp.1103699. Epub 2011/10/27. [DOI] [PMC free article] [PubMed] [Google Scholar]
- 83.Messner B, Turkcan A, Ploner C, Laufer G, Bernhard D. Cadmium overkill: autophagy, apoptosis and necrosis signalling in endothelial cells exposed to cadmium. Cell Mol Life Sci. 2016;73(8):1699–713. doi: 10.1007/s00018-015-2094-9. Epub 2015/11/22. [DOI] [PMC free article] [PubMed] [Google Scholar]
- 84.Li KG, Chen JT, Bai SS, Wen X, Song SY, Yu Q, et al. Intracellular oxidative stress and cadmium ions release induce cytotoxicity of unmodified cadmium sulfide quantum dots. Toxicol In Vitro. 2009;23(6):1007–13. doi: 10.1016/j.tiv.2009.06.020. Epub 2009/06/23. [DOI] [PubMed] [Google Scholar]
- 85.Stohs SJ, Bagchi D. Oxidative mechanisms in the toxicity of metal ions. Free Radic Biol Med. 1995;18(2):321–36. doi: 10.1016/0891-5849(94)00159-h. Epub 1995/02/01. [DOI] [PubMed] [Google Scholar]
- 86.Baker JR, Satarug S, Urbenjapol S, Edwards RJ, Williams DJ, Moore MR, et al. Associations between human liver and kidney cadmium content and immunochemically detected CYP4A11 apoprotein. Biochemical pharmacology. 2002;63(4):693–6. doi: 10.1016/s0006-2952(01)00905-4. Epub 2002/05/07. [DOI] [PubMed] [Google Scholar]
- 87.Beier EE, Maher JR, Sheu TJ, Cory-Slechta DA, Berger AJ, Zuscik MJ, et al. Heavy metal lead exposure, osteoporotic-like phenotype in an animal model, and depression of Wnt signaling. Environmental health perspectives. 2013;121(1):97–104. doi: 10.1289/ehp.1205374. Epub 2012/10/23. [DOI] [PMC free article] [PubMed] [Google Scholar]
- 88.Kawakami T, Sugimoto H, Furuichi R, Kadota Y, Inoue M, Setsu K, et al. Cadmium reduces adipocyte size and expression levels of adiponectin and Peg1/Mest in adipose tissue. Toxicology. 2010;267(1-3):20–6. doi: 10.1016/j.tox.2009.07.022. Epub 2009/08/12. [DOI] [PubMed] [Google Scholar]
- 89.Faulk C, Barks A, Sanchez BN, Zhang Z, Anderson OS, Peterson KE, et al. Perinatal Lead (Pb) Exposure Results in Sex-Specific Effects on Food Intake, Fat, Weight, and Insulin Response across the Murine Life-Course. PLoS One. 2014;9(8):e104273. doi: 10.1371/journal.pone.0104273. Epub 2014/08/12. [DOI] [PMC free article] [PubMed] [Google Scholar]
- 90.Iikuni N, Lam QL, Lu L, Matarese G, La Cava A. Leptin and Inflammation. Curr Immunol Rev. 2008;4(2):70–9. doi: 10.2174/157339508784325046. Epub 2008/05/01. [DOI] [PMC free article] [PubMed] [Google Scholar]
- 91.La Cava A, Matarese G. The weight of leptin in immunity. Nat Rev Immunol. 2004;4(5):371–9. doi: 10.1038/nri1350. Epub 2004/05/04. [DOI] [PubMed] [Google Scholar]
- 92.Matarese G, La Cava A. The intricate interface between immune system and metabolism. Trends Immunol. 2004;25(4):193–200. doi: 10.1016/j.it.2004.02.009. Epub 2004/03/25. [DOI] [PubMed] [Google Scholar]
Associated Data
This section collects any data citations, data availability statements, or supplementary materials included in this article.