

Abstract
Water inrushes from coal-roof strata account for a great proportion of coal mine accidents, and the height of fractured water-conducting zone (FWCZ) is of significant importance for the safe production of coal mines. A novel and promising model for predicting the height of FWCZ was proposed based on random forest regression (RFR), which is a powerful intelligent machine learning algorithm. RFR has high prediction accuracy and is robust in dealing with the complicated and non-linear problems. Also, it can evaluate the importance of the variables. In this study, the proposed model was applied to Hongliu Coal Mine in Northwest China. 85 field measured samples were collected in total, with 60 samples (70%) used for training and 20 (30%) used for validation. For comparison, a support vector machine (SVM) model was also constructed for the prediction. The results show that the two models are in accordance with the field measured data, and RFR shows a better performance on good tolerance to outliers and noises and efficiently on high-dimensional data sets. It is demonstrated that RFR is more practicable and accurate to predict the height of FWCZ. The achievements will be helpful in preventing and controlling the water inrushes from coal-roof strata, and also can be extended to various engineering applications.
Introduction
In mining activities, mine water has always been a great threat to the coal mine safety. According to statistics, more than 25 billion tons of coal resources are at the risk of water inrushes in China1. With increased mining depths in recent years, the hydrogeological conditions of mining become more and more complicated, and the water inrushes from coal-roof strata are increasingly serious2,3. During coal extraction, the strata overlying the coal seams move significantly downward due to the rock pressure, forming multiple fractures and fissures in the coal-roof strata. Once these fractures are interconnected and the impermeability of aquitards is destroyed, various kinds of water bodies from coal-roof strata, including surface water, goaf water and aquifer water, will flow into the mining area through the fractures, resulting in water-inrush accidents. The accidents may cause tremendous loss of life and property. Therefore, in order to effectively prevent water inrushes and ensure the safe production of the coal mines, it is essential to accurately predict the height of fractured water-conducting zone (FWCZ) of coal-roof strata.
Aiming at the prediction of the height of FWCZ, scholars proposed many methods, including empirical formula method, field measured method, theoretical calculation, numerical simulation and so on4–12. In the early 1980s, Liu4 proposed an empirical formula by the regression analysis of the limited field measured data collected from several large-scale coalmines in North China. But the formula only considers a few factors so that it is unable to precisely reflect the complicated development mechanism of the water-conducting fractures. For this problem, Hu5 summarized the nonlinear statistical relation between the FWCZ and multiple mining factors including mining height, hard-rock lithology ratio, working face length, mining depth and so on. Shi6 analyzed the movement characteristics of the overlying strata and the division theory of the “four zones” in overlying strata, then proposed theoretical formulas considering multiple mining factors. To ensure the mining safety of shallow coal seams under water-rich aquifers and determine the development of the fractured water-conducting zone, Liu7 built a numerical model to analyze the damage zone distribution in Flac3D model. Furthermore, the mathematical theories were gradually adopted in this field. For instance, Yang8 used the analytic hierarchy process and the fuzzy cluster analysis method to predict the height of FWCZ. Generally, the theoretical calculation model and the numerical simulation have the problems of over idealization and the difficult selection of the mechanical parameters. Meanwhile, the methods were also combined to determine the height of FWCZ. Based on the traditional empirical formula, the crack-measure system and the borehole television detecting system, Gao9 developed the theoretical calculation, quantitative analysis and detection of the FWCZ of coal-roof strata. At present, the most effective method is the field measurement by using borehole video camera system, water injection system and other direct monitoring equipment. However, these systems require large quantities of engineering with enormous expenses.
In recent years, with the rapid development of artificial intelligence technologies, the application of machine learning algorithms (MLAs), such as decision tree (DT), support vector machine (SVM), artificial neural network (ANN) and so on, to predicting the height of FWCZ has gradually been a trend13–17. For example, Sun13 proposed a synthetic calculation system that coupled genetic algorithm (GA) and support vector regression (SVR). This system reflected the relationship between the height of FWCZ and the mining factors effectively. Wu14 presented a radial basis function neural networks (RBFNN) model to predict the height of FWCZ for fully mechanized longwall mining with sublevel caving. However, these MLAs also have certain limitations in practical applications. For instance, numerous data pre-treatment is required in the DT model, and it tends to fall into local optimum; as for the ANN model, it has the shortcomings of over learning, slow convergence speed and local minimum value2.
Considering all the aforementioned problems, this paper proposed a predicting model of the height of FWCZ based on random forest regression (RFR), which is a non-parametric regression approach introduced by Breiman18 in 2001. RFR is a nonlinear modeling tool, coupling the main advantages of two major learning techniques: bagging and random feature selection18. It is suitable for the problems with unclear priori knowledge and incomplete data. Further, unlike simple DTs and neural networks (NNs), RFR runs efficiently on high-dimensional data sets. But if there are a lot of irrelevant variables, the DTs does not perform well. The objective of decision tree is to find the interaction between variables, and the weakness of the neural network is its inability to explain its reasoning process and reasoning basis18. Compared with the traditional intelligence algorithms, such as ANN and SVM, RFR has high prediction accuracy and good tolerance to outliers and noises18,19. Because of its superior performance, RFR has been widely applied to various fields such as biology, medicine, economics, management, remote sensing and other fields in recent years19–25. RBFNN has strong nonlinear fitting ability, it can map any complex nonlinear relation, and its learning rule is simple, which is easy to realize by computer. However, the theory and learning algorithm need to be further improved26–29. The group method of data handling (GMDH)-type neural network does not need the preset network structure, and the classification rules are expressed by some simple polynomials. However, the GMDH training algorithm can obtain good results only in the case that the noise and interference are distributed by Gaussian, otherwise, the training algorithm often overfits the network30,31. In the current study, RFR was used to predict the height of FWCZ. To verify the effectiveness of the generated RFR model, it was applied to Hongliu Coal Mine in Northwest China. Also, a SVM model was constructed for comparison. The results indicate that the RFR model has a better performance, and the prediction results are in good accordance with the field measured data observed using borehole video camera system (BVCS).
Material and Methods
Study area
The Hongliu Coal Mine is situated in the middle east of the Ningxia Hui Autonomous Region in Northwest China, approximately 80 km northwest of Yinchuan City (Fig. 1). The mine is distributed in the NW-SE direction, and it has an area of 79.55 km2 with a length of 15 km and a width of 5.5 km. The general elevation is approximately 1400 m above sea level. Topographically, the mine is located in the west of Mu Us Desert, and the landform in the study area is classified as hilly terrain. It has a semiarid-desert continental-monsoon climate with a mean annual precipitation of 216.3 mm.
Figure 1.
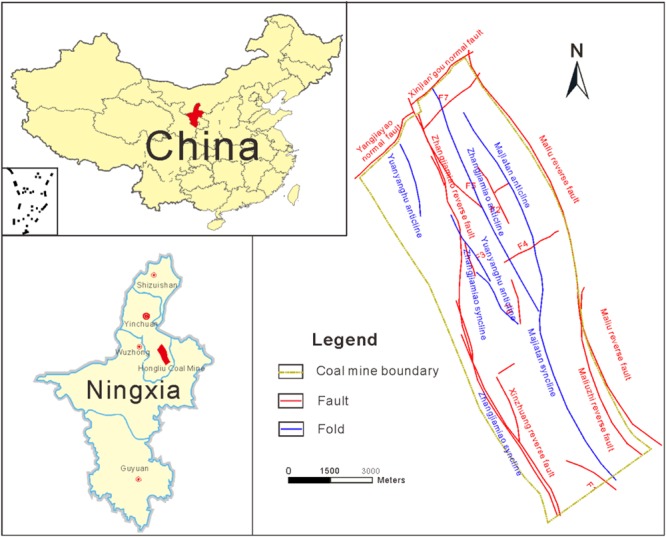
Location of the study area and geological structure map.
Most areas of the mine are covered by aeolian sand of Quaternary, except that sporadic bedrocks are exposed in certain local regions in the southwest of the mine field. According to drilling data, the main strata include: Shangtian Formation of Upper Triassic, Yan’an Formation of Medium Jurassic, An’ding Formation of Upper Jurassic, Qingshuiying Formation of Paleogene (Oligocene) and Quaternary.
Hydrogeologically, aquifers in the mine area can be divided into five groups according to the type of aquifer media and void: Quaternary loose alluvial pore aquifer group; Cretaceous rock pore and fractured aquifer group; Yan’an formation (Jurassic System) rock pore and fractured aquifer group; Upper Triassic fractured aquifer group; Permian sandstone and Carboniferous thin limestone aquifer group.
Structurally, the overall structural complexity in this area is moderate. In general, the Hongliu Coal Mine takes on a linear structure in NW direction. The crisscrossed faults are widely distributed in the study area. According to statistics, 44 faults and five large-scale folds have been exposed by drilling in the study area.
The coal-measure strata in the mining area are in the Yan’an formation of medium Jurassic System. There are 18 coal seams. The main stable and minable coal seams are No. 2 and No. 4 with the average thickness of 4.61 m and 2.97 m, respectively.
Division zones of the coal-roof strata after mining
After the mining of the coal seam, the coal-roof strata are destroyed in various degrees, and have an obvious zoning property. According to the damage degrees and the movement characteristics, the coal-roof strata are divided into three zones: caved zone, fractured zone and continuous bending zone4,17,32, as illustrated in Fig. 2. The fractured water-conducting zone studied in this paper consists of the caved zone and fractured zone.
Figure 2.
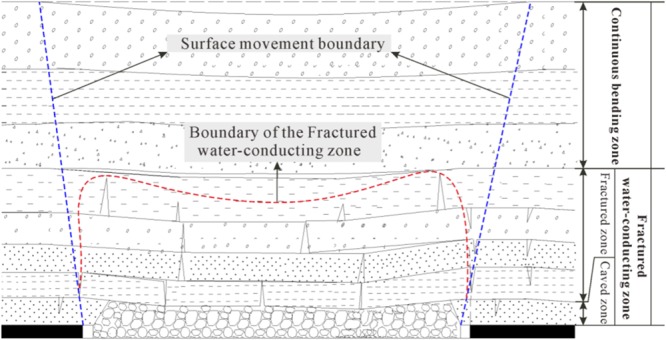
Division zones of the coal-roof strata after mining.
Caved zone
Caved zone is at the bottom of the overlying strata. With the moving forward of the mining working face, the immediate roof strata bear imbalance stress. When the load applied on the strata exceeding their bearing capacity, fractures generate. Finally, the strata crush, and the rocks irregularly fall into the void zone until it is filled. Thus, if an aquitard is located within the caved zone, its impermeability will become invalid in different degrees. So the caved zone provides ideal passages of the water from above aquifers to the working face.
Fractured zone
Fractured zone is above the caved zone, and the strata in this zone still maintain a certain continuity compared with the caved zone. The vertical fractures, inclined fractures and horizontal abscission-layer are heavily developed and distributed in the rocks at the bottom of this zone. The damage extent gradually decreases from the bottom of the fracture zone to the upper part, leading to the decrease of the fractures upward to the integrity rocks. This zone makes it possible that the fractures connect the aquifers, causing water inrushes from coal-roof strata. This zone is the main part of the water-conducting zone.
Continuous bending zone
Continuous bending zone refers to the strata between the fractured zone and the ground surface. The strata in this zone present the basic properties of downward movement without fractures developed within the rocks, especially the soft rock and loose soil strata. The movement of the strata almost hardly affects the impermeability of the aquitards in this zone, and it plays a protective role of the aquitards. A few fissures may appear in certain tension positions, but in general the strata maintain continuous17.
Random forest regression (RFR)
RFR, introduced by Breiman in 2001, is an ensemble learning algorithm of multiple regression trees. Compared with simple decision trees, RFR runs efficiently on high-dimensional data sets, and it is more accurate and robust to noise18,19. Besides, RFR has great advantages over traditional intelligent algorithms18–24. On the one hand, it has a very fast learning process and can handle a large number of input variables while assessing the importance of variables. On the other hand, when building a forest, it can internally estimate the generalization error and estimating missing data can maintain high accuracy even if most of the data is lost.
RFR is an ensemble of regression trees (RTs) to predict the value of a variable. It draws multiple samples based on the bootstrap resampling method from the original samples, and then constructs the decision trees model for the samples. Finally, the prediction output is obtained by calculating the average value of all prediction trees18. Figure 3 shows the sketch map of the RFR structure, and the specific implementation procedures of the RFR algorithm are as follows:
Figure 3.
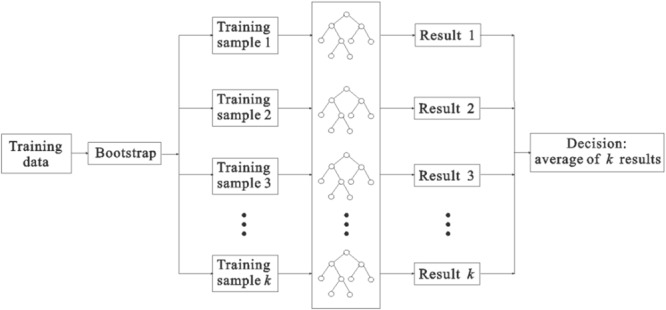
Sketch map of the RFR structure.
(1) Draw k samples randomly from the original training set X (N samples) using bootstrap resampling method, and then k regression trees are constructed. In this process, the probability that each sample wouldn’t be drawn is p = (1−1/N)N. If N tends to infinity, p ≈ 0.37, as indicates that about 37% of the samples in the original training set X are not drawn, these data are called out-of-bag (OOB) data. These OOB data can be used to be test samples.
(2) For k bootstrap samples, k unpruned regression trees are created respectively. In the tree growing process, for each node, m attributes are randomly selected from the total M attributes as internal nodes (m < M). Then, according to the minimum Gini index principle, an optimal attribute is selected from m attributes as a split variable to make the branches grow.
(3) The generated k regression trees constitute the final random forest regression model. The model estimation performance could be evaluated based on the indices: mean square error of OOB (MSEOOB) and coefficients of determination ().
| 1 |
| 2 |
where n is the total number of the OOB samples; yi is the observed output value; ŷi is the predicted output obtained by the generated RFR regression model; is the predicted variance of the OOB output.
Variables importance measures
The RFR model provides two ways to calculate the importance degree of each variable index: mean decrease in Gini index and mean decrease in accuracy18–20.
The mean decrease in Gini index means the total impurity decrease of each variable at each tree node. The method evaluates the importance of the variables by calculating the Gini index based on the Equation (3), and then accumulates the total impurity decrease of all the trees.
| 3 |
where pi is the probability of the samples belonging to the i-th leaf; N is the number of the leave; IGini is the Gini index.
The basic principle of the OOB error estimation method is: when the noise is added to a related feature which plays an important role in the accuracy, the prediction accuracy of the RFR will decrease significantly. The main procedures are as follows: firstly, for the generated RFR, the OOB error et of each decision tree is calculated according to the OOB data; secondly, the j-th eigenvalue Xj of the OOB data is changed randomly (namely the noise interference is added artificially); then, the OOB data with noise are used to test the performance of the RFR and a new OOB error is obtained. Finally, the importance degree of the variable Xj can be calculated according to the Equation (4):
| 4 |
where Xj is the j-th eigenvalue of the OOB data; et is the initial OOB error; is the OOB error with noise; n is the number of the decision trees; I(Xj) is the importance of the variable Xj. The greater the OOB error caused by the change of the variable Xj, the more the decrease in accuracy, indicating the more important the variable is.
Construction of the main controlling factors system
The development of FWCZ of coal-roof strata is influenced by multiple factors. And it has a complex nonlinear relationship with the strata geological features, rock mechanics and mining conditions17. Based on a large number of field observations for fully-mechanized mining and theoretical studies, five main controlling factors were selected, including mining depth, mining height, lithology type of the overlying strata, working-face length and coal-seam dip angle. A brief overview of the five factors is described as follows.
Mining depth
According to the theories of mining engineering geology and rock mechanics, the situ stress of the strata around the underground excavation space has a great impact on the destruction scope of the surrounding rock. Generally, the primary rock stress of the surrounding rock is proportional to the mining depth. With the increase of the mining depth of the coal seam, the in situ stresses and the displacement of the overlying rock gradually increase, which will lead to more fractures developed in the coal-roof strata.
Mining height
Mining height is the decisive factor of the fractured zone height. The greater the mining height, the larger the range of the coal-roof plastic zone. And a greater space available to the caving rock will form, resulting in a greater height of the fractured zone. In the traditional empirical formula prediction method, mining height is the only factor that controls the FWCZ height.
Lithology type
When the overlying rock is disturbed by the mining activities, the brittle rock with higher hardness (such as limestone and sandstone) is apt to crack and produce fractures. While, for the soft rock (such as mudstone and shale), the plastic deformation mainly occurs, and fractures rarely appear. After the extraction of the coal seams, the compressive strength of the overlying rock directly affects the rock failure degree. The rock with a greater compressive strength will be not prone to be destroyed. Generally, according to the uniaxial compressive strength of the rock, the lithology of the overlying strata is classified into four types13–15: hard, medium hard, medium soft and soft, with the quantitative values of 4, 3, 2 and 1, respectively.
Working-face length
Working-face length, like the mining height, is an index that reflects the influence of the mining space size on the fractured water-conducting zone. According to the material mechanics theory, the curvature of a rock beam with two ends fixed is proportional to the span. The greater the length of the working face, the greater the downward curvature of the coal-roof strata. Thus, the break probability of the rock beam increases, resulting in a higher height of the fractured zone.
Coal-seam dip angle
The influence that the coal-seam dip angle on the overlying strata is mainly embodied in the different failure forms of the strata. When the coal seam is horizontal, the form of the fractured zone is nearly symmetrical, showing a saddle shape. With the increase of the dip angle, the failure form of overlying rock gradually develops into parabola and arch shapes.
Results and Discussion
Datasets used
The collection of the datasets is the most important part for any machine learning algorithm. In this study, 85 field measured datasets for fully-mechanized mining were collected from several large-scale coalmines in North China, referring to the previous research documents13–17. Each case contains the field measured data of the aforementioned five main-controlling factors and the height of FWCZ. Of the 85 datasets, 60 (70%) were randomly selected for training (Table 1), while the remaining 25 (30%) for model testing. Figure 4 shows the detailed flowchart of the methodology used in this study.
Table 1.
Field measured sample datasets for model training.
| No. | Sample source | Mining depth (m) | Mining height (m) | Lithology type | Working-face length (m) | Coal-seam dip angle (°) | Height of fractured water-conducting zone (m) |
|---|---|---|---|---|---|---|---|
| 1 | No. 3241 working face in Qidong Coal Mine | 550 | 2.4 | 4 | 180 | 15 | 55.32 |
| 2 | No. 8 coal seam in Yangzhuang Coal Mine | 320 | 1.7 | 4 | 65 | 6 | 27.5 |
| 3 | No. 2 coal seam in Tiebei Coal Mine | 125 | 3 | 1 | 150 | 5 | 22 |
| 4 | No. 4320 working face in Xinglongzhuang Coal Mine | 450 | 8 | 4 | 170 | 8 | 86.8 |
| 5 | No. 4308 working face in Dongtan Coal Mine | 43 | 3 | 4 | 30 | 60 | 35 |
| 6 | No. 16 coal seam in Zhaopo Coal Mine | 120 | 1.2 | 2 | 75 | 8 | 31 |
| 7 | No. 3 coal seam in Wulanmulun Coal Mine | 101.1 | 2.2 | 3 | 158 | 1 | 63 |
| 8 | No. 13013 coal seam in Baodian Coal Mine | 417 | 2.9 | 4 | 80 | 4 | 68 |
| 9 | No. 2 coal seam in Guantai Coal Mine | 300 | 4 | 2 | 75 | 2 | 120 |
| 10 | No. 8 coal seam in Luling Coal Mine | 276 | 4.5 | 1 | 350 | 7 | 17.2 |
| 11 | No. 7 coal seam in Fangezhuang Coal Mine | 84 | 4 | 2 | 108 | 3 | 30 |
| 12 | No. 1203 working face in Daliuta Coal Mine | 49 | 4 | 1 | 135 | 5 | 45 |
| 13 | No. C13-1 working face in Panxie Coal Mine | 117 | 3.4 | 2 | 205 | 2 | 72 |
| 14 | No. 1 coal seam in Xinji Coal Mine | 290 | 6 | 1 | 645 | 8 | 85.6 |
| 15 | No. 4 coal seam in Liuhualing Coal Mine | 89 | 2.03 | 4 | 69 | 7 | 45.86 |
| 16 | No. 16 coal seam in Laoshidan Coal Mine | 200 | 1.5 | 1 | 45 | 0 | 4.5 |
| 17 | No. 2 coal seam in Kongji Coal Mine | 200 | 8 | 4 | 89 | 76 | 48 |
| 18 | No. 11 coal seam in Tongting Coal Mine | 230 | 2 | 1 | 85 | 37 | 52.5 |
| 19 | No. 1 coal seam in Qilianta Coal Mine | 56 | 4.3 | 4 | 55 | 0 | 42.5 |
| 20 | No. 31107 working face in Luxi Coal Mine | 350 | 2.5 | 2 | 135 | 5 | 20 |
| 21 | No. 9 coal seam in Luling Coal Mine | 284 | 7 | 2 | 130 | 3.5 | 26 |
| 22 | No. 7141 working face in Qidong Coal Mine | 520 | 2.3 | 3 | 174 | 12 | 50.675 |
| 23 | No. 3241 working face in Qidong Coal Mine | 509 | 2.25 | 3 | 180 | 12.5 | 34.925 |
| 24 | No. 7130 working face in Qidong Coal Mine | 402.5 | 3 | 3 | 170 | 12 | 19.6 |
| 25 | No. 1013 working face in Wugou Coal Mine | 386.5 | 3.1 | 3 | 150 | 10 | 40.79 |
| 26 | No. 1017 working face in Wugou Coal Mine | 380 | 3.5 | 3 | 180 | 6 | 45.84 |
| 27 | No. 345 working face in Qinan Coal Mine | 395.5 | 3.45 | 3 | 160 | 14 | 26.7 |
| 28 | No. 1031 working face in Taoyuan Coal Mine | 384.2 | 2.65 | 3 | 190.5 | 21 | 33 |
| 29 | No. 1062 working face in Taoyuan Coal Mine | 306 | 3 | 3 | 150 | 28 | 33.615 |
| 30 | No. 745 working face in Haizi Coal Mine | 404.5 | 2.3 | 3 | 95 | 18 | 19.5 |
| 31 | No. 1031 working face in Haizi Coal Mine | 313.5 | 2.4 | 3 | 65 | 6 | 21.9 |
| 32 | No. 841 working face in Zhuxianzhuang Coal Mine | 342.5 | 3.8 | 3 | 114 | 13 | 28.455 |
| 33 | No. 821 working face in Zhuxianzhuang Coal Mine | 338.5 | 1.9 | 3 | 115.5 | 20 | 20.995 |
| 34 | No. 822 working face in Zhuxianzhuang Coal Mine | 316 | 1.9 | 3 | 165 | 12 | 26.085 |
| 35 | No. 721 working face in Zhuxianzhuang Coal Mine | 296 | 1.9 | 4 | 95.5 | 15 | 17.84 |
| 36 | No. II 865 working face in Zhuxianzhuang Coal Mine | 493.75 | 13.43 | 3 | 130 | 15 | 93.175 |
| 37 | No. 8212 working face in Xutong Coal Mine | 395 | 2.5 | 3 | 178 | 9 | 26.33 |
| 38 | No. 7126 working face in Xutong Coal Mine | 478.5 | 2.5 | 3 | 180 | 8 | 33.755 |
| 39 | No. 16028 working face in Paner Coal Mine | 340 | 1.8 | 2 | 178 | 3 | 19.69 |
| 40 | No. 1207 working face in Paner Coal Mine | 319 | 2 | 2 | 148 | 5 | 17.155 |
| 41 | No. 1201(3) working face in Paner Coal Mine | 311 | 2 | 2 | 85 | 3 | 19.11 |
| 42 | No. 1201(1) working face in Paner Coal Mine | 327.5 | 2 | 2 | 78 | 7 | 22.995 |
| 43 | No. 12128 working face in Paner Coal Mine | 355.5 | 2 | 2 | 125 | 3 | 23.865 |
| 44 | No. 12118 working face in Paner Coal Mine | 349 | 2 | 3 | 130 | 5.5 | 22.31 |
| 45 | No. 12117 working face in Paner Coal Mine | 363 | 2 | 3 | 180 | 8 | 16.845 |
| 46 | No. 1701(3) working face in Pansan Coal Mine | 447 | 2 | 3 | 107 | 4 | 30.965 |
| 47 | No. 1711(3) working face in Pansan Coal Mine | 420.5 | 2.8 | 3 | 135 | 3 | 41.13 |
| 48 | No. 1211(3) working face in Pansan Coal Mine | 509.5 | 3 | 2 | 140 | 10 | 26.01 |
| 49 | No. 14032(3) working face in Panyi Coal Mine | 383 | 2.2 | 2 | 125 | 5 | 13.035 |
| 50 | No. 14021(3) working face in Panyi Coal Mine | 376.5 | 2 | 2 | 124 | 5 | 12.675 |
| 51 | No. 1401(3) working face in Panyi Coal Mine | 391 | 1.8 | 2 | 125 | 5 | 14.29 |
| 52 | No. 1402(3) working face in Panyi Coal Mine | 404 | 2.2 | 2 | 150 | 6 | 21.195 |
| 53 | No. 1412(3) working face in Panyi Coal Mine | 415 | 3.4 | 3 | 120 | 8 | 30.085 |
| 54 | No. 1121(1) working face in Panyi Coal Mine | 418 | 1.8 | 3 | 120 | 6 | 24.69 |
| 55 | No. 2622(3) working face in Panyi Coal Mine | 552.5 | 5.8 | 3 | 182 | 8 | 44.36 |
| 56 | No. 1121(3) working face in Panyi Coal Mine | 490.5 | 6 | 3 | 182 | 7 | 44.19 |
| 57 | No. 1211(3) working face in Xieqiao Coal Mine | 445 | 4 | 3 | 198 | 8 | 29.265 |
| 58 | No. 1221(3) working face in Xieqiao Coal Mine | 490.5 | 5 | 3 | 172 | 8 | 52.76 |
| 59 | No. 1221(3) working face in Zhangji Coal Mine | 605.5 | 3 | 3 | 136 | 2 | 38.185 |
| 60 | No. 1212(3) working face in Zhangji Coal Mine | 516 | 3.9 | 3 | 205 | 2 | 31.765 |
Figure 4.
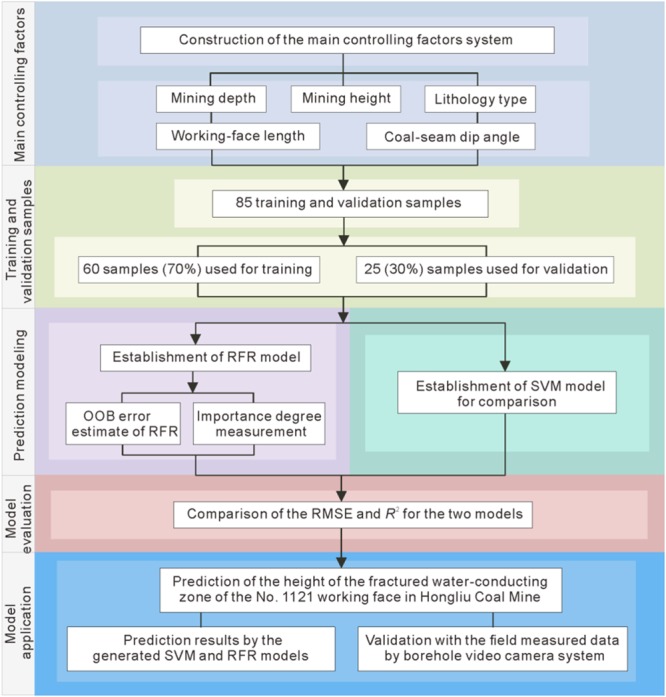
Detailed flowchart of the proposed methodology.
Establishment of the RFR model
In the RFR, two parameters are required to define: the number of trees in the forest (ntree), and the number of the random variables of the split nodes (mtry). To maximize the model accuracy, it is necessary to optimize the combination of the parameters mtry and ntree18. When ntree is defined with a small value, the RFR prediction error is uncontrollable and the model performance cannot achieve the optimal identification. Conversely, if the parameter ntree is too large, the computation time and required memory will increase accordingly. By repeated operation, it is found that when ntree = 200, the MSEOOB tends to be stable and the model does not tend to over fitting. According to Breiman18, mtry < M. In this case study, there are five variables, namely M = 5. To assess the optimal value of mtry, three RFR models were created for mtry = 1, mtry = 2 and mtry = 3 (Fig. 5). Figure 5 shows the change of the error depending on the number of the trees ntree. The results show that when ntree = 200, the error of the model is stable, and when mtry = 1, the MSEOOB is lowest at about 6.9 m2. Therefore, considering both the accuracy and computation cost, the two optimized parameters of the RFR are as follows: mtry = 1 and ntree = 200.
Figure 5.

The OOB error of the RFR model.
The contribution of each factor to the generated RFR model is shown in Fig. 6. As shown, the importance degree of each factor is measured based on two ways: mean decrease in Gini index and OOB mean decrease in accuracy. According to the Gini index, mining height and mining depth have the highest importance, followed by coal-seam dip angle and working-face length, while lithology type has the lowest importance. Regarding the OOB mean decrease in accuracy, the order of the importance degree is consistent with the result obtained by Gini index method. Based on both of the features of importance, mining height and mining depth are the two most important factors out of the five factors, as suggests that they contribute overwhelmingly to the development of the FWCZ height.
Figure 6.

Importance degree of the main controlling factors determined by two ways: (a) Mean decrease in Gini index; (b) Mean decrease in accuracy. (MH: mining height; MD: mining depth; CSDA: coal-seam dip angle; WFL: working-face length; LT: lithology type).
SVM model for comparison
For comparison, support vector machine (SVM) regression model was also used for the prediction of the height of fractured water-conducting zone. SVM has superior prediction performance in various fields for data modeling and function optimization because of its ability to represent non-linearities23. The radial basis function (RBF) was adopted as the kernel function, and the two main parameters RBF kernel coefficient γ and penalty coefficient C were determined as 0.1 and 0.5. And then the SVM regression model was constructed using the same training data aforementioned.
Model evaluation
The model evaluation is an important procedure before the model application. The root mean square error (RMSE) and the coefficient of determination R2 were utilized to evaluate the performance of the two generated regression models. RMSE is generally used for measuring the residual errors, and it reflects the difference between original and modeled values. The lower the RMSE, the better the model performs. R2 provides a measure of how well the predicted output of the regression model fits the observed data. The value of R2 varies between 0 and 1. A higher R2 indicates that the regression model fits the data better. The two indices are defined as follows:
| 5 |
| 6 |
where n is the total number of the test samples; yi is the observed output value of the test samples; yi is the predicted value by the generated models; ŷi is the average output value of the test samples.
Table 2 lists 25 sample datasets for model testing to evaluate the performance of the models. Using the two regression models generated above, the heights of FWCZ of the 25 cases were predicted. Figure 7 shows the predicted value against the observed data with the test data using SVM and RFR, respectively. Based on the Equations (5) and (6), the RMSE and R2 of the two models were calculated as Table 3. As it shown, the RFR model has the lower RMSE and higher R2 with the value of 2.363 and 0.968, respectively (compared to 4.396 and 0.902 for SVM model). Therefore, it is concluded that both models are reasonable, and RFR has a better performance compared with the SVM.
Table 2.
Field measured sample datasets for model testing.
| No. | Sample source | Mining depth (m) | Mining height (m) | Lithology type | Working-face length (m) | Coal-seam dip angle (°) | Height of fractured water-conducting zone (m) |
|---|---|---|---|---|---|---|---|
| 1 | No. 1215(3) working face in Zhangji Coal Mine | 520.5 | 3 | 3 | 202 | 2 | 33.365 |
| 2 | No. 1242(1) working face in Gubei Coal Mine | 620 | 3.1 | 4 | 240 | 3.5 | 20.215 |
| 3 | No. 7192 working face in Kongzhuang Coal Mine | 220 | 5.3 | 3 | 120 | 25 | 46.5 |
| 4 | No. S4101 working face in Pingshuo Coal Mine | 360 | 7.69 | 3 | 220 | 3 | 45.125 |
| 5 | No. ZF2801 working face in Xiagou Coal Mine | 347 | 9.9 | 3 | 100 | 2 | 79.255 |
| 6 | No. 5306 working face in Xinglongzhuang Coal Mine | 412 | 6.9 | 3 | 160 | 4 | 38.8 |
| 7 | No. 6206 working face in Wangzhuang Coal Mine | 316 | 5.9 | 3 | 248 | 4.5 | 60.81 |
| 8 | No. I03(2) working face in Laogongyingzi Coal Mine | 240 | 3.5 | 1 | 195 | 7 | 21.675 |
| 9 | No. I03(4) working face in Laogongyingzi Coal Mine | 240 | 3.5 | 1 | 195 | 7 | 17.445 |
| 10 | No. 3202 working face in Wangpo Coal Mine | 474.16 | 5.8 | 3 | 230 | 4 | 65.395 |
| 11 | No. 93101 working face in Nantun Coal Mine | 541.5 | 5.28 | 3 | 175 | 6.5 | 49.25 |
| 12 | No. 1301 working face in Jisan Coal Mine | 480 | 6.3 | 3 | 170 | 4 | 46.13 |
| 13 | No. 1305 working face in Dongtan Coal Mine | 600 | 8.78 | 3 | 223.35 | 6 | 54.08 |
| 14 | No. 2308 working face in Xinglongzhuang Coal Mine | 332.85 | 7.15 | 3 | 160 | 5 | 16.115 |
| 15 | No. 2306 working face in Xinglongzhuang Coal Mine | 319.2 | 8.2 | 3 | 160 | 7.5 | 27.84 |
| 16 | No. 2302 working face in Xinglongzhuang Coal Mine | 278.15 | 8.7 | 3 | 170 | 8 | 28.56 |
| 17 | No. 2300 working face in Xinglongzhuang Coal Mine | 282 | 8.55 | 3 | 140 | 5 | 25.255 |
| 18 | No. 23S2 working face in Xinglongzhuang Coal Mine | 258.55 | 8.45 | 3 | 175 | 3 | 20.85 |
| 19 | No. 2303 working face in Xinglongzhuang Coal Mine | 286.45 | 7.8 | 3 | 150 | 8 | 35.9 |
| 20 | No. 1314 working face in Baodian Coal Mine | 350 | 8.5 | 3 | 169 | 6.5 | 55.255 |
| 21 | No. 2605 working face in Yangcun Coal Mine | 187.5 | 1.2 | 3 | 300 | 10 | 10.41 |
| 22 | No. 63110 working face in Nantun Coal Mine | 368.05 | 5.77 | 3 | 125 | 6 | 48.35 |
| 23 | No. 2186 working face in Donghuantuo Coal Mine | 420 | 3.4 | 3 | 70 | 23 | 56.8 |
| 24 | Fangezhuang Coal Mine | 173 | 1.9 | 4 | 70 | 20 | 25.3 |
| 25 | No. 1672 working face in Qianjiaying Coal Mine | 446 | 3.8 | 4 | 143 | 17 | 40 |
Figure 7.

Comparison of the observed and predicted height with the test data by using: (a) SVM; (b) RFR.
Table 3.
RMSE and R2 of the RFR and SVM models.
| Prediction model | RMSE (m) | R 2 |
|---|---|---|
| SVM | 4.396 | 0.902 |
| RFR | 2.636 | 0.968 |
Model application
Engineering background and predicted results
The No. 1121 working face of the No. 2 coal seam, located in the center of Hongliu Coal Mine, is the initial mining face of the mine. The length of the working face is 1379 m, and the average mining depth is 265 m. The fully-mechanized longwall mining method is adopted in the mining process. The No. 2 coal seam belongs to the Yan’an Formation of the Jurassic System, with an average thickness of 5.28 m. The dip angle of the No. 2 coal seam varies from 5° to 15°, with the average value of 10°.
Figure 8 displays the typical geological column of the No. 1121 working face overlying strata. As it shown, the strata directly overlying the coal mainly consist of the silt and fine sandstones in the lower Zhiluo formation, which are considered as aquitards. The average total thickness of these strata is 52.2 m. According to the rock division rule aforementioned, the sandstone is considered to be hard rock, so the lithology type of the strata is quantified as 4. The first aquifer overlying the No. 2 coal seam is about 51.28 m distance from the coal. It consists of grit sandstones with great thickness, and it has a rich water-abundance property. Thus, in order to evaluate the risk of water inrushes from overlying the coal seam and take corresponding measures, it is necessary to precisely predict the height of the FWCZ. By applying the above generated SVM and RFR models to the No. 1121 working face of the No. 2 coal seam, the height of FWCZ is predicted as 64.17 m and 62.96 m, respectively.
Figure 8.

Typical geological column of the No. 1121 working face overlying strata.
Practical situation of the No. 1121 working face
When the No. 1121 working face moved forward about 56 m, a large amount of water from the overlying aquifer leaked into the working face. The maximum water inflow was up to 1817 m3/h, so the mining operation had to be terminated. For drawing up the water-inrush prevention measures scientifically, the borehole video camera system (BVCS) was used to observe the height of the fractured water-conducting zone. BVCS is an exploration technology which can directly observe the inner conditions of the boreholes based on the optics theory. The system can be used to observe the strata lithology, geological structures properties, fracture-zone development conditions, groundwater levels change and so on10.
In this study, the BVCS was used to observe the change of the fractures development degree with the increase of the borehole depth and determine the top boundaries of the fractured zone and the caved zone. Figure 9 shows the video camera images of the borehole HL-1. According to the images, the rocks above 279.07 m are sandstone and mudstone interbed, and they are relatively integrated except that a few small cracks in the horizontal direction appear in certain local positions (Fig. 9a).
Figure 9.

Video camera images of the borehole HL-1: (a) Integrate rock without fracture; (b) Fractured zone with various forms of fractures; (c) Caved zone.
Figure 9b shows the fractured zone images with various forms of fractures: a nearly vertical fracture with a small width appears at the borehole depth of 279.07–279.27 m; there are many abscission-layer phenomena between 286.3 m and 294.68 m; the crisscrossed fractures with large displacements are distributed in the rocks below 294 m. Therefore, according to the fractures development conditions described above, the depth of 279.07 m is considered as the top boundary of the fractured zone.
As Fig. 9c shown, the rocks below the depth of 298.9 m were damaged seriously, and there is a vast void area with obvious mining collapse characteristics. So the depth of 298.9 m is determined as the top boundary of the caved zone.
Based on the formula proposed by China Coal Industry Bureau20, the height of FWCZ of coal-roof strata can be calculated as follows:
| 7 |
where H is the maximum height of FWCZ (m); H′ is the depth of the coal-seam floor (m); h is the depth of the fractured zone’s top boundary (m); M is the thickness of the mining coal seam (m).
According to the drilling data and the video camera images of borehole HL-1, the depth of the No. 2 coal-floor is 345.88 m, and the thickness of the coal seam is 5.28 m. Therefore, combined with the Equation (7), the height of FWCZ is calculated to be H = (345.88–279.07–5.28) = 61.53 m. Table 4 shows the comparison between the field measured data and the prediction results obtained by the proposed methods.
Table 4.
Comparison between the field measured data and the prediction results obtained by the SVM and RFR.
| Model | Prediction results (m) | Field measured data by BVCS (m) | Absolute error (m) | Relative error (%) |
|---|---|---|---|---|
| SVM | 64.17 | 61.53 | 2.64 | 4.29 |
| RFR | 62.96 | 1.43 | 2.32 |
The results show that compared with the field measured data, the SVM and RFR methods have the relative error of 4.29% and 2.32%, respectively. It indicates that both of the prediction results are generally in good agreement with the field-observed result, and the RFR model has a better performance in the application of the study area, which is in accordance with the above conclusion.
Summary and Conclusions
To ensure the safe production of coal mines, this study proposed a prediction model of the height of FWCZ based on RFR. RFR is a robust machine learning method that can be used to evaluate the variable importance and predict the height of FWCZ. Compared with the traditional MLAs, RFR has numerous advantages, especially, its high prediction accuracy and it is well suitable for the problems with unclear priori knowledge and incomplete data. For the objective problems faced in this study, for instance, the lack of data samples, the RFR model can still maintain a high degree of accuracy. Then, the RFR model was applied to Hongliu Coal Mine in Northwest China. And the main conclusions are reached as follows.
Five variables were selected to construct the main controlling factors system. And according to the importance degree measurement by the mean decrease in Gini index and OOB mean decrease in accuracy, mining height and mining depth are the top two most important factors out of the five variables.
For comparison with the generated RFR model, a SVM model was also constructed using the same training datasets. By the validation of the two models, the RFR model has the lower RMSE and higher R2 with the value of 2.363 and 0.968, respectively (compared to 4.396 and 0.902 for SVM model).
The two generated models were applied to the No. 1121 working face in Hongliu coal mine to verify the effectiveness of the models. The prediction heights of the FWCZ by using RFR and SVM are 62.96 m and 64.17 m, respectively. Field measured data by borehole video camera system is 61.53 m, and the RFR and SVM have the relatively error of 2.32% and 4.29%, respectively. It is concluded that RFR has a better performance in the application of the study area compared with the SVM.
This study shows the potential to provide a novel approach to predict the height of FWCZ. The results provide a reference for water-inrush risk management, prevention and reduction in the study area.
Acknowledgements
This research was financially supported by National Key R&D Program of China (2016YFC0801800), China National Natural Science Foundation (41430318, 41572222, 41602262, 41702261), Beijing Natural Science Foundation (8162036), Fundamental Research Funds for the Central Universities (2010YD02), Innovation Research Team Program of Ministry of Education (IRT1085) and State Key Laboratory of Coal Resources and Safe Mining.
Author Contributions
This paper was written by Dekang Zhao. Qiang Wu contributed to reviewing and editing the manuscript.
Competing Interests
The authors declare no competing interests.
Footnotes
Publisher's note: Springer Nature remains neutral with regard to jurisdictional claims in published maps and institutional affiliations.
References
- 1.Meng Z, Li G, Xie X. A geological assessment method of floor water inrush risk and its application. Eng. Geol. 2012;143–144:51–60. doi: 10.1016/j.enggeo.2012.06.004. [DOI] [Google Scholar]
- 2.Wu Q, et al. Method for assessing coal-floor water-inrush risk based on the variable-weight model and unascertained measure theory. Hydrogeol. J. 2017;10:1–15. [Google Scholar]
- 3.Wu Q, et al. Assessment of water inrush vulnerability from overlying aquifer using GIS–AHP-based ‘three maps–two predictions’ method: a case study in Hulusu coal mine, China. Q. J. Eng. Geol. Hydroge. 2015;48:234–243. [Google Scholar]
- 4.Liu, T. Coal Mine Ground Movement and Strata Failure. Coal Industry Publ. House, Beijing, China (1981).
- 5.Hu X, Li W, Cao D, Liu M. Index of multiple factors and expected height of fully mechanized water flowing fractured zone. J. China Coal Soc. 2012;37:613–620. [Google Scholar]
- 6.Shi L, et al. Calculating the height of water flowing fracture zone in deep mining. J. China Univ. Min. Technol. 2012;41:37–41. [Google Scholar]
- 7.Liu X, Tan Y, Ning J, Tian C, Wang J. The height of water-conducting fractured zones in longwall mining of shallow coal seams. Geotech. Geol. Eng. 2015;33:693–700. doi: 10.1007/s10706-015-9851-2. [DOI] [Google Scholar]
- 8.Yang G, Chen C, Gao S, Feng B. Study on the height of water flowing fractured zone based on analytic hierarchy process and fuzzy clustering analysis method. Journal of Mining and Safety Engineering. 2015;32:206–212. [Google Scholar]
- 9.Gao B, Liu Y, Pan J, Yuan T. Detection and analysis of height of water flowing fractured zone in underwater mining. Chin. J. Rock Mech. Eng. 2014;33:3384–3390. [Google Scholar]
- 10.Wei J, et al. Formation and height of the interconnected fractures zone after extraction of thick coal seams with weak overburden in Western China. Mine Water Environ. 2017;36:59–66. doi: 10.1007/s10230-016-0396-2. [DOI] [Google Scholar]
- 11.Wang F, Tu S, Zhang C, Zhang Y, Bai Q. Evolution mechanism of water-flowing zones and control technology for longwall mining in shallow coal seams beneath gully topography. Environ. Earth Sci. 2016;75:1309. doi: 10.1007/s12665-016-6121-4. [DOI] [Google Scholar]
- 12.Wang G, Wu M, Wang R, Xu H, Song X. Height of the mining-induced fractured zone above a coal face. Eng. Geol. 2017;216:140–152. doi: 10.1016/j.enggeo.2016.11.024. [DOI] [Google Scholar]
- 13.Sun Y, Wang Y, Zheng X. Analysis the height of water conducted zone of coal seam roof based on GA-SVR. J. China Coal Soc. 2009;12:1610–1615. [Google Scholar]
- 14.Wu Q, Shen J, Liu W, Wang Y. A RBFNN-based method for the prediction of the developed height of a water-conductive fractured zone for fully mechanized mining with sublevel caving. Arab. J. Geosci. 2017;10:172. doi: 10.1007/s12517-017-2959-3. [DOI] [Google Scholar]
- 15.Li Z, Xu Y, Li L, Zhai C. Forecast of the height of water flowing fractured zone based on BP neural networks. Journal of Mining and Safety Engineering. 2015;32:905–910. [Google Scholar]
- 16.Xu ZM, Dong YJ, Zhang QH, Zhang GW, Li S. Predicting the height of water-flow fractured zone during coal mining under the xiaolangdi reservoir. Int. J. Min. Sci. Technol. 2010;20:434–438. [Google Scholar]
- 17.Miao X, Cui X, Wang J, Xu J. The height of fractured water-conducting zone in undermined rock strata. Eng. Geol. 2011;120:32–39. doi: 10.1016/j.enggeo.2011.03.009. [DOI] [Google Scholar]
- 18.Breiman L. Random forest. Mach. Learn. 2001;45:5–32. doi: 10.1023/A:1010933404324. [DOI] [Google Scholar]
- 19.Smith PF, Ganesh S, Liu P. A comparison of random forest regression and multiple linear regression for prediction in neuroscience. J. Neurosci. Meth. 2013;220:85–91. doi: 10.1016/j.jneumeth.2013.08.024. [DOI] [PubMed] [Google Scholar]
- 20.Rodriguez-Galiano V, Sanchez-Castillo M, Chica-Olmo M, Chica-Rivas M. Machine learning predictive models for mineral prospectivity: An evaluation of neural networks, random forest, regression trees and support vector machines. Ore Geol. Rev. 2015;71:804–818. doi: 10.1016/j.oregeorev.2015.01.001. [DOI] [Google Scholar]
- 21.Pradhan B. A comparative study on the predictive ability of the decision tree, support vector machine and neuro-fuzzy models in landslide susceptibility mapping using GIS. Comput. Geosci. 2013;51:350–365. doi: 10.1016/j.cageo.2012.08.023. [DOI] [Google Scholar]
- 22.Zhang T, et al. A novel approach for quantitative analysis of multi-elements in steels based on laser-induced breakdown spectroscopy (LIBS) and random forest regression (RFR) J. Anal. At. Spectrom. 2014;29:2323–2329. doi: 10.1039/C4JA00217B. [DOI] [Google Scholar]
- 23.Wang Z, et al. Flood hazard risk assessment model based on random forest. J. Hydrol. 2015;527:1130–1141. doi: 10.1016/j.jhydrol.2015.06.008. [DOI] [Google Scholar]
- 24.Rodriguez-Galiano V, Mendes MP, Garcia-Soldado MJ, Chica-Olmo M, Ribeiro L. Predictive modeling of groundwater nitrate pollution using Random Forest and multisource variables related to intrinsic and specific vulnerability: A case study in an agricultural setting (Southern Spain) Sci. Total Environ. 2014;476-477:189–206. doi: 10.1016/j.scitotenv.2014.01.001. [DOI] [PubMed] [Google Scholar]
- 25.Ulrike G. Variable importance assessment in regression: linear regression versus random forest. Am. Stat. 2009;63:308–319. doi: 10.1198/tast.2009.08199. [DOI] [Google Scholar]
- 26.Taghvaei H, Amooie MA, Hemmati-Sarapardeh A, Taghvaei H. A comprehensive study of phase equilibria in binary mixtures of carbon dioxide + alcohols: Application of a hybrid intelligent model (CSA-LSSVM) Journal of Molecular Liquids. 2016;224:745–756. doi: 10.1016/j.molliq.2016.09.119. [DOI] [Google Scholar]
- 27.Arabloo M, Amooie MA, Hemmati-Sarapardeh A, Ghazanfari MH, Mohammadi AH. Application of constrained multi-variable search methods for prediction of PVT properties of crude oil systems. Fluid Phase Equilibria. 2014;363:121–130. doi: 10.1016/j.fluid.2013.11.012. [DOI] [Google Scholar]
- 28.Moortgat J, Amooie MA, Soltanian MR. Implicit finite volume and discontinuous Galerkin methods for multicomponent flow in unstructured 3D fractured porous media. Advances in Water Resources. 2016;96:389–404. doi: 10.1016/j.advwatres.2016.08.007. [DOI] [Google Scholar]
- 29.Amooie MA, Soltanian MR, Moortgat J. Hydrothermodynamic mixing of fluids across phases in porous media. Geophysical Research Letters. 2017;44(8):3624–3634. doi: 10.1002/2016GL072491. [DOI] [Google Scholar]
- 30.Amooie MA, Soltanian MR, Dai Z, Xiong F, Moortgat J. Mixing and spreading of multi- phase fluids in heterogeneous bimodal porous media. Geomechanics and Geophysics for Geo-Energy and Geo-Resources. 2017;3(3):225–244. doi: 10.1007/s40948-017-0060-8. [DOI] [Google Scholar]
- 31.Soltanian MR, et al. Dissolution trapping of carbon dioxide in heterogeneous aquifers. Environmental Science & Technology. 2017;51(13):7732–7741. doi: 10.1021/acs.est.7b01540. [DOI] [PubMed] [Google Scholar]
- 32.China Coal Industry Bureau. Measuring method on height of water flowing fractured zone using losses of drilling fluid. Coal Ind. Stand People’s Repub. China. pp. 1–3, MT/T 865–2000 (2000).