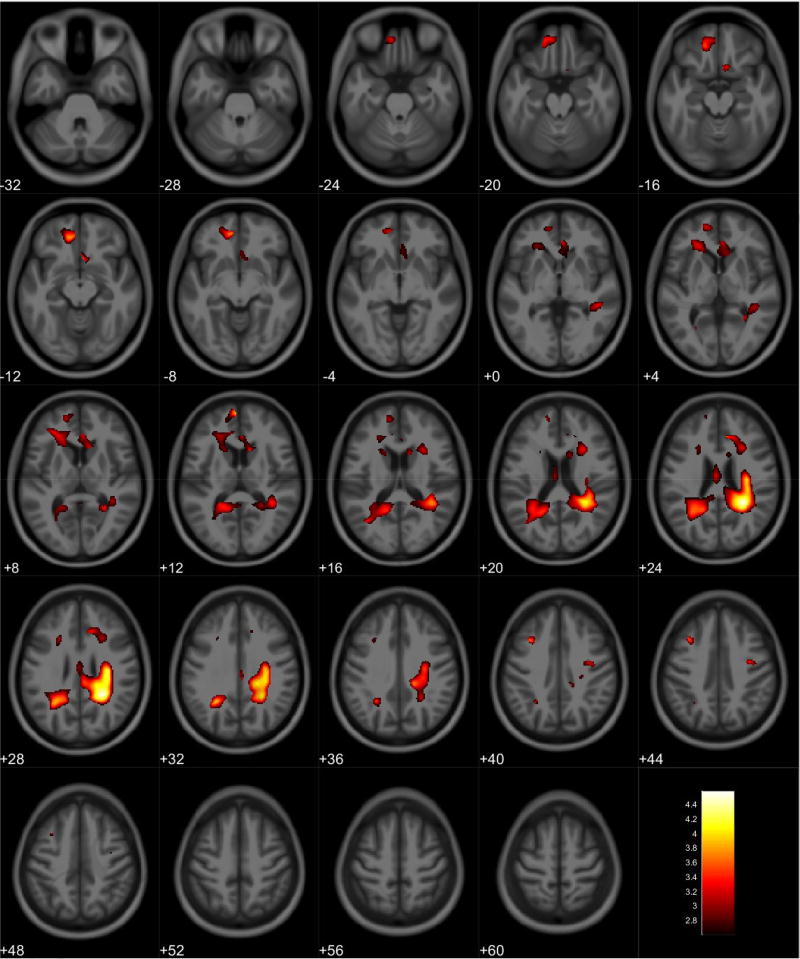
Figure 11.
Regional white matter volume decrease in males. Overlay of significant clusters representing a volumetric decrease associated with increased PbB78 scores for male subjects (N = 65). All clusters presented have been corrected for multiple comparisons (P ≤ 0.05). Slice numbers represent distance from origin (0, 0, 0), which was set at the anterior commissure. Color bar represents voxel level T-statistic. Orientation: Left = Left, Right = Right. PbB78 Blood lead at age 78 months.

