Abstract
Endothelial dysfunction promotes the pathogenesis of diabetic nephropathy (DN); considered to be an early event in disease progression. However, the molecular changes associated with glomerular endothelial cell (GEC) injury in early DN are not well defined. Most gene expression studies have relied on the indirect assessment of GEC injury from isolated glomeruli or renal cortices. Here, we present transcriptomic analysis of isolated GECs, using streptozotocin-induced diabetic wildtype (STZ-WT) and diabetic eNOS-null (STZeNOS−/−) mice as models of mild and advanced DN, respectively. GECs of both models in comparison to their respective nondiabetic controls showed significant alterations in the regulation of apoptosis, oxidative stress, and proliferation. The extent of these changes was greater in STZ-eNOS−/− than in STZ-WT GECs. Additionally, genes in STZ-eNOS−/− GECs indicated further dysregulation in angiogenesis and epigenetic regulation. Moreover, a biphasic change in the number of GECs, characterized by an initial increase and subsequent decrease over time, was observed only in STZ-eNOS−/− mice. This is consistent with an early compensatory angiogenic process followed by increased apoptosis, leading to an overall decrease in GEC survival in DN progression. From the genes altered in angiogenesis in STZ-eNOS−/− GECs, we identified potential candidate genes, Lrg1 and Gpr56, whose function may augment diabetes-induced angiogenesis. Thus, our results support a role for GEC in DN by providing direct evidence for alterations of GEC gene expression and molecular pathways. Candidate genes of specific pathways, such as Lrg1 and Gpr56, can be further explored for potential therapeutic targeting to mitigate the initiation and progression of DN.
Keywords: Diabetic nephropathy, glomerular endothelial cells, transcriptional profiling, eNOS
INTRODUCTION
Diabetic nephropathy (DN) is the most common cause of end-stage renal disease (ESRD) in the US, and its incidence is rising worldwide 1. Although the current management with tight glycemic control and inhibition of the renin angiotensin system (RAS) reduces the incidence and slows the progression of DN, its prevalence remains high, and many patients on RAS inhibitors continue to progress to ESRD 2. Thus, better understanding of molecular mechanisms underlying early diabetic kidney injury is required to identify new targets to prevent or to slow down progressive DN.
Several studies indicate that glomerular endothelial cell (GEC) injury is a critical pathological event in early DN. Vascular endothelial growth factor-A (VEGF-A) was shown to be increased in the early phases of DN, resulting in increased neoangiogenesis, contributing to the initial hyperfiltration and ensuing microalbuminuria 3. Reduction of nitric oxide production due to the suppressed endothelial nitric oxide synthetase (eNOS) expression in GECs also leads to disruption of glomerular autoregulation, uncontrolled VEGF action, release of pro-thrombotic substances by endothelial cells, and contributes to accelerated DN in rodent models of diabetes 4,5,6,7.
Genome-wide gene expression profiling is useful in providing a broad view of the disease pathogenesis. However, gene expression analysis from isolated glomeruli or cortices of diabetic kidneys 8,9 offers limited information on specific cells due to the heterogeneity of cell types included. Indeed, our recent study showed that the transcriptomic profiles of isolated podocytes differed significantly from those of the whole glomeruli in diabetic eNOS-null mice 10. So far, there has been only one study that has provided gene expression data on isolated GECs from advanced DN model using microarray 11. Here we present the RNA sequencing (RNA-seq) analysis of isolated GECs in early stages of DN, taking advantage of the transgenic mouse model with Flk1-driven nuclear expression of enhanced yellow fluorescent protein (Flk1-H2B-EYFP) in the C57BL/6J strain 12, which in adult kidneys shows prominent EYFP expression in GECs 13. Diabetes was induced with streptozotocin in wildtype Flk1-H2B-EYFP and in eNOS-deficient Flk1-H2B-EYFP mice to represent mild and more advanced DN, respectively 14. We first compared the gene expression profile of GECs of diabetic versus GECs of nondiabetic mice; differentially expressed genes in diabetic mice were then further compared between mild and advanced DN models to identify potential molecular pathways that might contribute to aggravated GEC injury in DN.
RESULTS
Effective isolation of GECs from Flk1-H2B-EYFP transgenic mice
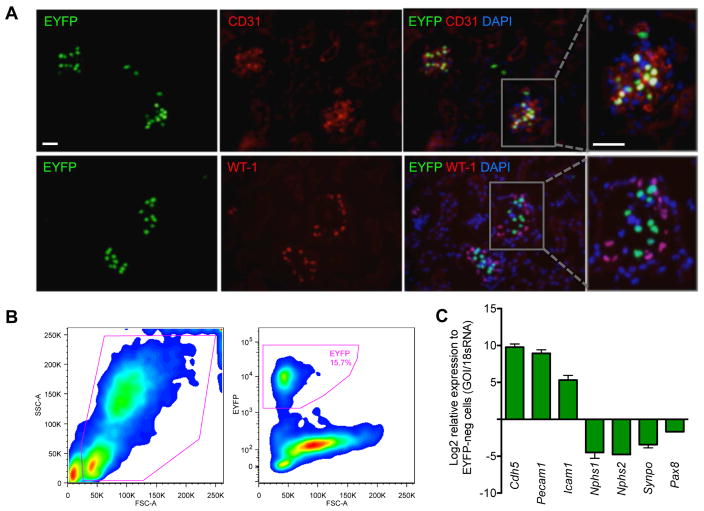
In order to specifically isolate GECs, we employed a transgenic mouse model with the histone H2B-fused enhanced yellow fluorescent protein (EYFP) expression under the control of Vegfr2/Flk1 regulatory sequences (Flk1-H2B-EYFP) 12. Because of the strong and persistent Flk1 transgene promoter activity in the glomerular endothelium of the adult kidney 15, 16, prominent EYFP signal was detected in the glomeruli, which co-localized with CD31 (Figure 1A), but not with WT-1 or vimentin 13. We isolated a pure population of viable EYFP+ cells from dissociated glomerular cells using fluorescence-activated cell sorting (FACS), which showed highly enriched in endothelial cell marker expression, but lacked those of podocytes and other cell types (Figure 1B–C). In fact, because of its intense nuclear EFYP signal, we found that the Flk1-H2B-EYFP was a superior model for effective GEC isolation in comparison to mice expressing the VE-Cadherin-Cre recombinase 17 and IRG fluorescent Cre-reporter 18 transgenes (data not shown). Flk1-H2B-EYFP mice were further crossed with wildtype or with eNOS−/− mice to generate the experimental cohorts.
Figure 1. Isolation of glomerular endothelial cells from Flk1-H2B-EYFP mice.
(A) Kidney sections of Flk-1-H2B-EYFP mice were immunostained with antibodies against CD31 or WT-1 and counterstained with DAPI. Scale bar: 20μm. Rectangular area on the right panel is further magnified to visualize the colocalization of EYFP with CD31, but not with WT-1. (B) Single-cell suspension of isolated glomeruli from Flk1-H2B-EYFP mice was subjected to fluorescence-activated cell sorting (FACS) for EYFP+ cells. Typical FACS profile is shown. Approximately 15.7% EYFP+ GECs are obtained from dissociated glomerular cells. (C) Real-time PCR analysis of endothelial-specific or podocyte-specific genes show a robust enrichment of endothelial cell markers (Cdh5, Pecam1, and Icam1) in EYFP+ fraction, but were depleted of podocyte (Nphs1, Nphs2, and synaptopodin) and tubular cell (Pax8) markers as compared with EYFP- fraction.
Generation of diabetic mice with Flk1-H2B-EYFP labeled GECs
Diabetes was induced by injections of low dose streptozotocin in 8-week old wildtype Flk1-H2B-EYFP mice (STZ-WT) and in Flk1-H2B-EYFP;eNOS−/− mice (STZ-eNOS−/−) as described previously 10. Citrate vehicle-injected wildtype (Vehicle-WT) and vehicle-injected eNOS−/− mice (Vehicle-eNOS−/−) served as respective controls. All mice were sacrificed at 10 weeks post-injection. Diabetes induction led to significant albuminuria, glomerular hypertrophy, and mesangial expansion in both STZ-WT and STZ-eNOS−/− mice as compared to respective nondiabetic controls (Supplemental Figure 1A–C). As anticipated, further exacerbations of all parameters were observed in STZ-eNOS−/− compared to STZ-WT mice (Supplemental Figure 1A–C).
We first checked to ensure that the diabetes induction did not affect the glomerular expression of Flk1, potentially altering the EYFP transgene expression. Determination of Flk1 expression in RNA-seq data of isolated glomeruli from our previous study 10 indicated that there were no detectable changes in Flk1 expression between control and diabetic mouse glomeruli (Supplemental Figure 2A). We further verified this by quantitative real-time PCR (qPCR) of isolated glomeruli from mice in the current study (Supplemental Figure 2B). In addition, Flk1 expression was not significantly altered in the glomeruli of three other previously reported diabetic murine models 8 (Nephroseq.org) (Supplemental Figure 2C). Thus, changes in gene expression profiles in isolated EYFP+ cells can be directly attributed to diabetes-induced changes in GECs.
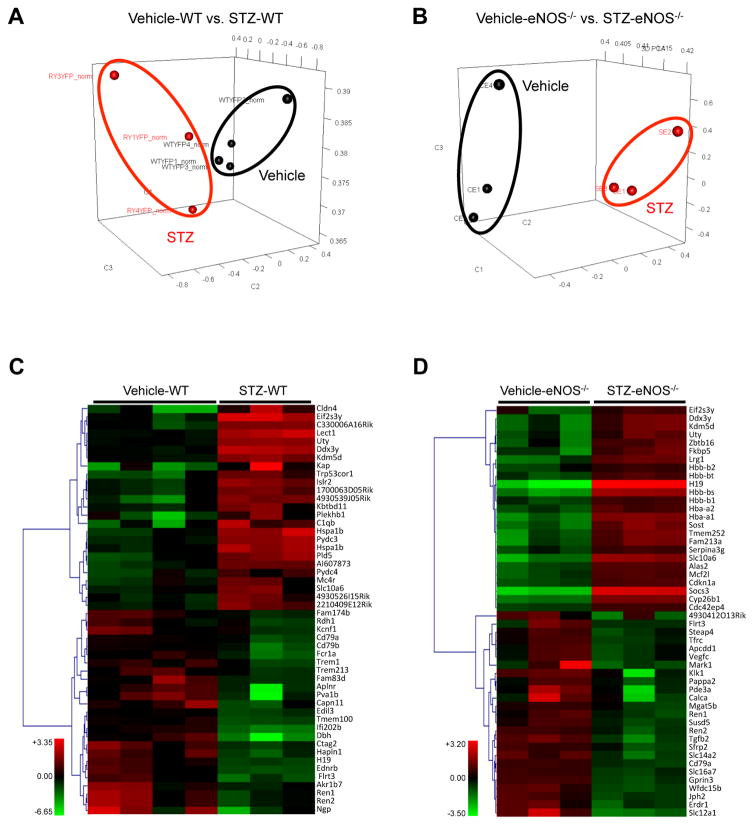
RNA-seq of isolated GECs from diabetic and nondiabetic mice was performed with 3 to 4 samples per experimental group, where each sample consisted of pooled GECs from 4 mice, such that each group consisted of GECs from 12 or 16 mice in total. Principal component analysis demonstrated that the GEC gene expression profiles exhibited distinct patterns between diabetic and control mice (Figure 2A–B). Figure 2C and 2D shows the heatmap of the top 50 differentially expressed genes in GECs of diabetic mice in comparison to their nondiabetic controls. Similar to what we had observed in our previous comparison of DEGs of podocytes vs. glomeruli 10, the gene expression pattern in GECs were distinct from that of whole glomeruli in diabetic mice (Table 1), further indicating that the direct evaluation of GEC gene expression is an important step in elucidating the molecular changes occurring specifically in GECs during diabetic injury.
Figure 2. PCA and heatmap of RNA-seq data from diabetic and control GECs.
(A, B) Principal-component analysis (PCA) of RNA-seq results comparing STZ-WT vs. Vehicle-WT (A) and STZ-eNOS−/− vs. Vehicle-eNOS−/− (B) GECs. (C, D) Heat-map of top 50 differentially expressed genes between STZ-WT vs. Vehicle-WT (C) and STZ-eNOS−/− vs. Vehicle-eNOS−/− (D) GECs.
Table 1.
Number of DEGs in diabetic eNOS−/− mice compared to nondiabetic controls in glomeruli, podocytes, and GECs and number of overlapping DEGs between glomeruli and podocytes or GECs.
| # DEGs in diabetic eNOS−/− vs. non-diabetic eNOS−/− | # DEGs overlapping with glom DEGs | |
|---|---|---|
| Whole glomeruli* | 1872 | |
| Podocytes* | 1417 | 78 (4.17% of glom DEGs) |
| GECs | 849 | 124 (6.62% of glom DEGs) |
Data from Fu et al. 2016.
Differentially enriched pathways are observed in diabetic GECs
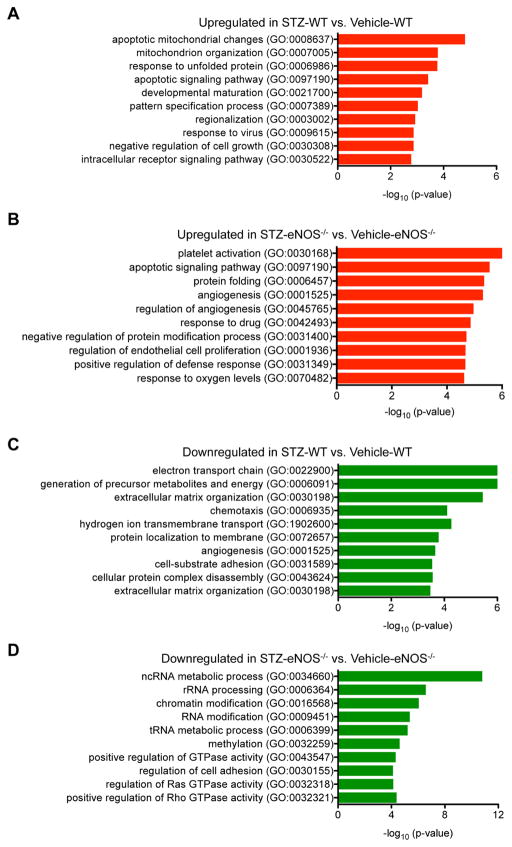
We then asked whether differentially expressed genes (DEGs) in GECs of the diabetic mice in comparison to their respective nondiabetic controls (Supplemental Excel Files 1) represented specific Gene Ontology (GO) pathways using the Enrichr 19 and the Database for Annotation, Visualization and Integrated Discovery (DAVID) 20. The pathway analysis showed that the upregulated genes in GECs of STZ-WT versus vehicle-WT were highly enriched in the regulation of apoptosis, mitochondrion organization, protein folding, and cell growth (Figure 3A; Supp. Table 1). Upregulated genes in GECs of STZ-eNOS−/− versus vehicle-eNOS−/− were also highly enriched in regulation of apoptosis and protein folding, but additionally were enriched in the pathways of angiogenesis and responses to oxygen (Figure 3B; Suppl. Table 2).
Figure 3. Gene set enrichment analysis comparing GECs from diabetic vs. control mice.
DEGs were examined for their known biological functions and grouped in the respective functional category using DAVID and Enrichr analyses. Similar results were obtained between the two analyses, and results from Enrichr analysis is shown. (A, B) GO terms of upregulated genes in diabetic mouse GECs: GO terms of upregulated genes in STZ-WT vs. Vehicle-WT (A), and GO terms of upregulated genes in STZ-eNOS−/− vs. Vehicle-eNOS−/− (B). (C, D) GO terms of downregulated genes diabetic mouse GECs: GO terms of dowregulated genes in STZ-WT vs. Vehicle-WT (C), and GO terms of downregulated genes in STZ-eNOS−/− vs. Vehicle-eNOS−/− (D). Significance is expressed as a p-value calculated using the Fisher’s exact test (p<0.05) and shown as -log10 (p-value).
The downregulated pathways enriched in GECs of STZ-WT versus vehicle-WT were in the regulation of electron transport chain, extracellular matrix organization, and angiogenesis (Figure 3C, Suppl. Table 3), while the downregulated genes in GECs of STZ-eNOS−/− versus vehicle-eNOS−/− were highly enriched in epigenetic regulation and small GTPase signal transduction (Figure 3D; Suppl. Table 4). It is notable that the downregulated genes were enriched in angiogenesis regulation in STZ-WT GECs, whereas in the STZ-eNOS−/− GECs it was the upregulated genes that were enriched for angiogenesis (Figure 3C and 3D; Suppl. Tables 3 and 4).
Contribution of eNOS-deficiency in diabetic GEC injury
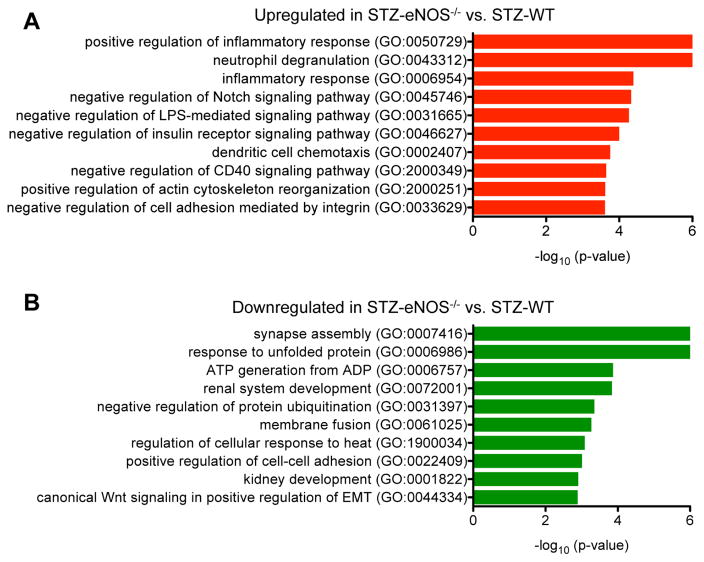
We next examined the contribution of eNOS-deficiency in diabetic GEC injury by two different approaches of gene expression analysis. First, we analyzed the differentially expressed genes in STZ-eNOS−/− in direct comparison to STZ-WT (Figure 4; Suppl. Tables 5 and 6; Supplemental Excel File 2). Second, we took the genes that were differentially expressed in STZ-eNOS−/− versus vehicle control and compared them with differentially expressed genes in STZ-WT versus its vehicle control (Figure 5; Suppl. Tables 7–10). In the first approach of direct comparison of the gene expression profiles of the two diabetic mouse models, we found that the upregulated genes in STZ-eNOS−/− were highly involved in the regulation of inflammatory responses and actin cytoskeleton reorganization (Figure 4A; Suppl. Table 5), whereas the downregulated genes were involved in regulation of protein folding, cell adhesion, and Wnt signal transduction (Figure 4B; Suppl. Table 6). These results suggest that eNOS deficiency further augments inflammatory responses and cytoskeletal dysregulation in GECs during diabetic injury.
Figure 4. Comparison of STZ-eNOS−/− vs. STZ-WT GECs.
(A, B) GO terms of upregulated genes (A) or downregulated genes (B) in direct comparison of STZ-eNOS−/− vs. STZ-WT GECs. Significance is expressed as a p-value calculated using Fisher’s exact test (p<0.05) and shown as -log10 (p-value).
Figure 5. Comparison of DEGs between STZ-eNOS−/− vs. STZ-WT GECs.
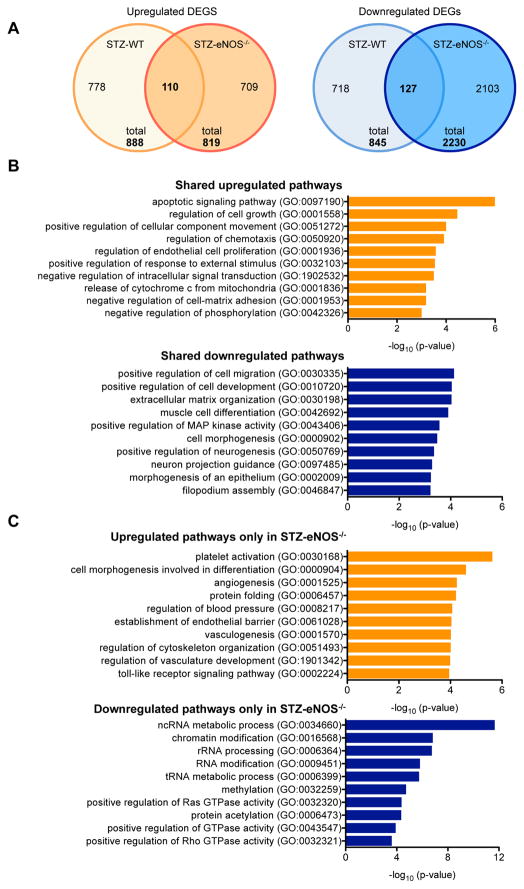
(A) Number of upregulated (left) and downregulated (right) DEGs in two diabetic mouse models in comparison to their respective vehicle controls are shown in a Venn diagram. Total number of DEGs is shown on the bottom, and the number of overlapping genes is shown in the overlapping regions. (B) Gene set enrichment analysis of overlapping genes between DEGs[STZ-eNOS−/− vs. Vehicle-eNOS−/−] versus DEGs[STZ-WT vs. Vehicle-WT]. (C) Gene set enrichment analysis of DEGs[STZ-eNOS−/− vs. Vehicle-eNOS−/−] that do not overlap with DEGs[STZ-WT vs. Vehicle-WT]. Significance is expressed as a p-value calculated using Fisher’s exact test (p<0.05) and shown as -log10 (p-value).
In the second approach of comparing the DEGs of the two diabetic models relative to their respective vehicle controls, we found 110 upregulated and 127 downregulated genes that overlapped between the DEGs of STZ-WT and STZ-eNOS−/− mice; we also observed that there were 709 upregulated and 2,103 downregulated DEGs found only in STZ-eNOS−/− mice in comparison to its vehicle control (Figure 5A). Pathway analysis revealed that the shared upregulated DEGs in the two diabetic models were enriched for regulation of apoptosis, proliferation, chemotaxis, and oxidative stress (Figure 5B; Suppl. Table 7), while the shared downregulated DEGs were largely involved in extracellular matrix organization, cell migration and morphogenesis (Figure 5B; Suppl. Tables 8). Analysis of DEGs found only in the STZ-eNOS−/− mice showed that the upregulated genes were enriched in regulation of angiogenesis and cytoskeletal organization, whereas the downregulated genes were highly enriched in epigenetic regulation and small G protein activation (Figure 5C, Suppl. Tables 9–10). Together, these findings suggest that the early diabetic injury in GECs is characterized by apoptosis, proliferation, and oxidative stress in GECs, and that eNOS-deficiency additionally leads to altered epigenetic regulation and to augmented angiogenic and inflammatory responses. These results are consistent with the greater extent of endothelial dysfunction in DN with eNOS-deficiency and may account for the significantly worsened glomerular injury in STZ-eNOS−/− mice compared to STZ-WT mice (Supplemental Figure 1B–C).
Validation of altered pathways in GECs of diabetic mice
We next sought to validate some of the key observations of the transcriptomic analysis by in vivo and in vitro approaches using an additional set of diabetic and control mice (n=7 in each group) and with immortalized mouse GECs that were established from Flk1-H2B-EYFP mice, as described in the Methods.
Oxidative stress, apoptosis, and proliferation in diabetic GECs
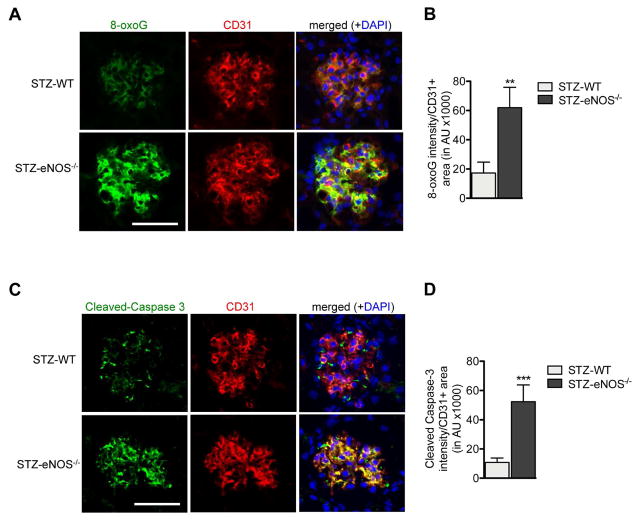
Gene expression analysis demonstrated that pathways regulating oxidative stress, apoptosis, and proliferation were significantly altered in GECs of both mild and advanced DN mouse models. Consistent with this, we detected a significant level of 8-oxoguanine (8-oxoG), a marker of oxidative stress-induced DNA injury that overlapped with CD31 in the glomeruli of both diabetic mouse models (Figure 6A). Furthermore levels of 8-oxo-G were significantly increased in STZ-eNOS−/− in comparison to STZ-WT GECs (Figure 6A–B), indicating that eNOS-deficiency may worsen the extent of diabetes-induced oxidative stress injury in GECs. Similarly we detected significant levels of cleaved Caspase-3 that largely overlapped with CD31 in glomeruli in both diabetic models. Again, the Caspase-3 expression was higher in GECs of STZ-eNOS−/− mice than in STZ-WT mice (Figure 6C–D), indicating a greater extent of apoptosis in STZ-eNOS−/− GECs. Detection of apoptotic cells by TUNEL labeling further confirmed these observations (Suppl. Figure 3).
Figure 6. Augmented oxidative stress and apoptosis in GECs of diabetic eNOS−/− mice.
(A, B) Representative images of 8-oxoG and CD31 immunofluorescence in glomeruli of STZ-WT and STZ-eNOS−/− mice (A) and semi-quantification of 8-oxoG intensity per CD31+ area (B). (C, D) Representative images of cleaved Caspase-3 and CD31 immunofluorescence in glomeruli of STZ-WT and STZ-eNOS−/− mice (C) and semi-quantification of cleaved Caspase-3 intensity per CD31+ area (D). Scale bar: 50μm. Results are mean±SEM of at least 60 glomeruli evaluated per mouse (n=3 mice for STZ-WT and n=5 for STZ-eNOS−/− mice).
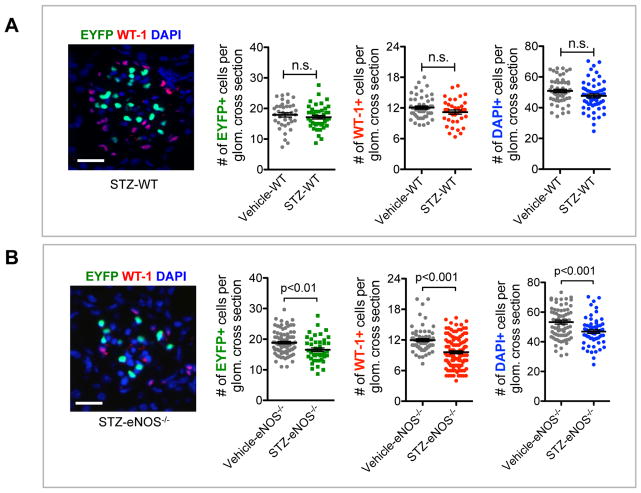
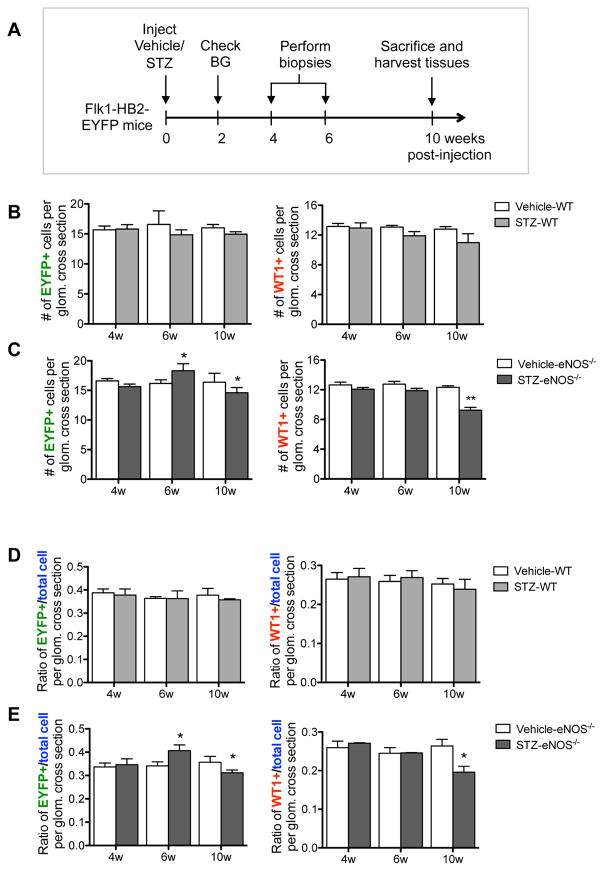
Because genes in the proliferation and apoptosis pathways were both upregulated in diabetic GECs, we next determined whether these alterations would affect the net number of GECs in DN. Number of GECs were ascertained by number of EYFP+ cells per glomerular cross section, and number of podocytes were similarly ascertained by WT-1-immunoreactivity in control and diabetic mice (Figure 7). As to be expected in the mild DN injury in C57BL/6 strain 21, we did not detect a significant change in the number of GECs or podocytes in STZ-WT mice in comparison to the vehicle controls at 10 weeks of DM (Figure 7A). In contrast, a significant reduction in both cell types was observed in the glomeruli of STZ-eNOS−/− mice compared to the vehicle-eNOS−/− mice, which was also reflected in decrease in total glomerular cell number, ascertained with DAPI nuclear stain. As the data showed a net loss of GECs and podocytes only in the STZ-eNOS−/− mice at 10 weeks of DM, we next sought to assess the changes occurring over time in GECs and podocytes. We therefore performed serial biopsies at 4 and 6 weeks and compared the results with 10 weeks in a separate experimental group of mice (Figure 8A). Quantification was performed two ways: One, we evaluated the number of both EYFP- or WT-1-positive cells per glomerular cross section (Figure 8B–C); and two, we evaluated the ratio of EYFP- or WT-1-positive cells per total glomerular cells (Figure 8D–E), as the total number of glomerular cells was also reduced at 10 weeks in STZ-eNOS−/− mice (Figure 7B). Both quantification methods showed similar results: in STZ-WT glomeruli, GEC and podocyte numbers remained relatively constant throughout the course of 10 weeks (Figure 8B, D), while in STZ-eNOS−/− glomeruli, an increase in GECs was observed at 6 weeks of DM, which was then followed by a greater loss by 10 weeks (Figure 8C, 8E). In contrast to GECs, podocytes numbers of STZ-eNOS−/− mice did not change during 4 or 6 weeks, but significantly decreased by 10 weeks of DM, coinciding with the GEC loss (Figure 8C, 8E). These results were further supported by marked increase in Ki-67 and EYFP double-positive cells initially at 4 weeks of DM, but a decline by 10 weeks in the glomeruli of diabetic eNOS−/− mice (Suppl. Figure 4A–B). We did observe, however, that total Ki-67+ cells (mostly EYFP- cells) in the glomeruli steadily increased over time (Suppl. Figure 4A, C). However, as there was an overall glomerular cell loss at 10 weeks of DM in diabetic eNOS−/− mice (Figure 7B), it appears that the loss of podocytes and GECs are greater than the overall proliferation occurring in EYFP- glomerular cells. Together, our data suggest that while proliferation and apoptosis responses are triggered at the mRNA levels in GECs of both diabetic models, the magnitude of the outcome of these responses are significantly greater in diabetic eNOS−/− mice to result in their net gain and loss during the course of DN.
Figure 7. Decreased GEC and podocyte numbers in glomeruli of diabetic eNOS−/− mice.
Representative images of WT-1 immunostaining and EYFP signal in glomeruli of diabetic mice. Scale bar: 25μm. Quantification of the number of EYFP-positive cell nuclei representing endothelial cells, WT1-positive cell nuclei representing podocytes, and the number of total glomerular cells (DAPI+) in Vehicle-WT and STZ-WT mice (A) and in Vehicle-eNOS−/− and STZ-eNOS−/− mice (B) at 10 weeks post-injection of either citrate buffer or STZ. Results are mean±SEM of at least 60 glomeruli evaluated per mouse (n=3 per group). n.s., not significant.
Figure 8. Quantification of GEC and podocyte numbers over time during the early diabetic injury.
(A) Experimental design for time course study. Serial biopsies were performed at 4 and 6 week post STZ-injection and compared with 10 weeks post STZ-injection in both WT and eNOS−/− mice. (B, C) Quantification of EYFP+ cells (left) vs. WT-1+ cells (right) per glomerular cross section in STZ-WT vs. vehicle-WT mice (B) and in STZ- eNOS−/− vs. vehicle-eNOS−/− mice (C). (D, E) Ratio of EYFP+ cells (left) and WT-1+ cells (right) per total DAPI+ cells per glomerular cross section in STZ-WT vs. vehicle-WT mice (D) and in STZ- eNOS−/− vs. vehicle-eNOS−/− mice (E). Results are mean ±SEM of at least 40 glomeruli evaluated per group (n=7 mice per group). *P<0.05 and **P<0.01 when compared to the respective vehicle control at each time point.
Altered angiogenesis and epigenetic regulation in diabetic eNOS−/− GECs
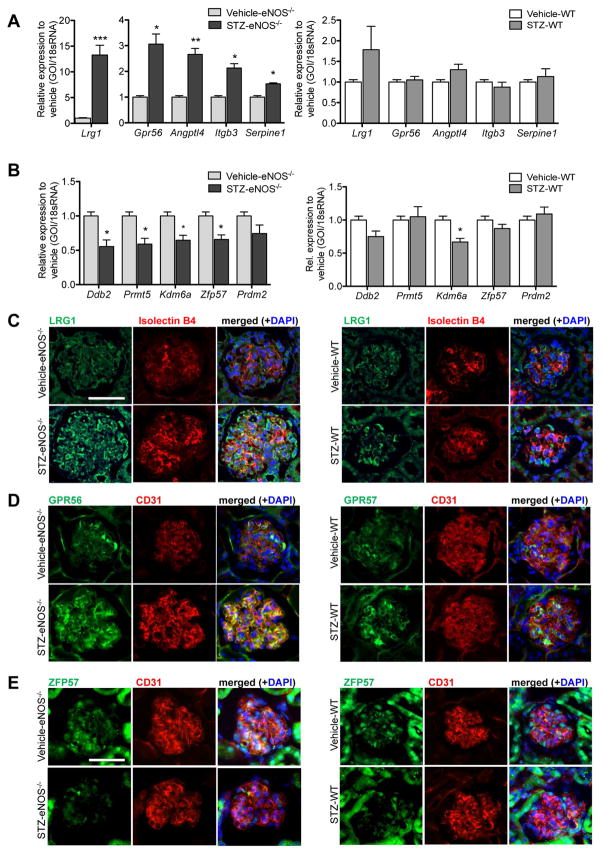
Transcriptomic analysis indicated that angiogenesis and epigenetic regulation were significantly altered in GECs of STZ-eNOS−/− in comparison to vehicle controls, which was not observed in WT-STZ GECs in comparison to its respective vehicle control (Figure 5C; Suppl. Table 9–10). Therefore, we next examined the change in expression of several of the genes from each pathway by qPCR analysis of isolated GECs from diabetic and control mice at 10 weeks of DM. Consistent with the transcriptomic analysis, expression of the selected genes in the angiogenesis pathway were indeed upregulated in STZ-eNOS−/− GECs, while they remained relatively unchanged in STZ-WT GECs (Figure 9A). Similarly, selected genes of the epigenetic pathways were significantly downregulated STZ-eNOS−/− GECs (Figure 9B).
Figure 9. Validation of genes involved in angiogenesis and epigenetic regulation diabetic eNOS−/− mice.
(A, B) Real-time PCR analysis of select genes in the angiogenesis GO term (Lrg1, Gpr56, Angptl4, Itgb3, and Serpine 1) in GECs of STZ-eNOS−/− mice (left panel) and in GECs of STZ-WT mice (right panel) relative to its respective vehicle control (n=3 mice per group, *P<0.05, **P<0.01, and ***P<0.001, when compared with vehicle-control). (B) Real-time PCR analysis of select genes in the epigenetic regulation GO term (Ddb2, Prmt5, Kdm6a, Zfp57, and Prdm2) in GECs of STZ-eNOS−/− mice (left panel) and in GECs of STZ-WT mice (right panel) relative to its respective vehicle control (n=3 mice per group, *P<0.05, when compared with vehicle-control). (C–E) Representative images showing immunostaining of LRG1 (C), GPR56 (D), or ZFP57 (E) in the glomeruli of STZ-eNOS−/− (left panel) or in STZ-WT (right panel) mice.
Among the selected genes in the angiogenesis pathway (Figure 9A), we further selected two genes, i.e. leucine rich alpha-2-glycoprotein-1 (Lrg1) and G-protein coupled receptor-56 (Gpr56), that are known to be involved in angiogenesis 22–25, but have not yet been evaluated in DN. LRG1 is a secreted glycoprotein that potentiates the non-canonical pathway of TGF-β signaling pathway via activation of ALK1 receptor in endothelial cells to promote angiogenesis 22, 26. GPR56 is a member of the adhesion G protein-coupled receptor (GPCR) family of proteins, which regulates PKCα to stimulate VEGF production, thereby regulating angiogenesis 25, 27. Among the genes regulating epigenetic pathways (Figure 9B), we selected zinc-finger protein-57 homolog (Zfp57), a gene necessary to maintain genomic imprinting in embryonic stem cells 28 and to modulate Notch signaling in cardiac development 29. Interestingly, mutations in ZFP57 were reported to be associated with transient neonatal diabetes mellitus type 1 (TNDM1) 30, 31.
Supplemental Figure 5 shows the normalized relative gene expression levels of Lrg1, Gpr56, and Zfp57 mRNAs from our transcriptomic analysis. Significant changes in gene expression in all three genes were found in STZ-eNOS−/− GECs, and although not statistically significant, similar trend in gene expression was observed in STZ-WT GECs. Consistently, both LRG1 and GPR56 immunofluorescence that co-localized with endothelial marker (isolectin B4 or CD31) was significantly elevated in STZ-eNOS−/− glomeruli in comparison to the vehicle controls (Figure 9C–D, left panels). A mild increase of LRG1 and GPR56 was also observed in STZ-WT glomeruli (Figure 9C–D, right panels). Conversely, the expression of ZFP57 immunofluorescence that co-localized with CD31 was significantly diminished in glomeruli of both diabetic mouse models compared to vehicle controls, but more markedly so in the STZ-eNOS−/− mice (Figure 9E).
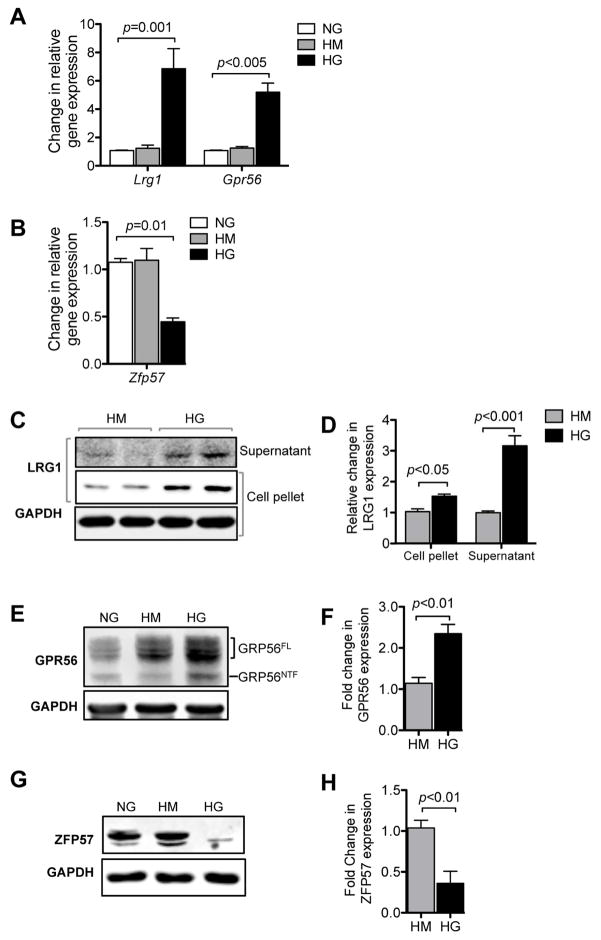
In order to further explore the mechanism of altered expression of Lrg1, Gpr56 and Zfp57 in GECs under diabetic conditions and to interrogate their function, we next performed in vitro experiments using the immortalized GEC line (mGEC) established from sorted EYFP+ GECs from Flk1-HB2-EYFP mice, as described in Methods. Exposure of mGECs to high glucose conditions significantly elevated the mRNA expression of Lrg1 and Gpr56 (Figure 10A), and diminished the expression of Zfp57 mRNA (Figure 10B). Consistently, high glucose treatment led to the increase in both secreted and cellular LRG1 protein (Figure 10C). GPR56 protein, which in its mature form undergoes autocatalytic cleavage 27, was also upregulated in response to high glucose (Figure 10D). Conversely, high glucose exposure led to the marked downregulation of ZFP57 protein (Figure 10E). Together these results suggest that hyperglycemia per se may be one mechanism of their altered expressions in GECs during early DN.
Figure 10. High glucose induces alteration in Lrg1, Gpr56 and Zfp57 expression in mGECs in vitro.
(A) Real-time PCR analysis of Lrg1 and Gpr56 in mGECs under high mannitol (HM) or high glucose (HG) conditions relative to normal glucose (NG) control (n=3). (B) Real-time PCR analysis of Zfp57 in mGECs under high mannitol (HM) or high glucose (HG) conditions relative to normal glucose (NG) control (n=3). (C, D) Representative Western blot image (C) and densitometric analysis (D) of LRG1 expression and under high glucose conditions in mGECs. Increased LRG1 expression is detected in the supernatant (secreted) and in cells under high glucose conditions. (E, F) Representative western blot image (E) and densitometric analysis (F) of GRP56 expression under high glucose conditions in mGECs. Increased full-length GPR56 (GPR56FL) and mature cleaved N-terminal fragment (GPR56NTF) are both detected in response to high glucose. (G, H) Representative Western blot image (G) and densitometric analysis of ZFP57 expression in mGECs under high glucose conditions. All experiments were repeated at least three times.
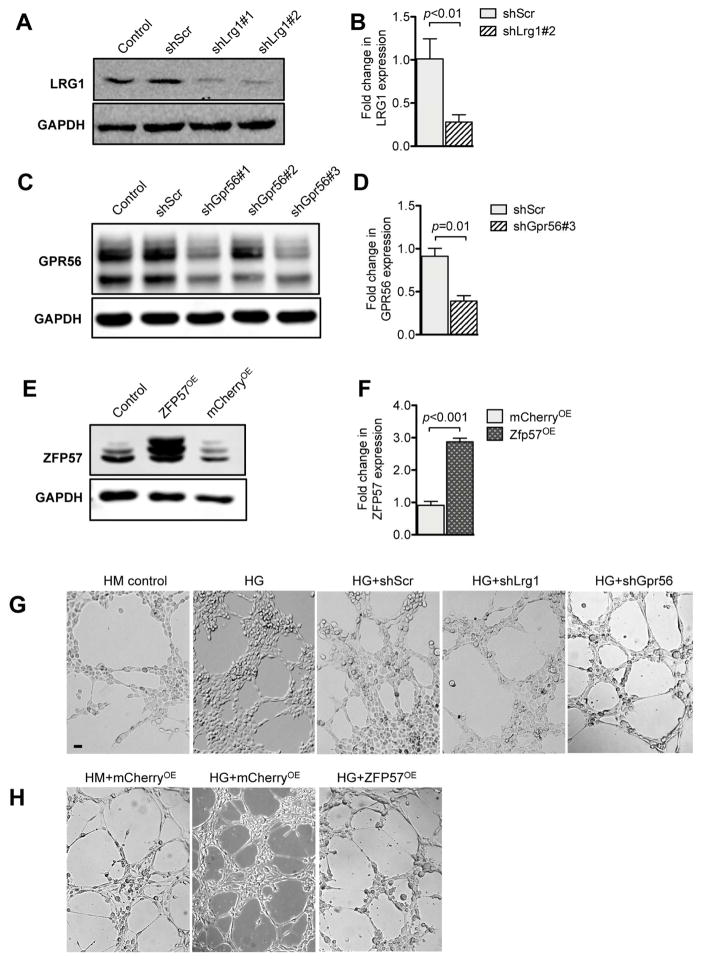
We next interrogated effects of normalized expressions of Lrg1, Gpr56 and Zfp57 under high glucose conditions. We employed the lentivirus-mediated shRNA knockdown approach for restoration of Lrg1 and Gpr56 expression, and overexpression approach for restoration of Zfp57 expression. Figure 11A–D shows the knockdown efficiencies of Lrg1 or Gpr56 shRNAs in comparison to scrambled shRNA control. Figure 11E shows the overexpression of ZFP57 in comparison to unrelated red fluorescent protein mCherry overexpression control. Because both LRG1 and GPR56 are implicated in regulation of angiogenesis, we examined the effects of their reduced expression with the in vitro angiogenesis assay. In addition, since ZFP57 is essential for Notch signaling required for cardiac development in mouse embryos 29, and Notch signal transduction has been shown to limit angiogenic behavior of endothelial cells 32–34, we explored whether the restoration of ZFP57 expression may also affect angiogenesis in vitro. Consistent with the previous reports of high glucose-mediated endothelial dysfunction 35, 36, high glucose treatment led to increased endothelial tube formation in comparison to control mannitol treatment, while the knockdown of Lrg1 or Gpr56 significantly attenuated this effect (Figure 11F). In a similar manner, the high glucose-induced endothelial tube formation was significantly blunted by overexpression of ZFP57 (Figure 11G), suggesting that the decreased epigenetic regulation by ZFP57 may contribute to increased angiogenic behavior of GECs in diabetic conditions. Whether Lrg1, Gpr56, or Zfp57 are involved in diabetic GEC injury in vivo will need to be explored in detail in future studies.
Figure 11. Restoration of LRG1, GPR56 and ZPF57 expression limits high glucose-induced angiogenesis in vitro.
(A, B) Representative western blot image (A) and densitometric analysis (B) shows knockdown efficiencies of lentivector expressing shRNA against Lrg1 (shLrg1#1 and shLrg1#2) in comparison to scrambled shRNA (shScr) or uninfected cells (control). (C, D) Representative western blot image (C) and densitometric analysis (D) shows the knockdown efficiencies of lentivector expressing shRNA against Gpr56 (shGpr56#1, shGpr56#2 and shGpr56#3) in comparison to scrambled shRNA (shScr) or uninfected cells (control). (E, F) Representative western blot image (E) and densitometric analysis shows the expression of ZFP57 in mGECs transduced with lentivirus expressing ZFP57 (ZFP57OE) or unrelated mCherry protein (mCherryOE) in comparison to uninfected cells (control). All experiments were repeated at least three times. (G–H) In vitro angiogenesis assay. mGECs exposed to high glucose or were seeded into the 8-well multiwall chamber slides coated with matrigel. Images were taken 6 hours post-plating. Scale bar: 50μm. The effects of Lrg1 or Gpr56 knockdown on angiogenesis in vitro are shown in (G), and the effects of ZFP57OE is shown in (H).
Taken together, these results provide the proof of concept that individual genes of the altered pathways may have important contributions in GEC injury during early DN. Thus, further in-depth analysis of the potential candidate genes in each of the altered pathways, such as the role of Lrg1 and Gpr56 in angiogenesis, is warranted for potential therapeutic targeting to mitigate the GEC injury and the progression of DN.
DISCUSSION
Although the research on the role of podocyte injury in DN has advanced significantly over the past decade, the studies of GEC injury in DN have been relatively sparse in comparison. Several lines of evidence suggest that GEC injury may precede podocyte injury in DN 4, 10, 37, and thus a better understanding of GEC injury, particularly in the early stages of DN, is required for potential therapeutic strategies against DN progression. Previous gene expression studies of total glomerular cells from diabetic human and mouse kidneys have provided important insight into DN injury. However, our recent study 10 and work by others 38 suggest that these profiles provide limited information on molecular changes occurring in discrete subset of glomerular cells. In this study, in order to interrogate the changes in gene expression profile specifically in GECs during early diabetic injury, we performed a transcriptomic analysis of GECs isolated from control and diabetic mice by taking advantage of the Flk1-H2B-EYFP transgenic mouse model 12. Due to the high Flk1 expression in the glomeruli, prominent nuclear EYFP expression was observed in the glomerular endothelial cells in adult kidneys 13, making it a valuable tool in isolation of viable GECs, as well as for GEC quantitation in vivo. As Flk1-H2B-EYFP mice were in B6 background, we have induced diabetes using streptozotocin in wildtype (STZ-WT) and eNOS-deficient (STZ-eNOS−/−) mice, to represent mild and more advanced DN, respectively, for comparisons of gene expression profiles of GECs in diabetic versus nondiabetic mice, as well as for comparative analysis between the mild versus advanced DN models.
The pathway analysis of differentially expressed genes in GECs of STZ-WT versus vehicle-WT showed that many of the upregulated genes were involved in cell growth and protein folding, suggesting that these processes may contribute to the mechanisms by which GECs recover from injury. Interestingly, many of the downregulated genes were involved in the angiogenesis pathway. In contrast, upregulated genes in GECs from STZ-eNOS−/− versus vehicle-eNOS−/− were largely involved in oxidative stress response and angiogenesis, suggesting that increased oxidative stress and angiogenesis may determine the extent of early DN pathogenesis in diabetic eNOS-deficient glomeruli. Notably, our previous transcriptomic analysis of isolated podocytes and of intact glomeruli from diabetic and control eNOS−/− mice indicated that significantly altered genes in podocytes of diabetic eNOS−/− mice were related to changes in actin organization of the actin cytoskeleton, while the altered genes of the glomeruli were related to mitochondrial function and oxidative stress pathways 10, with little overlap between the profiles of podocytes and glomeruli. Our results now indicate that genes in the oxidative stress pathway are highly represented in GECs of diabetic mice, particularly in STZ-eNOS−/− mice, suggesting that the increased oxidative stress detected in the diabetic glomeruli may be largely due to the dysregulated oxidative stress in GECs. Indeed, marked increase in the presence of 8-oxoG that overlapped with CD31 immunofluorescence in the glomeruli of STZ-eNOS−/− in comparison to STZ-WT glomeruli is consistent with these observations. In addition, we observed that the number of GECs in STZ-eNOS−/− mice initially increased but subsequently declined over time. These data strongly suggest that GECs may be increased initially due to significant angiogenesis at the early stage of DN in STZ-eNOS−/− mice. However, with further progression of DN a greater loss of GECs ensues over time. Even though neoangiogenesis may persist in the glomeruli of the diabetic mice, this may be insufficient to replace the endothelial cell loss, therefore resulting in the net loss of GEC that we observed. Furthermore, the increased severity of GEC injury and loss in STZ-eNOS−/− mice was also accompanied by greater loss of podocytes and correlated with exacerbation of proteinuria and enhanced glomerular injury in comparison to STZ-WT mice. The loss of podocytes could also contribute to the loss of GECs through reduced podocyte production of VEGF-A necessary for GEC survival. This could lead to a vicious cycle of GEC and podocyte loss contributing to DN progression. Therefore, combined therapeutic approach of targeting early GEC and podocyte injuries may be necessary to thwart the progression of DN.
Many of the downregulated DEGs in STZ-eNOS−/− mice were involved in epigenetic regulation and in small G-protein regulation, neither of which were observed in GECs of STZ-WT mice. Recent studies indicate that histone modification, DNA methylation, and long non-coding RNA all play critical roles in DN 39–42. Our earlier study showed that epigenetic regulation is a key feature in podocytes of diabetic eNOS−/− mice 10, and our current study indicate that the dysregulated epigenetic program may also be an important factor contributing to GEC injury or repair process at early stage of DN.
As a proof of concept for the alterations in angiogenesis and epigenetic regulation in GECs in advanced DN injury, we selected few genes for further functional analysis. We selected Lrg1, Gpr56, and Zfp57, as their roles in kidney disease has not yet been explored. Using in vitro approaches, our results indicate that high glucose conditions increase LRG1 and GPR56 mRNA and protein levels, while it decreases those of ZFP57. Functional assays using immortalized mGECs showed that the reduction in LRG1 and GPR56 expression abrogated high glucose-induced angiogenesis in vitro. Overexpression of ZFP57 similarly hindered the high glucose-induced angiogenesis. Further detailed examinations of LRG1, GPR56, and ZFP57 functions are needed to delineate their roles in early DN injury, as well as to examine the other candidate genes in the altered pathways. We will pursue the comprehensive in vitro and in vivo analysis of these and other potential candidate genes in GEC injury in our future studies.
There are several limitations to our study. First, in our model the expression of EYFP in GECs is controlled by elements of the Flk1 promoter that might be affected by diabetes. However, expression of the endogenous Flk1 gene was not changed at early stage of DN in our current models or in other animal models of DN and in human DN (Nephroseq.org). Second, the digestion of glomeruli and FACS sorting of GECs could affect gene expression. Therefore, we used a well-defined digestion and sorting protocol that optimized for the viability of GECs, which were applied to all samples. Third, cost considerations forced us to limit the number of samples for RNA sequencing in each group of mice. Therefore, we pooled GECs from 4 mice per sample, such that 3 samples in each group represent GECs from 12 mice. Lastly, as aforementioned many of the genes identified by RNA-seq will require further investigation using experimental DN models to validate their individual roles in GEC injury in DN. However, such studies are beyond the scope of the current report.
In conclusion, our transcriptomic analysis of GECs from diabetic mice indicates major alterations in pathways that regulate apoptosis, oxidative stress, cell migration, and proliferation during early DN. It also highlights specific pathways, such as angiogenesis regulation, that might contribute to the accelerated progression of DN. We believe that our transcriptomic profiles specifically from GECs of diabetic mice can serve as a valuable resource for investigators in the field of DN for further exploration of specific genes involved in GEC dysfunction in early DN.
MATERIAL AND METHODS
Generation of diabetic endothelial EYFP transgenic mice
Animal studies were performed in accordance with the guidelines of and approved by the Institutional Animal Care and Use Committee at the Icahn School of Medicine at Mount Sinai (New York, NY). Mice were housed in a specific pathogen-free facility with free access to chow and water and a 12-hour day/night cycle. Breeding and genotyping was done according to standard procedures. Flk1-H2B-EYFP (EYFP) mice in C57BL/6 background 12 were a generous gift from Dr. Margaret Baron (Icahn School of Medicine at Mount Sinai). EYFP mice were crossed with eNOS−/− in C57BL/6 background (Jackson Laboratory) to generate EYFP;eNOS−/− mice. For induction of diabetes, EYFP;eNOS+/+ and EYFP;eNOS−/− mice at 8 weeks of age were injected over 5 consecutive days with low-dose STZ (50μg/g body weight per day intraperitoneally; Sigma-Aldrich, St Louis, MO). Body weight and fasting blood glucose levels were monitored biweekly by glucometer readings. Diabetes was confirmed by fasting blood glucose level > 300mg/dl. The age- and sex-matched littermates injected with citrate vehicle served as non-diabetic controls. Urine samples were collected biweekly. The mice were sacrificed at 10 weeks post-induction of diabetes.
Isolation of glomeruli and sorting of GECs
Glomeruli were isolated by Dynabead perfusion and cells were dissociated as described previously 10. Briefly, animals were perfused with 8ml bead solution and 2ml bead solution with enzymatic digestion buffer containing collagenase type II 300U/ml, pronase E (1mg/ml) and Dnase I (50μg/ml), which was pre-warmed at 37°C. At the end of perfusion, kidneys were removed, decapsulated, minced into 13mm3 pieces, and digested in 3ml digestion buffer at 37 °C for 15min on a rotator (100 rpm). Digested tissue was then passed through a 100-μm cell strainer and collected by centrifugation. The pellet was resuspended in 23ml of Hanks’ buffered salt solution and glomeruli were washed three times and collected using a magnet. Separated glomeruli were resuspended in 2 ml digestion buffer and incubated at 37°C for additional 40 minutes at 1400 rpm/min on a thermomixer. During the digestion period, the solution was vortexed every 10 minutes and sheared with a 27G needle every 15 min. The solution was then put on magnetic particle concentrator, and supernatants were pooled. The suspension was sieved through 40μm cell strainer and centrifuged at 1500rpm for 5 minutes at 4°C. After two-step approach for primary cell purification, single cells were resuspended in 0.5ml of HBSS supplemented with 2% fetal bovine serum, 25mM HEPES and 4′6-diamidino-2-phenylindole. Single-cell suspension was then sorted into EYFP-positive and EYFP-negative population with a BD Aria II cell sorter with a laser excitation at 488 nm and a sheath pressure of 30 psi. On average, 200,000 sorted GECs were obtained per mouse.
mRNA isolation for RNA sequencing
Total RNA was isolated from either isolated glomeruli or sorted GECs by using RNeasy mini kit (Qiagen 74104) according to the manufacturer’s protocol. RNAs of 4 mice were mice were pooled per sample. RNA concentrations were quantified using a Nano-drop Spectrophotometer at a wavelength of 260nm. RNA samples were then analyzed by Bioanalyzer at a concentration of 100–200 ng/ul to verify the concentration and the purity of samples. Only the samples with RNA integrity (RIN) values of >7.5 were used for mRNA sequencing at the CLC Genomics and Epigenomics Core Facility at Weil Cornell Medical College.
Bioinformatics Analysis of mRNA sequencing (RNA-seq) data
The RNA-seq data was analyzed by following the procedure described below. Briefly, after sequence quality filtering at a cutoff of a minimum quality score Q20 in at least 90% bases, the good quality reads were aligned to the University of California Santa Cruz (UCSC) Mus musculus reference genome and transcriptome (build mm10) using the Burrows-Wheeler Aligner (bwa) 43. The reads that are uniquely aligned to the exon and splicing-junction sites for each transcript were combined to calculate as expression level for a corresponding transcript and further normalized based on reads per kilobase per million reads (RPKM) 44 in order to compare transcription levels among samples. The transcripts with a low raw read count <100 in all the samples were excluded for downstream analysis. Gene expression value was transformed to the log2 base scale. Principal component analysis (PCA) was first performed to assess the sample correlations using the expression data of all the genes. The differentially expressed genes (DEGs) in diabetic mice compared to control mice were identified by the R package DEGseq for sorted GECs, and we selected the genes based on DEGseq adjusted p <0.05 and 1.5 fold change. The limma test 45 was applied for analysis of data in isolated glomeruli with a cutoff of p<0.05 and 1.5 fold change. The Gene Ontology and pathway analysis for the differentially expressed genes were then performed using INGENUITY© IPA (http://www.ingenuity.com/products/ipa) and online tool Enrichr 19. The read coverage of gene functional elements was also visualized by IGV tool (Integrative Genome Viewer, http://www.broadinstitute.org/igv/) from the genome alignment file. Heatmap analysis was performed for the top fold changed 50 differential expression genes with DEGseq test after median center transformed using Multi-Experiment Viewer software 46.
Measurement of urinary albumin/creatinine ratio
Urine albumin was quantified by ELISA using a kit from Bethyl Laboratories, Inc. (Houston, TX). Urine creatinine levels were measured in the same samples using QuantiChrom™ creatinine assay kit (DICT-500) (BioAssay Systems) according to the manufacturer’s instruction. The urine albumin excretion rate was expressed as the ratio of albumin to creatinine.
Kidney Histology
Mice were anesthetized intraperitoneally with ketamine-xylazine solution and perfused transcardially with 4% formaldehyde in PBS. Harvested kidney were post-fixed in 10% formalin, embedded in paraffin, and cut into 4μm sections. Periodic Acid-Schiff (PAS) stained sections were used for assessment of kidney histology. Assessment of the mesangial expansion was performed by pixel counts on a minimum of 15 glomeruli per section in a blinded manner, under 400x magnifications (Zeiss AX10 microscope, Carl Zeiss Canada, Toronto, ON, Canada). Morphometric analysis and quantification of mesangial expansion was determined using ImageJ (NIH) as previously described 13.
Immunofluorescence staining
Frozen and/or paraffin sections were used for immunofluorescence staining as described previously 10,13 using the following primary antibodies: WT-1 (sc-192Santa Cruz Biotechnology), CD31 (BDB550274, BD Biosciences), cleaved PARP (#ab32064, Abcam), cleaved Caspase-3 (#9664, Abcam), 8-oxoG monoclonal antibody (N45.1; Japan Institute for the Control of Aging), LRG1 (13224-1-AP, Proteintech), GPR56 (MABN310, Millipore), and ZFP57 (ab45341, Abcam). Isolectin GS-IB4 (121413, Invitrogen) was also used to detect endothelial cells. Fluorescence images were acquired using the Axioplan 2 IE microscope (Zeiss).
Quantification of Immunostaining
ImageJ 1.26t software was used to measure the level of immunostaining in the glomeruli. First, the 400x images were converted to 8-bit grayscale. Glomerular regions were selected for measurement of area and integrated density, and background intensity was measured by selecting three distinct areas in the background with no staining. The corrected optical density (COD) was determined as shown below:
where ID is the integrated density of the selected glomerular region, A is the area of the selected glomerular region, and MGV is the mean gray value of the background readings) 47.
Terminal Deoxynucleotidyl Transferase dUTP Nick-End Labeling (TUNEL) Measurement
For TUNEL labeling, frozen mouse kidney sections were washed once with PBS and incubated with blocking solution (10% horse serum, 1% BSA) for 1 hour at room temperature. After three washes with PBS for 5 min each, detection of DNA fragmentation was done using the In Situ Cell Death detection kit, TMR red (Roche Diagnostics) according to the manufacturer’s protocol. Sections were also stained with DAPI (MP Biomedicals).
Renal Biopsies
Renal biopsies were performed at 4 and 8 weeks of post STZ-injection in diabetic and in control mice. Ketamine (70 mg/kg) and xylazine (12 mg/kg) mixture was used for anesthesia. Before the surgery, the back hair was shaved and the skin was disinfected with a povidone-iodine solution. An incision of approximately 10 mm was made in the lower back and the kidney was pulled out using small forceps. A slice of the kidney was removed using a sharp surgical scissor. Strict hemostasis was performed before closing the abdominal cavity. A small piece from the lower pole of the right kidney was removed at 4 weeks post-injection and another small piece was removed from the upper pole of the right kidney at 8 weeks post-injection. Because similar amounts of tissues was removed from the lower or upper pole of kidney, the proportions of glomeruli and tubuli among samples were similar between individual animals. This was also confirmed by the kidney histology. On the day of sacrifice at 10 weeks post-injection, the left side of the kidney (without biopsies) was collected after the perfusion with PBS. All the tissue samples were submerged in RNAlater Stabilization Reagent (Qiagen, 76104) immediately after biopsies and then stored at −80°C before use.
Real-time quantitative PCR
Primers for RT-qPCR were designed by using Primer-Blast (NCBI) (Table S2). Gene expression was normalized to Gapdh, and fold change in expression relative to the control group was calculated using the 2−ΔΔCt method. Two or more technical replicates per gene were used per experiment.
Isolating and generation of mouse GEC cell line
mGECs were immortalized in similar manner as previously described 48 with the following modifications. Primary EYFP+ cells sorted from glomeruli of Flk1-H2B-EYFP mice were cultivated on fibronectin-coated (Sigma-Aldrich F0895) plates in endothelial cell culture medium consisting of F12K-HAM (ATCC® 30-2004™) supplemented with 60μg/mL endothelial cell growth supplement (ECGS) (Sigma-Aldrich), 5U/mL heparin (Sigma-Aldrich), 10% FBS, and 1% penicillin/streptomycin (Invitrogen Life Technologies). On days 3 to 5 after the initial seeding, outgrowth of GEC colonies were visible and were immortalized with a lentiviral vector with temperature-sensitive expression of SV40 large T-antigen (a gift from Dr. G. Luca Gusella, Icahn School of Medicine at Mount Sinai), and grown at 33°C with recombinant IFN-γ supplementation (20U/ml). After 14 days post-transduction, immortalized mGECs were further subcloned by limiting dilution or by single cell sorting into 96-well plates (BD FACS Aria II). mGEC clones were screened for robust EYFP expression under fluorescence microscopy and further characterized for endothelial marker expression when grown at 33°C (+IFN-γ) and 37°C. Single mGEC clone obtained from clonal outgrowth on the single cell-sorted 96-well plate was used for all the experiments (Clone 1). mGECs showed a strong expression of Flk-1 protein and mRNA at the growth-permissive temperature (Suppl. Figure 6A–B), and the thermal shift to growth-restrictive temperature enhanced the mRNA expression of endothelial markers Pecam1 and Cdh5 (Suppl. Figure 6B). All in vitro experiments were conducted in mGECs grown for at least 7 days in growth-restrictive conditions.
Gene silencing and overexpression in mGECs
For knockdown of Lrg1 and Gpr56, five pLKO.1 lentiviral shRNA plasmids for mLrg1 and mGpr56 were purchased from Sigma-Aldrich; pLKO.1 lentivector encoding scrambled shRNA was used as a negative control. For overexpression of Zfp57 lentivector expressing mZfp57 was purchased from VectorBuilder, Cyagen (vector ID# VB171201-1291snf); lentivector expressing mCherry RFP was used as a negative control (vector ID# VB160109-10005). mGECs grown at 33°C were transduced with corresponding lentivirus in the presence of 10 μg/mL Polybrene (Sigma-Aldrich) at MOI of 5, and selected for puromycin resistance. Stably transduced mGECs were cultured at 37°C for at least 7 days prior to experiments.
Cell adhesion assay
Adhesion assay was performed as previously reported 49 with modifications. In brief, mGECs were exposed to high glucose or mannitol for 72 hours, trypsinized and replated on fibronectin-coated 24-well plate (3 × 10⁵/well), and incubated with blocking solution at 37 °C for 1 hour. Non-adherent cells were removed by a gentle wash with PBS, and the remaining cells were fixed with 4% paraformaldehyde and subsequently stained with 0.1% crystal violet for 10 minutes. After extensive washing, the precipitates were dissolved by addition of 2% SDS for 30 min, and the optical density at 570nm was obtained.
In vitro Matrigel GEC tube formation assay
Early passaged mGECs were differentiated at 37°C for 5 days and induced with 35mm high glucose (35mM), high mannitol (30mM mannitol+5mM glucose) or normal glucose (5mM glucose) in F12K-HAM medium containing 1% FBS for additional 72 hours. mGECs were then trypsinized and replated on top of Matrigel (Corning) bed in 8-well chamber slides (1.5×10⁵ cells/ml) as described previously 50. After 6–8h of plating, the endothelial tube formation was visualized using the inverted Leica DMI8 microscope.
Statistical analysis
Data are expressed as mean ± SEM. For comparison of means between three or more groups, ANOVA with Bonferroni post-test was applied. For comparisons of means between two groups, two-tailed, unpaired t-tests were performed. Prism 5 software (GraphPad, La Jolla, California, USA) was used for statistical analyses.
Supplementary Material
Acknowledgments
JF and ZHL are supported by the Major International (Regional) Joint Research Project (81320108007) and the Major Research Plan of the National Natural Science Foundation (91442104); JCH is supported by NIH 1R01DK078897, NIH 1R01DK088541, VA Merit Award, and NIH P01-DK-56492; PYC and KL is supported by NIH 1R01DK098126.
Footnotes
AUTHOR CONTRIBUTION:
JCH, ZHL, and KL conceived and designed the experiments; JF, CW, JW, MC and WH performed the experiments; JF, CW, WZ, DS, WH, PYC, JCH and KL analyzed the data; MHB contributed reagents and materials; JF, DS, JCH, and KL wrote and revised the manuscript.
DISCLOSURE: The authors declare that they have no competing financial interests.
Publisher's Disclaimer: This is a PDF file of an unedited manuscript that has been accepted for publication. As a service to our customers we are providing this early version of the manuscript. The manuscript will undergo copyediting, typesetting, and review of the resulting proof before it is published in its final citable form. Please note that during the production process errors may be discovered which could affect the content, and all legal disclaimers that apply to the journal pertain.
References
- 1.USRDS. Annual Data Report: Atlas of End-Stage-Renal-Disease in the United States. 2011. [Google Scholar]
- 2.Collins AJ, Foley RN, Chavers B, et al. US Renal Data System 2013 Annual Data Report. American journal of kidney diseases: the official journal of the National Kidney Foundation. 2014;63:A7. doi: 10.1053/j.ajkd.2013.11.001. [DOI] [PubMed] [Google Scholar]
- 3.Dei Cas A, Gnudi L. VEGF and angiopoietins in diabetic glomerulopathy: how far for a new treatment? Metabolism: clinical and experimental. 2012;61:1666–1673. doi: 10.1016/j.metabol.2012.04.004. [DOI] [PubMed] [Google Scholar]
- 4.Yuen DA, Stead BE, Zhang YL, et al. eNOS Deficiency Predisposes Podocytes to Injury in Diabetes. J Am Soc Nephrol. 2012;23:1810–1823. doi: 10.1681/ASN.2011121170. [DOI] [PMC free article] [PubMed] [Google Scholar]
- 5.Zhao HJ, Wang S, Cheng H, et al. Endothelial nitric oxide synthase deficiency produces accelerated nephropathy in diabetic mice. J Am Soc Nephrol. 2006;17:2664–2669. doi: 10.1681/ASN.2006070798. [DOI] [PMC free article] [PubMed] [Google Scholar]
- 6.Nakagawa T. Uncoupling of the VEGF-endothelial nitric oxide axis in diabetic nephropathy: an explanation for the paradoxical effects of VEGF in renal disease. American journal of physiology Renal physiology. 2007;292:F1665–1672. doi: 10.1152/ajprenal.00495.2006. [DOI] [PubMed] [Google Scholar]
- 7.Brosius FC, 3rd, Alpers CE, Bottinger EP, et al. Mouse models of diabetic nephropathy. J Am Soc Nephrol. 2009;20:2503–2512. doi: 10.1681/ASN.2009070721. [DOI] [PMC free article] [PubMed] [Google Scholar]
- 8.Hodgin JB, Nair V, Zhang H, et al. Identification of cross-species shared transcriptional networks of diabetic nephropathy in human and mouse glomeruli. Diabetes. 2013;62:299–308. doi: 10.2337/db11-1667. [DOI] [PMC free article] [PubMed] [Google Scholar]
- 9.Woroniecka KI, Park AS, Mohtat D, et al. Transcriptome analysis of human diabetic kidney disease. Diabetes. 2011;60:2354–2369. doi: 10.2337/db10-1181. [DOI] [PMC free article] [PubMed] [Google Scholar]
- 10.Fu J, Wei C, Lee K, et al. Comparison of Glomerular and Podocyte mRNA Profiles in Streptozotocin-Induced Diabetes. J Am Soc Nephrol. 2016;27:1006–1014. doi: 10.1681/ASN.2015040421. [DOI] [PMC free article] [PubMed] [Google Scholar]
- 11.Brunskill EW, Potter SS. Gene expression programs of mouse endothelial cells in kidney development and disease. PLoS One. 2010;5:e12034. doi: 10.1371/journal.pone.0012034. [DOI] [PMC free article] [PubMed] [Google Scholar]
- 12.Fraser ST, Hadjantonakis AK, Sahr KE, et al. Using a histone yellow fluorescent protein fusion for tagging and tracking endothelial cells in ES cells and mice. Genesis. 2005;42:162–171. doi: 10.1002/gene.20139. [DOI] [PMC free article] [PubMed] [Google Scholar]
- 13.Fan Y, Li X, Xiao W, et al. BAMBI elimination enhances alternative TGF-beta signaling and glomerular dysfunction in diabetic mice. Diabetes. 2015;64:2220–2233. doi: 10.2337/db14-1397. [DOI] [PMC free article] [PubMed] [Google Scholar]
- 14.Nakagawa T, Sato W, Glushakova O, et al. Diabetic endothelial nitric oxide synthase knockout mice develop advanced diabetic nephropathy. J Am Soc Nephrol. 2007;18:539–550. doi: 10.1681/ASN.2006050459. [DOI] [PubMed] [Google Scholar]
- 15.Robert B, St John PL, Abrahamson DR. Direct visualization of renal vascular morphogenesis in Flk1 heterozygous mutant mice. Am J Physiol. 1998;275:F164–172. doi: 10.1152/ajprenal.1998.275.1.F164. [DOI] [PubMed] [Google Scholar]
- 16.Dimke H, Sparks MA, Thomson BR, et al. Tubulovascular cross-talk by vascular endothelial growth factor a maintains peritubular microvasculature in kidney. J Am Soc Nephrol. 2015;26:1027–1038. doi: 10.1681/ASN.2014010060. [DOI] [PMC free article] [PubMed] [Google Scholar]
- 17.Alva JA, Zovein AC, Monvoisin A, et al. VE-Cadherin-Cre-recombinase transgenic mouse: a tool for lineage analysis and gene deletion in endothelial cells. Dev Dyn. 2006;235:759–767. doi: 10.1002/dvdy.20643. [DOI] [PubMed] [Google Scholar]
- 18.De Gasperi R, Rocher AB, Sosa MA, et al. The IRG mouse: a two-color fluorescent reporter for assessing Cre-mediated recombination and imaging complex cellular relationships in situ. Genesis. 2008;46:308–317. doi: 10.1002/dvg.20400. [DOI] [PMC free article] [PubMed] [Google Scholar]
- 19.Chen EY, Tan CM, Kou Y, et al. Enrichr: interactive and collaborative HTML5 gene list enrichment analysis tool. BMC Bioinformatics. 2013;14:128. doi: 10.1186/1471-2105-14-128. [DOI] [PMC free article] [PubMed] [Google Scholar]
- 20.Huang da W, Sherman BT, Lempicki RA. Systematic and integrative analysis of large gene lists using DAVID bioinformatics resources. Nat Protoc. 2009;4:44–57. doi: 10.1038/nprot.2008.211. [DOI] [PubMed] [Google Scholar]
- 21.Alpers CE, Hudkins KL. Mouse models of diabetic nephropathy. Current opinion in nephrology and hypertension. 2011;20:278–284. doi: 10.1097/MNH.0b013e3283451901. [DOI] [PMC free article] [PubMed] [Google Scholar]
- 22.Wang X, Abraham S, McKenzie JAG, et al. LRG1 promotes angiogenesis by modulating endothelial TGF-beta signalling. Nature. 2013;499:306–311. doi: 10.1038/nature12345. [DOI] [PMC free article] [PubMed] [Google Scholar]
- 23.Pek SL, Tavintharan S, Wang X, et al. Elevation of a novel angiogenic factor, leucine-rich-alpha2-glycoprotein (LRG1), is associated with arterial stiffness, endothelial dysfunction, and peripheral arterial disease in patients with type 2 diabetes. J Clin Endocrinol Metab. 2015;100:1586–1593. doi: 10.1210/jc.2014-3855. [DOI] [PubMed] [Google Scholar]
- 24.Xu L, Begum S, Hearn JD, et al. GPR56, an atypical G protein-coupled receptor, binds tissue transglutaminase, TG2, and inhibits melanoma tumor growth and metastasis. Proceedings of the National Academy of Sciences of the United States of America. 2006;103:9023–9028. doi: 10.1073/pnas.0602681103. [DOI] [PMC free article] [PubMed] [Google Scholar]
- 25.Yang L, Chen G, Mohanty S, et al. GPR56 Regulates VEGF production and angiogenesis during melanoma progression. Cancer Res. 2011;71:5558–5568. doi: 10.1158/0008-5472.CAN-10-4543. [DOI] [PMC free article] [PubMed] [Google Scholar]
- 26.Goumans MJ, Lebrin F, Valdimarsdottir G. Controlling the angiogenic switch: a balance between two distinct TGF-b receptor signaling pathways. Trends Cardiovasc Med. 2003;13:301–307. doi: 10.1016/s1050-1738(03)00142-7. [DOI] [PubMed] [Google Scholar]
- 27.Yang L, Xu L. GPR56 in cancer progression: current status and future perspective. Future Oncol. 2012;8:431–440. doi: 10.2217/fon.12.27. [DOI] [PubMed] [Google Scholar]
- 28.Quenneville S, Verde G, Corsinotti A, et al. In embryonic stem cells, ZFP57/KAP1 recognize a methylated hexanucleotide to affect chromatin and DNA methylation of imprinting control regions. Mol Cell. 2011;44:361–372. doi: 10.1016/j.molcel.2011.08.032. [DOI] [PMC free article] [PubMed] [Google Scholar]
- 29.Shamis Y, Cullen DE, Liu L, et al. Maternal and zygotic Zfp57 modulate NOTCH signaling in cardiac development. Proceedings of the National Academy of Sciences of the United States of America. 2015;112:E2020–2029. doi: 10.1073/pnas.1415541112. [DOI] [PMC free article] [PubMed] [Google Scholar]
- 30.Bak M, Boonen SE, Dahl C, et al. Genome-wide DNA methylation analysis of transient neonatal diabetes type 1 patients with mutations in ZFP57. BMC Med Genet. 2016;17:29. doi: 10.1186/s12881-016-0292-4. [DOI] [PMC free article] [PubMed] [Google Scholar]
- 31.Mackay DJ, Callaway JL, Marks SM, et al. Hypomethylation of multiple imprinted loci in individuals with transient neonatal diabetes is associated with mutations in ZFP57. Nat Genet. 2008;40:949–951. doi: 10.1038/ng.187. [DOI] [PubMed] [Google Scholar]
- 32.Williams CK, Li JL, Murga M, et al. Up-regulation of the Notch ligand Delta-like 4 inhibits VEGF-induced endothelial cell function. Blood. 2006;107:931–939. doi: 10.1182/blood-2005-03-1000. [DOI] [PMC free article] [PubMed] [Google Scholar]
- 33.Suchting S, Freitas C, le Noble F, et al. The Notch ligand Delta-like 4 negatively regulates endothelial tip cell formation and vessel branching. Proceedings of the National Academy of Sciences of the United States of America. 2007;104:3225–3230. doi: 10.1073/pnas.0611177104. [DOI] [PMC free article] [PubMed] [Google Scholar]
- 34.Siekmann AF, Lawson ND. Notch signalling and the regulation of angiogenesis. Cell Adh Migr. 2007;1:104–106. doi: 10.4161/cam.1.2.4488. [DOI] [PMC free article] [PubMed] [Google Scholar]
- 35.McGinn S, Saad S, Poronnik P, et al. High glucose-mediated effects on endothelial cell proliferation occur via p38 MAP kinase. Am J Physiol Endocrinol Metab. 2003;285:E708–717. doi: 10.1152/ajpendo.00572.2002. [DOI] [PubMed] [Google Scholar]
- 36.Nakagawa T, Kosugi T, Haneda M, et al. Abnormal angiogenesis in diabetic nephropathy. Diabetes. 2009;58:1471–1478. doi: 10.2337/db09-0119. [DOI] [PMC free article] [PubMed] [Google Scholar]
- 37.Neri S, Bruno CM, Leotta C, et al. Early endothelial alterations in non-insulin-dependent diabetes mellitus. Int J Clin Lab Res. 1998;28:100–103. doi: 10.1007/s005990050027. [DOI] [PubMed] [Google Scholar]
- 38.Boerries M, Grahammer F, Eiselein S, et al. Molecular fingerprinting of the podocyte reveals novel gene and protein regulatory networks. Kidney Int. 2013;83:1052–1064. doi: 10.1038/ki.2012.487. [DOI] [PubMed] [Google Scholar]
- 39.Chen J, Zhang X, Zhang H, et al. Indoxyl Sulfate Enhance the Hypermethylation of Klotho and Promote the Process of Vascular Calcification in Chronic Kidney Disease. International journal of biological sciences. 2016;12:1236–1246. doi: 10.7150/ijbs.15195. [DOI] [PMC free article] [PubMed] [Google Scholar]
- 40.Ko YA, Mohtat D, Suzuki M, et al. Cytosine methylation changes in enhancer regions of core pro-fibrotic genes characterize kidney fibrosis development. Genome biology. 2013;14:R108. doi: 10.1186/gb-2013-14-10-r108. [DOI] [PMC free article] [PubMed] [Google Scholar]
- 41.Long J, Badal SS, Ye Z, et al. Long noncoding RNA Tug1 regulates mitochondrial bioenergetics in diabetic nephropathy. J Clin Invest. 2016;126:4205–4218. doi: 10.1172/JCI87927. [DOI] [PMC free article] [PubMed] [Google Scholar]
- 42.Thomas MC. Epigenetic Mechanisms in Diabetic Kidney Disease. Current diabetes reports. 2016;16:31. doi: 10.1007/s11892-016-0723-9. [DOI] [PubMed] [Google Scholar]
- 43.Li H, Durbin R. Fast and accurate short read alignment with Burrows-Wheeler transform. Bioinformatics. 2009;25:1754–1760. doi: 10.1093/bioinformatics/btp324. [DOI] [PMC free article] [PubMed] [Google Scholar]
- 44.Mortazavi A, Williams BA, McCue K, et al. Mapping and quantifying mammalian transcriptomes by RNA-Seq. Nat Methods. 2008;5:621–628. doi: 10.1038/nmeth.1226. [DOI] [PubMed] [Google Scholar]
- 45.Ritchie ME, Phipson B, Wu D, et al. limma powers differential expression analyses for RNA-sequencing and microarray studies. Nucleic Acids Res. 2015 doi: 10.1093/nar/gkv007. [DOI] [PMC free article] [PubMed] [Google Scholar]
- 46.Saeed AI, Sharov V, White J, et al. TM4: a free, open-source system for microarray data management and analysis. Biotechniques. 2003;34:374–378. doi: 10.2144/03342mt01. [DOI] [PubMed] [Google Scholar]
- 47.Potapova TA, Sivakumar S, Flynn JN, et al. Mitotic progression becomes irreversible in prometaphase and collapses when Wee1 and Cdc25 are inhibited. Mol Biol Cell. 2011;22:1191–1206. doi: 10.1091/mbc.E10-07-0599. [DOI] [PMC free article] [PubMed] [Google Scholar]
- 48.Rops AL, van der Vlag J, Jacobs CW, et al. Isolation and characterization of conditionally immortalized mouse glomerular endothelial cell lines. Kidney Int. 2004;66:2193–2201. doi: 10.1111/j.1523-1755.2004.66009.x. [DOI] [PubMed] [Google Scholar]
- 49.Humphries MJ. Cell-substrate adhesion assays. Curr Protoc Cell Biol. 2001;Chapter 9(Unit 9):1. doi: 10.1002/0471143030.cb0901s00. [DOI] [PubMed] [Google Scholar]
- 50.Arnaoutova I, Kleinman HK. In vitro angiogenesis: endothelial cell tube formation on gelled basement membrane extract. Nat Protoc. 2010;5:628–635. doi: 10.1038/nprot.2010.6. [DOI] [PubMed] [Google Scholar]
Associated Data
This section collects any data citations, data availability statements, or supplementary materials included in this article.


