Abstract
Aim: The Friedewald equation is the standard method for estimating low-density lipoprotein cholesterol (LDL-C) levels [LDL-C(F)] and fixes the ratio of triglyceride (TG) to very LDL-C at 5. However, this has been reported to underestimate LDL-C, particularly in patients with LDL-C < 70 mg/dL. A novel method for LDL-C estimation [LDL-C(M)] using an adjustable factor instead of a fixed value of 5 has recently been proposed. The purpose of this study was to validate LDL-C(M) in Japanese patients with cardiovascular disease (CVD) treated with statins.
Methods: In 385 consecutive CVD patients treated with statins, LDL-C(M) and LDL-C(F) levels were compared with directly measured LDL-C [LDL-C(D)].
Results: Mean LDL-C(D), LDL-C(F), and LDL-C(M) were 81.7 ± 25.5, 76.4 ± 24.6, and 79.9 ± 24.5 mg/dL, respectively. In all patients, both LDL-C(F) and LDL-C(M) were significantly correlated with LDL-C(D) [LDL-C(F) vs. LDL-C(D): R = 0.974, p < 0.001; LDL-C(M) vs. LDL-C(D): R = 0.987, p < 0.001]. In patients with LDL-C(D) < 70 mg/dL, LDL-C(M) showed a better correlation with LDL-C(D) compared with LDL-C(F) [LDL-C(M) vs. LDL-C(D): R = 0.935, p < 0.001; LDL-C(F) vs. LDL-C(D): R = 0.868, p < 0.001]. In contrast, the correlation of LDL-C(D) with LDL-C(M) or LDL-C(F) was similar in patients with LDL-C(D) ≥ 70 mg/dL.
Conclusions: In Japanese patients with CVD treated with statins, LDL-C level estimated by this novel method might be more accurate than those estimated using the Friedewald equation for LDL-C levels < 70 mg/dL.
Keywords: Low-density lipoprotein cholesterol, Friedewald equation, Martin method, Cardiovascular disease, Statin
Introduction
Cardiovascular disease (CVD) is one of the most important public health issues in industrialized countries1–4), and elevated low-density lipoprotein cholesterol (LDL-C) concentration is recognized as a major risk factor for CVD5–7). Clinical trials have demonstrated that decreases in serum levels of LDL-C can reduce the rate of cardiovascular events8, 9), and clinical practice guidelines recommend a target LDL-C of < 70 mg/dL for high-risk patients10, 11).
Conventionally, the Friedewald equation has been the standard method for estimation of LDL-C levels, which estimates LDL-C(F) as total cholesterol (TC)—high-density lipoprotein cholesterol (HDL-C)—[triglyceride (TG)/5] in the fasting state with TG < 400 mg/dL12). In this equation, the ratio of TG to very low-density lipoprotein cholesterol (VLDL-C) is fixed as 5. The Lipid Research Clinical Prevalence Study demonstrated that mean TG:VLDL-C ratios ranged from 5.2 to 8.9 and proposed a fixed factor of 613). Martin et al. recently reported a novel method for estimating LDL-C using an adjustable factor instead of a fixed factor of 514). This adjustable factor was determined from strata-specific median TG:VLDL-C ratios derived from a dataset of 900,605 individuals in the United States (Fig. 1). This novel method is thought to provide more accurate measurements of LDL-C than those derived from the Friedewald equation14). Furthermore, Meeusen et al. reported that LDL-C(F) underestimated LDL-C measured by β quantification [LDL-C(βQ)], which is considered the gold standard of LDL-C measurement, particularly in patients with LDL-C(βQ) < 70 mg/dL15). A recent study also demonstrated that LDL-C(M) by the Martin method correlated strongly with directly measured LDL-C(D), compared with LDL-C(F) at LDL-C < 40 mg/dL16). The validity of LDL-C(M) in different races and in patients with CVD, particularly with low LDL-C levels resulting from statin therapy, has not been elucidated.
Fig. 1.
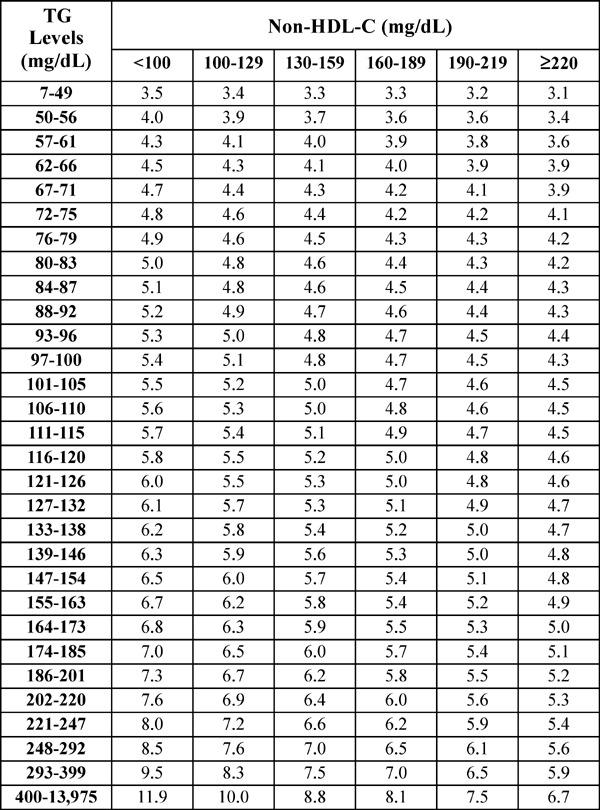
Median TG:VLDL-C ratios disaggregated by non-HDL-C and TG levels (180-cell table).
TG, triglyceride; VLDL-C, very low-density lipoprotein cholesterol; HDL-C, high-density lipoprotein cholesterol; cited from Reference #11.
Aim
The purpose of this study was to validate LDL-C(M) by comparing with LDL-C(F) and LDL-C(D) in Japanese patients with CVD and treated with statins.
Methods
Study Population
In this retrospective study, subjects comprised 554 consecutive patients with coronary artery disease and/or peripheral artery disease who were admitted to our hospital from May 2013 to December 2016 for angiography of the coronary and/or peripheral artery. Coronary artery disease included acute myocardial infarction, unstable or stable angina, and silent myocardial ischemia, and peripheral artery disease was defined as occlusive or stenotic disease of lower-limb arteries. Of these 554 patients, 169 patients were excluded because of a lack of statin therapy. The remaining 385 patients, who had been receiving treatment with statins for more than 1 month, were recruited to this study. No patients showed a fasting serum TG level > 400 mg/dL. All protocols in this study were approved by the institutional ethics committee at Kagoshima University Hospital. All patients provided written informed consent prior to enrollment in this study. This study was performed in compliance with the Declaration of Helsinki.
Laboratory Measurements
Blood samples were drawn after 12 h of fasting. Serum levels of TC, TG, and HDL-C were measured by enzymatic methods, using Determiner L TC II (Kyowa Medex, Tokyo, Japan), Determiner L TG II (Kyowa Medex), and MetaboLead HDL-C (Kyowa Medex), respectively. LDL-C(D) was directly measured by the selective solubilization method using the MetaboLead LDL-C (Kyowa Medex). LDL-C(F) was calculated using the Friedewald equation: TC–HDL–CTG/59). In addition, LDL-C(M) was calculated using the equation: TC–HDL-C–TG/adjustable factor, where the adjustable factor was the strata-specific TG:VLDL ratio based on TG and non-HDL-C levels in the 180-cell table described by Martin et al 14) (Fig. 1).
Statistical Analysis
All values are expressed as mean ± standard deviation. Linear regression analysis was performed to assess the relationship between LDL-C(D) and LDL-C(F) or LDL-C(M), and Bland–Altman plots were used to analyze the difference between LDL-C(D) and LDL-C(F) or LDL-C(M). Data were analyzed using JMP version 11 (SAS Institute, Cary, NC) at Kagoshima University. Values of p < 0.05 were considered indicative of a statistically significant between-group difference.
Results
Patient Characteristics
Characteristics of patients (n = 385) are summarized in Table 1. Mean age of patients was 69.8 ± 9.8 years, and 268 patients (69.6%) were male. Of the 385 patients, 366 patients (95.1%) had coronary artery disease, and 114 patients (29.6%) had peripheral artery disease. Ninety-five patients (24.7%) had both coronary artery disease and peripheral artery disease. Mean levels of LDL-C(D), LDL-C(F), and LDL-C(M) were 81.7 ± 25.5, 76.4 ± 24.6, and 79.9 ± 24.5 mg/dL, respectively. Mean HDL-C was 48.7 ± 13.6 mg/dL, and mean TG was 126.0 ± 59.0 mg/dL. Mean TG:VLDL-C ratio was 5.6 ± 0.9.
Table 1. Baseline patient characteristics (n = 385).
| Age (years) | 69.8±9.8 |
| Sex (male/female) | 268/117 |
| BMI (kg/m2) | 24.3±3.7 |
| Total cholesterol (mg/dL) | 150.3±31.6 |
| LDL-C(D) (mg/dL) | 81.7±25.5 |
| LDL-C(F) (mg/dL) | 76.4±24.6 |
| LDL-C(M) (mg/dL) | 79.9±24.5 |
| HDL cholesterol (mg/dL) | 48.7±13.6 |
| Non-HDL cholesterol (mg/dL) | 101.6±28.1 |
| TG (mg/dL) | 126.0±59.0 |
| TG:VLDL-C | 5.8±0.9 |
| CAD, n (%) | 366 (95.1) |
| PAD, n (%) | 114 (29.6) |
| Statin, n (%) | |
| Rosuvastatin | 156 (40.5) |
| Atorvastatin | 83 (21.6) |
| Pitavastatin | 114 (29.6) |
| Pravastatin | 24 (6.2) |
| Fluvastatin | 3 (0.8) |
| Simvastatin | 5 (1.3) |
| Ezetimibe, n (%) | 39 (10.1) |
| EPA, n (%) | 22 (5.7) |
Values are expressed as mean ± standard deviation. BMI, body mass index; CAD, coronary artery disease; EPA, eicosapentaenoic acid; HDL, high-density lipoprotein; LDL-C, low-density lipoprotein cholesterol; LDL-C(D), LDL-C measured by direct assay; LDL-C(F), LDL-C calculated by Friedewald formula; LDL-C(M), LDL-C calculated by Martin method; PAD, peripheral artery disease; TG, triglyceride; TG:VLDL-C, ratio of triglyceride to very low-density lipoprotein cholesterol.
All patients recruited to this study were under treatment with statins, with 353 patients (91.7%) taking strong statins (Rosuvastatin, Atorvastatin, or Pitavastatin) and 32 patients (8.3%) taking standard statins (Pravastatin, Fluvastatin or Simvastatin). In addition, 39 patients (10.1%) were prescribed Ezetimibe.
Correlation between LDL-C(D) and LDL-C(F) or LDL-C(M)
In all patients, both LDL-C(F) and LDL-C(M) correlated significantly with LDL-C(D) [LDL-C(F) vs. LDL-C(D): R = 0.974, p < 0.001; LDL-C(M) vs. LDL-C(D): R = 0.987, p < 0.001] (Fig. 2). In the Bland–Altman plots, mean differences between LDL-C(D) and LDL-C(F) or LDL-C(M) were 5.3 mg/dL [95% confidence interval (CI), 4.7–5.9 mg/dL] or 1.8 mg/dL (95%CI, 1.4–2.2). A total of 124 patients (32.2%) showed LDL-C(D) level < 70 mg/dL, and we analyzed correlations between LDL-C(D) and LDL-C(F) or LDL-C(M) among patients with LDL-C(D) < 70 mg/dL (n = 124) and LDL-C(D) ≥ 70 mg/dL (n = 261) (Fig. 3). In patients with LDL-C(D) ≥ 70 mg/dL, both LDL-C(F) and LDL-C(M) correlated well with LDL-C(D) [LDL-C(F) vs. LDL-C(D): R = 0.960, p < 0.001; LDL-C(M) vs. LDL-C(D): R = 0.978, p < 0.001] (Fig. 3A, B). In patients with LDL-C(D) < 70 mg/dL, although LDL-C(F) and LDL-C(M) correlated significantly with LDL-C(D), LDL-C(M) displayed a better correlation with LDL-C(D) compared with LDL-C(F) [LDL-C(M) vs. LDL-C(D): R = 0.935, p < 0.001; LDL-C(F) vs. LDL-C(D): R = 0.868, p < 0.001] (Fig. 3C, D). In the Bland -Altman plots, the mean differences between LDL-C(D) and LDL-C(M) were smaller than those between LDL-C(D) and LDL-C(F) in both LDL-C(D) ≥ 70 mg/dL and LDL-C(D) < 70 mg/dL (Fig. 3A–D). Furthermore, we investigated the effect of TG level (TG < 150 mg/dL and TG ≥ 150 mg/dL) on the correlation between LDL-C(D) and LDL-C(F) or LDL-C(M) (Fig. 4). In patients with LDL-C(D) ≥ 70 mg/dL, both LDL-C(F) and LDL-C(M) showed a good correlation with LDL-C(D) regardless of TG level (Fig. 4A–D). In contrast, LDL-C(M) had a better correlation with LDL-C(D) than LDL-C(F) in patients with LDL-C < 70 mg/dL and TG ≥ 150 mg/dL (Fig. 4G, H). In the Bland–Altman plots, mean differences between LDL-C(D) and LDL-C(F) were larger than those between LDL-C(D) and LDL-C(M) in patients with TG ≥ 150 mg/dL regardless of LDL-C(D) level (Fig. 4C, D, G, H).
Fig. 2.
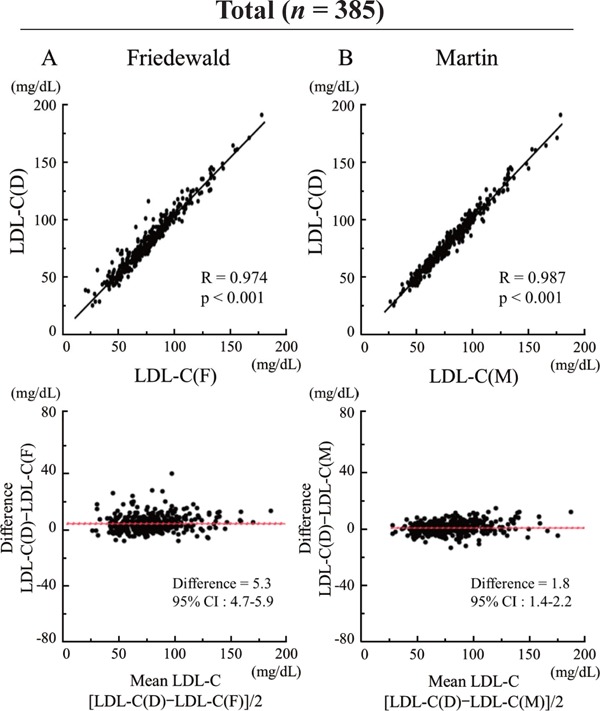
Comparison of correlation between LDL-C(D) and LDL-C(F) or LDL-C(M) levels.
(A) LDL-C(D) versus LDL-C(F). (B) LDL-C(D) versus LDL-C(M). Upper panels indicate linear regression analysis, whereas lower panels indicate Bland–Altman plots. CI, confidence interval; LDL-C, low-density lipoprotein cholesterol; LDL-C(D), LDL-C measured by direct assay; LDL-C(F), LDL-C calculated using the Friedewald formula; LDL-C(M), LDL-C calculated using the Martin method.
Fig. 3.
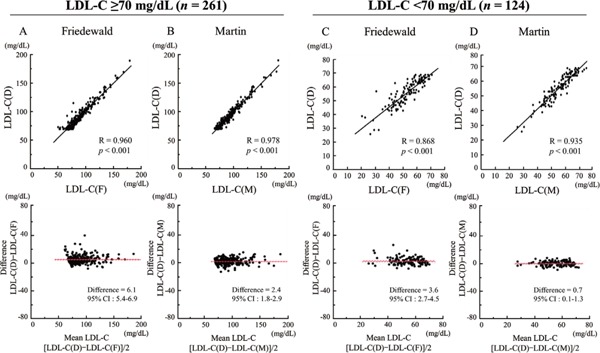
Comparison of correlation between LDL-C(D) and LDL-C(F) or LDL-C(M) levels in patients with LDL-C(D) < 70 mg/dL (n = 124) and LDL-C(D) ≥ 70 mg/dL (n = 261).
(A) LDL-C(D) versus LDL-C(F) in patients with LDL-C(D) < 70 mg/dL. (B) LDL-C(D) versus LDL-C(M) in patients with LDL-C(D) < 70 mg/dL. (C) LDL-C(D) versus LDL-C(F) in patients with LDL-C(D) ≥ 70 mg/dL. (D) LDL-C(D) versus LDL-C(M) in patients with LDL-C(D) ≥ 70 mg/dL. Upper panels indicate linear regression analysis, whereas lower panels indicate Bland–Altman plots. CI, confidence interval; LDL-C, low-density lipoprotein cholesterol; LDL-C(D), LDL-C measured by direct assay; LDL-C(F), LDL-C calculated using the Friedewald formula; LDL-C(M), LDL-C calculated using the Martin method.
Fig. 4.
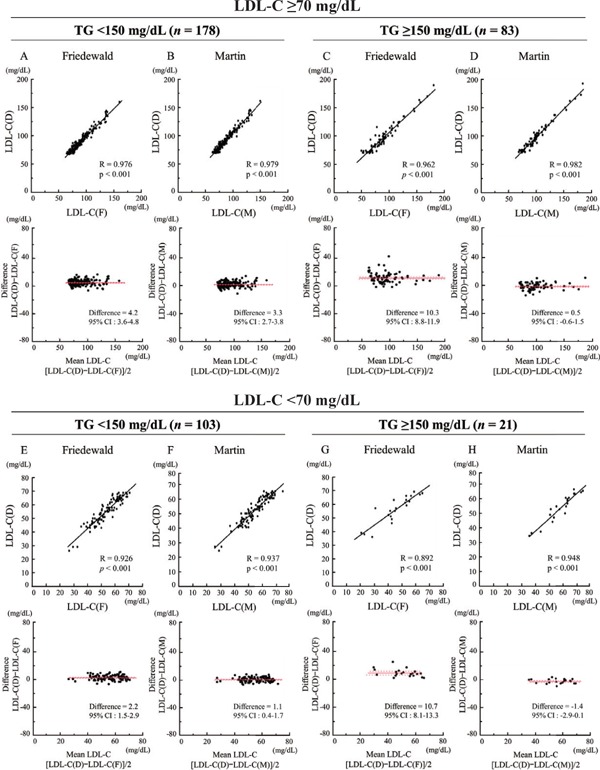
The effect of TG level (TG < 150 mg/dL and TG ≥ 150 mg/dL) on correlation between LDL-C(D) and LDL-C(F) or LDL-C(M).
In patients with LDL-C(D) ≥ 70 mg/dL and TG < 150 mg/dL, LDL-C(D) versus LDL-C(F) (A) or LDL-C(M) (B). In patients with LDL-C(D) ≥ 70 mg/dL and TG ≥ 150 mg/dL, LDL-C(D) versus LDL-C(F) (C) or LDL-C(M) (D). In patients with LDL-C(D) < 70 mg/dL and TG < 150 mg/dL, LDL-C(D) versus LDL-C(F) (E) or LDL-C(M) (F). In patients with LDL-C(D) ≥ 70 mg/dL and TG ≥ 150 mg/dL, LDL-C(D) versus LDL-C(F) (G) or LDL-C(M) (H). Upper panels indicate linear regression analysis, whereas lower panels indicate Bland–Altman plots. CI, confidence interval; LDL-C, low-density lipoprotein cholesterol; LDL-C(D), LDL-C measured by direct assay; LDL-C(F), LDL-C calculated using the Friedewald formula; LDL-C(M), LDL-C calculated using the Martin method.
Concordance in Classification
The concordance of calculated and directly measured LDL-C is shown in Table 2. Both LDL-C(F) and LDL-C(M) tended to underestimate levels of LDL-C compared with LDL-C(D). The concordance of LDL-C(M) was higher than that of LDL-C(F) in all patients [LDL-C(M) vs. LDL-C(D): 84.7%, LDL-C(F) vs. LDL-C(D): 73.8%]. Fig. 5 shows comparisons of concordance between LDL-C(F) and LDL-C(D) and between LDL-C(M) and LDL-C(D) disaggregated by LDL-C(D) level in patients with LDL-C(D) < 100 mg/dL (n = 321). Patients were divided into three groups on the basis of LDL-C(D) level [LDL-C(D) < 50 mg/dL: n = 33; 50 mg/dL ≤ LDL-C(D) < 70 mg/dL: n = 91; 70 mg/dL ≤ LDL-C (D) < 100 mg/dL: n = 179]. In all groups, LDL-C(M) demonstrated better concordance than LDL-C(F) [LDL-C(D) < 50 mg/dL: 72.5% vs. 62.0%; 50 mg/dL ≤LDL-C(D) < 70 mg/dL: 72.3% vs. 54.8%; 70 mg/dL ≤LDL-C (D) < 100 mg/dL: 79.6% vs. 65.2%].
Table 2. Concordance of calculated and directly measured LDL-C.
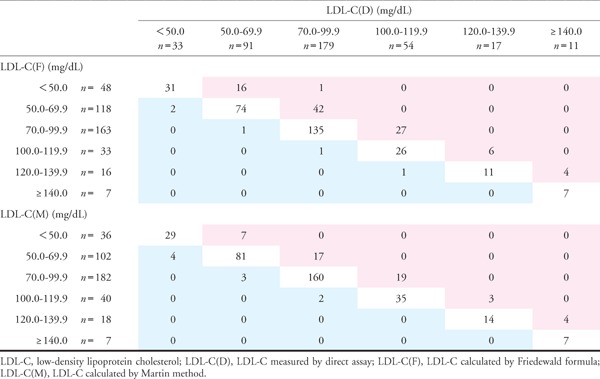 |
Fig. 5.
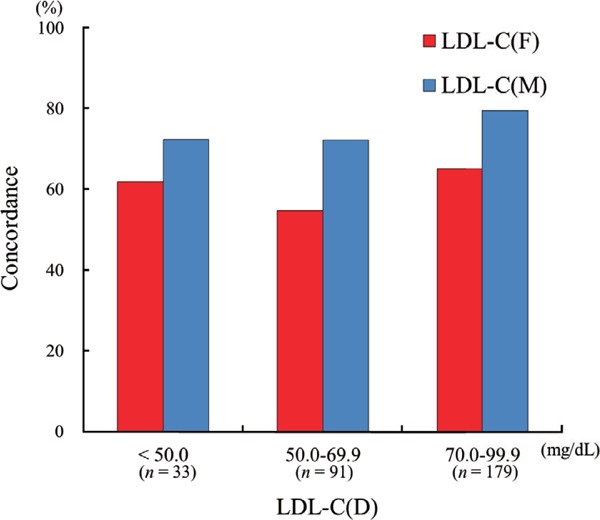
Comparison of concordance between LDL-C(D) and LDL-C(F) and that between LDL-C(D) and LDL-C(M) disaggregated by LDL-C(D) level.
LDL-C, low-density lipoprotein cholesterol; LDL-C(D), LDL-C measured by direct assay; LDL-C(F), LDL-C calculated using the Friedewald formula; LDL-C(M), LDL-C calculated using the Martin method.
Discussion
The current study demonstrated that in Japanese patients with CVD treated with statins, both LDL-C(F) and LDL-C(M) showed good correlation with LDL-C(D). In patients with LDL-C ≥ 70 mg/dL, LDL-C(F) and LDL-C(M) showed equal correlations with LDL-C(D), whereas in patients with LDL-C < 70 mg/dL, LDL-C(M) displayed a better fit to LDL-C(D) compared with LDL-C(F). Furthermore, the concordance of LDL-C(M) was higher than that of LDL-C(F). In high-risk patients treated with statins, LDL-C(M) might provide more accurate information to achieve the low target LDL-C level.
Validity of the Martin Method in Japanese CVD Patients Treated with Statins
In patients with CVD, LDL-C represents a pivotal target of treatment. The Friedewald equation using a fixed TG:VLDL-C ratio of 5 is widely used for measuring LDL-C12). However, this equation is not recommended for use in patients with TG > 400 mg/dL, and underestimation of LDL-C(F) level has been reported at both low LDL-C levels17, 18) and high TG levels19–21). Recently, Martin et al. suggested a novel method for calculating LDL-C(M) using an adjustable factor instead of a fixed factor of 514). This method is thought to provide more accurate measurement of LDL-C than that derived from the Friedewald equation14). Although the Martin method was derived from a database of subjects in the United States, Rim et al. investigated the validity of the method in a Korean population and demonstrated that the Martin method is superior to use of the Friedewald equation22). However, the validity of the Martin method has not been established in CVD patients treated with statins. Our study investigated the validity of the Martin method in Japanese coronary artery disease patients treated with statins and for the first time reported that both LDL-C(M) and LDL-C(F) correlated significantly with LDL-C(D).
All subjects in this study were taking statins for secondary prevention, and non-HDL level was lower compared with previous studies using the Martin method14, 22, 23). In the Martin method, the adjustable factor increases with decreases in the non-HDL level. As a result, the TG:VLDL-C ratio (5.6) in the present study was higher than that in the Martin report (5.2). In any case, both values differed substantially from the fixed factor of 5 used in the Friedewald equation. Actually, the Lipid Research Clinics Prevalence study reported that mean TG:VLDL-C ratio ranged from 5.2 to 8.9 in clinical settings13), depending on TG and non-HDL-C levels. Considering the results from the present study, a fixed factor of 5 might not provide sufficient accuracy for patients treated with statins, and the Martin method using the adjustable factor may be useful for Japanese CVD patients treated with statins.
Accuracy of the Martin Method at LDL-C Level < 70 mg/dL
A decrease in LDL-C level leads to a reduction in the rate of cardiovascular events7–9). Although the 2013 American College of Cardiology/American Heart Association Blood Cholesterol Guideline did not provide a specific target for LDL-C24), international clinical guidelines recommend a target LDL-C of < 70 mg/dL for high-risk patients10, 11). In the Japan Atherosclerosis Society Guideline for Prevention of Atherosclerotic Cardiovascular Disease 2017, a target of LDL-C < 100 mg/dL is recommended for secondary prevention, and a target of LDL-C < 70 mg/dL is recommended for high-risk patients such as those with familial hyperlipidemia, acute coronary syndrome, and/or high-risk diabetes mellitus25). The current study has demonstrated that in patients with LDL-C ≥ 70 mg/dL, both LDL-C(F) and LDL-C(M) correlated well with LDL-C(D). In contrast, among patients with LDL-C < 70 mg/dL, LDL-C(F) tended to underestimate, whereas LDL-(M) was in good accordance with LDL-C(D). Even in patients with LDL-C < 100 mg/dL according to the Japan Atherosclerosis Society Guideline25), LDL-C(M) showed higher concordance with LDL-C(D) compared with LDL-C(F). Furthermore, we investigated the effect of TG level on the correlation between LDL-C(D) and LDL-C(F) or LDL-C(M) as Chaen et al. have recently reported19). The correlation between LDL-C(D) and LDL-C(M) was less affected by TG level compared with LDL-C(F), especially in patients with LDL-C < 70 mg/dL and TG ≥ 150 mg/dL. Martin et al. reported that among general subjects in the United States, LDL-C(M) showed good concordance with directly measured LDL-C at LDL-C level < 70 mg/dL compared with LDL-C(F) [LDL-C(M); 94.1%, LDL-C(F); 77.2%]14). Quisepe et al. have also demonstrated that in patients with an LDL-C(F) level of 50–69 mg/dL, 29% of patients show LDL-C(D) level ≥ 70 mg/dL16). Furthermore, Meeusen et al. pointed out that the discordance between LDL-C(F) and LDL-C(βQ), which is measured by β quantification and is considered the gold-standard method for determining LDL-C, was increased for LDL-C level < 70 mg/dL15). However, those previous studies did not investigate patients under lipid-lowering therapy. The current study therefore focused on patients with CVD who were being treated with statins and demonstrated the Martin method as superior to the Friedewald equation at LDL-C level < 70 mg/dL in those patients.
Clinical Implications
Considering the clinical practice for patients with CVD, LDL-C level may provide key information for adjusting lipid-lowering therapy. However, if LDL-C(F) is < 70 mg/dL, underestimation may be provided. Such errors may potentially lead to inadequate lipid-lowering therapy. When LDL-C level < 70 mg/dL is the target of lipid-lowering therapy for high-risk patients, physicians need to pay attention to underestimation of the LDL-C as estimated by Friedewald equation and should consider using the Martin method.
Limitations
The current study has several limitations. First, the gold standard method of LDL-C measurement is LDL-C(βQ) measured by β quantification26). However, β quantification is expensive and inconvenient in clinical practice27). A previous report revealed that direct measurement of LDL-C by MetaboLead LDL (direct measurement) can be used to provide results similar to those from the βQ method28). We therefore used LDL-C(D) instead of LDL-C(βQ) as the standard reference measurement. Second, we have no data from CVD patients without statins and so could not confirm the validity of the Martin method in those patients. Finally, CVD patients on statins with TG ≥ 400 mg/dL were not included in this study for comparison with LDL-C(D). The validity of the Martin method in patients with statin and TG ≥ 400 mg/dL thus remains unclear.
Conclusions
The current study demonstrated that in Japanese CVD patients receiving statins, LDL-C level as estimated by the Martin method was more accurate than that estimated using the Friedewald equation, especially in patients with LDL-C < 70 mg/dL. In high-risk patients treated with statins, the Martin method might provide more accurate information to achieve the low target LDL-C level.
Acknowledgments
We appreciate the assistance of the staff in the Department of Cardiovascular Medicine and Hypertension, Kagoshima University, in data processing.
Conflicts of Interests
The authors declare that they have no conflicts of interest.
References
- 1). Wakabayashi K, Nozue T, Yamamoto S, Tohyama S, Fukui K, Umezawa S, Onishi Y, Kunishima T, Sato A, Miyake S, Morino Y, Yamauchi T, Muramatsu T, Hibi K, Terashima M, Suzuki H, Michishita I, for TRUTH investigators : Efficacy of statin therapy in inducing coronary plaque regression in patients with low baseline cholesterol levels. J Atheroscler Thromb, 2016; 23: 1055-1066 [DOI] [PMC free article] [PubMed] [Google Scholar]
- 2). Naito R, Miyauchi K, Daida H, Morimoto T, Hiro T, Kimura T, Nakagawa Y, Yamagishi M, Ozaki Y, Matsuzaki M, for JAPAN-ACS Investigators : Impact of total risk management on coronary plaque regression in diabetic patients with acute coronary syndrome - Sub Analysis of JAPAN-ACS Study -. J Atheroscler Thromb, 2016; 23: 922-931 [DOI] [PMC free article] [PubMed] [Google Scholar]
- 3). Wilson PWF, Gagnon D: Diabetes Mellitus and Control of Cardiovascular Disease Risk Factors: A Challenge to Improve Usual Care. Circulation 2017; 136: 1204-1206 [DOI] [PubMed] [Google Scholar]
- 4). Sacks FM, Lichtenstein AH, Wu JHY, Appel LJ, Creager MA, Kris-Etherton PM, Miller M, Rimm EB, Rudel LL, Robinson JG, Stone NJ, Van Horn LV: Dietary Fats and Cardiovascular Disease: A Presidential Advisory From the American Heart Association. Circulation 2017; 136: e1-e23. 10.1161/CIR.0000000000000510 [DOI] [PubMed] [Google Scholar]
- 5). Vallejo-Vaz AJ, Robertson M, Catapano AL, Watts GF, Kastelein JJ, Packard CJ, Ford I, Ray KK: LDL-Cholesterol Lowering for the Primary Prevention of Cardiovascular Disease Among Men with Primary Elevations of LDL-Cholesterol Levels of 190 mg/dL or Above: Analyses from the WOSCOPS 5-year Randomised Trial and 20-year Observational Follow-Up. Circulation 2017; .org/10.1161/CIRCULATIONAHA.117.027966 [DOI] [PubMed] [Google Scholar]
- 6). Zafrir B, Jubran A, Lavie G, Halon DA, Flugelman MY, Shapira C: Clinical Features and Gaps in the Management of Probable Familial Hypercholesterolemia and Cardiovascular Disease. Circ J 2017. 10.1253/circj.CJ-17-0392 [DOI] [PubMed] [Google Scholar]
- 7). Nozue T: Lipid Lowering Therapy and Circulating PCSK9 Concentration. J Atheroscler Thromb 2017; 24: 895-907 [DOI] [PMC free article] [PubMed] [Google Scholar]
- 8). Teramoto T, Kobayashi M, Tasaki H, Yagyu H, Higashikata T, Takagi Y, Uno K, Baccara-Dinet MT, Nohara A: Efficacy and Safety of Alirocumab in Japanese Patients With Heterozygous Familial Hypercholesterolemia or at High Cardiovascular Risk With Hypercholesterolemia Not Adequately Controlled With Statins - ODYSSEY JAPAN Randomized Controlled Trial. Circ J 2016; 80: 1980-1987. 10.1253/circj.CJ-16-0387 [DOI] [PubMed] [Google Scholar]
- 9). Toth PP, Descamps O, Genest J, Sattar N, Preiss D, Dent R, Djedjos C, Wu Y, Geller M, Uhart M, Somaratne R, Wasserman SM, PROFICIO Investigators : Pooled Safety Analysis of Evolocumab in Over 6000 Patients From Double-Blind and Open-Label Extension Studies. Circulation 2017; 135: 1819-1831. 10.1161/CIRCULATIONAHA.116.025233 [DOI] [PubMed] [Google Scholar]
- 10). Anderson TJ, Grégoire J, Hegele RA, Couture P, Mancini GB, McPherson R, Francis GA, Poirier P, Lau DC, Grover S, Genest J, Jr, Carpentier AC, Dufour R, Gupta M, Ward R, Leiter LA, Lonn E, Ng DS, Pearson GJ, Yates GM, Stone JA, Ur E: 2012 update of the Canadian Cardiovascular Society guidelines for the diagnosis and treatment of dyslipidemia for the prevention of cardiovascular disease in the adult. Can J Cardiol 2013; 29: 151-167 [DOI] [PubMed] [Google Scholar]
- 11). European Association for Cardiovascular Prevention & Rehabilitation. Reiner Z, Catapano AL, De Backer G, Graham I, Taskinen MR, Wiklund O, Agewall S, Alegria E, Chapman MJ, Durrington P, Erdine S, Halcox J, Hobbs R, Kjekshus J, Filardi PP, Riccardi G, Storey RF, Wood D, ESC Committee for Practice Guidelines (CPG) 2008–2010 and 2010–2012 Committees : ESC/EAS Guidelines for the management of dyslipidaemias: the Task Force for the management of dyslipidaemias of the European Society of Cardiology (ESC) and the European Atherosclerosis Society (EAS). Eur Heart J 2011; 32: 1769-1818 [DOI] [PubMed] [Google Scholar]
- 12). Friedewald WT, Levy RI, Fredrickson DS: Estimation of the concentration of low-density lipoprotein cholesterol in plasma, without use of the preparative ultracentrifuge. Clin Chem 1972; 18: 499-502 [PubMed] [Google Scholar]
- 13). DeLong DM, DeLong ER, Wood PD, Lippel K, Rifkind BM: A comparison of methods for the estimation of plasma low- and very low-density lipoprotein cholesterol. The Lipid Research Clinics Prevalence Study. JAMA 1986; 256: 2372-2377 [PubMed] [Google Scholar]
- 14). Martin SS, Blaha MJ, Elshazly MB, Toth PP, Kwiterovich PO, Blumenthal RS, Jones SR: Comparison of a novel method vs the Friedewald equation for estimating low-density lipoprotein cholesterol levels from the standard lipid profile. JAMA 2013; 310: 2061-2068 [DOI] [PMC free article] [PubMed] [Google Scholar]
- 15). Meeusen JW, Snozek CL, Baumann NA, Jaffe AS, Saenger AK: Reliability of Calculated Low-Density Lipoprotein Cholesterol. Am J Cardiol 2015; 116: 538-540 [DOI] [PubMed] [Google Scholar]
- 16). Quispe R, Hendrani A, Elshazly MB, Michos ED, McEvoy JW, Blaha MJ, Banach M, Kulkarni KR, Toth PP, Coresh J, Blumenthal RS, Jones SR, Martin SS: Accuracy of low-density lipoprotein cholesterol estimation at very low levels. BMC Med 2017; 15: 83. 10.1186/s12916-017-0852-2 [DOI] [PMC free article] [PubMed] [Google Scholar]
- 17). Sibal L, Neely RD, Jones A, Home PD: Friedewald equation underestimates low-density lipoprotein cholesterol at low concentrations in young people with and without Type 1 diabetes. Diabet Med 2010; 27: 37-45 [DOI] [PubMed] [Google Scholar]
- 18). Scharnagl H, Nauck M, Wieland H, März W: The Friedewald formula underestimates LDL cholesterol at low concentrations. Clin Chem Lab Med 2001; 39: 426-431 [DOI] [PubMed] [Google Scholar]
- 19). Chaen H, Kinchiku S, Miyata M, Kajiya S, Uenomachi H, Yuasa T, Takasaki K, Ohishi M: Validity of a Novel Method for Estimation of Low-Density Lipoprotein Cholesterol Levels in Diabetic Patients. J Atheroscler Thromb 2016; 12: 1355-1364 [DOI] [PMC free article] [PubMed] [Google Scholar]
- 20). Jun KR, Park HI, Chun S, Park H, Min WK: Effects of total cholesterol and triglyceride on the percentage difference between the low-density lipoprotein cholesterol concentration measured directly and calculated using the Friedewald formula. Clin Chem Lab Med 2008; 46: 371-375 [DOI] [PubMed] [Google Scholar]
- 21). Lindsey CC, Graham MR, Johnston TP, Kiroff CG, Freshley A: A clinical comparison of calculated versus direct measurement of low-density lipoprotein cholesterol level. Pharmacotherapy 2004; 24: 167-172 [DOI] [PubMed] [Google Scholar]
- 22). Rim JH, Lee YH, Lee MH, Kim HY, Choi J, Lee BW, Kang ES, Lee HC, Kim JH, Lee SG, Cha BS: Comparison and Validation of 10 Equations Including a Novel Method for Estimation of LDL-cholesterol in a 168,212 Asian Population. Medicine 2016; 95: e3230, 10.1097/MD.0000000000003230 [DOI] [PMC free article] [PubMed] [Google Scholar]
- 23). Lee J, Jang S, Son H: Validation of the Martin Method for Estimating Low-Density Lipoprotein Cholesterol Levels in Korean Adults: Findings from the Korea National Health and Nutrition Examination Survey, 2009–2011. PLOS one 2016; 11: e0148147, 10.1371/journal.pone.0148147.eCollection 2016 [DOI] [PMC free article] [PubMed] [Google Scholar]
- 24). Stone NJ, Robinson JG, Lichtenstein AH, Bairey Merz CN, Blum CB, Eckel RH, Goldberg AC, Gordon D, Levy D, Lloyd-Jones DM, McBride P, Schwartz JS, Shero ST, Smith SC, Jr, Watson K, Wilson PW, American College of Cardiology/American Heart Association Task Force on Practice Guidelines : 2013 ACC/AHA guideline on the treatment of blood cholesterol to reduce atherosclerotic cardiovascular risk in adults: a report of the American College of Cardiology/American Heart Association Task Force on Practice Guidelines. Circulation 2013; 129: S1-45, 10.1161/01.cir.0000437738.63853.7a. Epub 2013 Nov 12 [DOI] [PubMed] [Google Scholar]
- 25). Japan Atherosclerosis Society: The Japan Atherosclerosis Society (JAS) Guidelines for Prevention of Atherosclerotic Cardiovascular Diseases 2017. Tokyo: JAS, 2017 [DOI] [PMC free article] [PubMed] [Google Scholar]
- 26). Bachorik PS: Measurement of low density lipoprotein cholesterol. In: Rifai N, Warnick GR, Dominiczak MH, eds. Handbook of Lipoprotein Testing. Washington DC: AACC Press; 1997: 145-160 [Google Scholar]
- 27). Nauck M, Warnick GR, Rifai N: Methods for measurement of LDL-cholesterol: a critical assessment of direct measurement by homogeneous assays versus calculation. Clin Chem 2002; 48: 236-254 [PubMed] [Google Scholar]
- 28). Miida T, Nishimura K, Hirayama S, Miyamoto Y, Nakamura M, Masuda D, Yamashita S, Ushiyama M, Komori T, Fujita N, Yokoyama S, Teramoto T: Homogeneous Assays for LDL-C and HDL-C are Reliable in Both the Postprandial and Fasting State. J Atheroscler Thromb 2017; 24: 583-599 [DOI] [PMC free article] [PubMed] [Google Scholar]


