Abstract
Deficits in the interpretation of others' intentions from gaze-direction or other social attention cues are well-recognized in ASD. Here we investigated whether an EEG brain computer interface (BCI) can be used to train social cognition skills in ASD patients. We performed a single-arm feasibility clinical trial and enrolled 15 participants (mean age 22y 2m) with high-functioning ASD (mean full-scale IQ 103). Participants were submitted to a BCI training paradigm using a virtual reality interface over seven sessions spread over 4 months. The first four sessions occurred weekly, and the remainder monthly. In each session, the subject was asked to identify objects of interest based on the gaze direction of an avatar. Attentional responses were extracted from the EEG P300 component. A final follow-up assessment was performed 6-months after the last session. To analyze responses to joint attention cues participants were assessed pre and post intervention and in the follow-up, using an ecologic “Joint-attention task.” We used eye-tracking to identify the number of social attention items that a patient could accurately identify from an avatar's action cues (e.g., looking, pointing at). As secondary outcome measures we used the Autism Treatment Evaluation Checklist (ATEC) and the Vineland Adaptive Behavior Scale (VABS). Neuropsychological measures related to mood and depression were also assessed. In sum, we observed a decrease in total ATEC and rated autism symptoms (Sociability; Sensory/Cognitive Awareness; Health/Physical/Behavior); an evident improvement in Adapted Behavior Composite and in the DLS subarea from VABS; a decrease in Depression (from POMS) and in mood disturbance/depression (BDI). BCI online performance and tolerance were stable along the intervention. Average P300 amplitude and alpha power were also preserved across sessions. We have demonstrated the feasibility of BCI in this kind of intervention in ASD. Participants engage successfully and consistently in the task. Although the primary outcome (rate of automatic responses to joint attention cues) did not show changes, most secondary neuropsychological outcome measures showed improvement, yielding promise for a future efficacy trial.
(clinical-trial ID: NCT02445625—clinicaltrials.gov).
Keywords: autism, clinical trial, brain-computer interface, EEG, virtual reality, social attention
Introduction
Autism spectrum disorder (ASD) is a set of pervasive and sustained neurodevelopmental conditions characterized by persistent deficits in social communication and social interaction, alongside restricted, repetitive patterns of behavior, interests, or activities (American Psychiatric Association, 2013). This condition has a significant economic and social impact due to its high prevalence [estimated at ~1.5% in developed countries around the world (Baxter et al., 2015; Christensen et al., 2016; Lyall et al., 2017) and ~10 per 10,000 children in Portugal (Oliveira et al., 2007)]. It is associated with high morbidity and impact on daily family life (Karst and Van Hecke, 2012; Boshoff et al., 2016; Harrop et al., 2016; Jones et al., 2016; Schlebusch et al., 2016).
Joint attention (JA) is an early-developing social communication skill defined by the non-verbal coordination of attention of two individuals toward a third object or event (Bakeman and Adamson, 1984). People with ASD show severe deficits in JA abilities (Baron-Cohen, 1989; Baron-Cohen et al., 1997; Swettenham et al., 1998; Leekam and Moore, 2001; Klin, 2002; Dawson et al., 2004) which plays a critical role in the development of their social and language capabilities (Charman, 1998, 2003).
Electroencephalography (EEG) based brain-computer interfaces (BCI), represent widely studied communication technologies (Farwell and Donchin, 1988; Kleih et al., 2011; Mak et al., 2011; Wolpaw and Wolpaw, 2012). Virtual reality (VR) has been increasingly used in neuro-rehabilitation, in particular of motor control and has shown promising results (Larson et al., 2011, 2014; Astrand et al., 2014; Tankus et al., 2014; Salisbury et al., 2016). However, concerning cognitive applications in the field of neuro-rehabilitation the use of combined VR and BCIs has only been used with children with attention deficit hyperactivity disorder (which includes the presence of frequent inattentive, impulsive, and hyperactive behaviors; American Psychiatric Association, 2013).
The review provided by Friedrich et al. (2014), grounded on a series of neurofeedback training studies, postulates that quantitative EEG-based neurofeedback training is viable as a personalized therapeutic approach in ASD. They also suggest the development of a game platform that includes social interactions and specific feedback based on behavior, neurophysiological, and/or peripheral physiological responses of the users. The ultimate goal is to reinforce significant behaviors, such as social interactions using neurobehavioral signals to promote behavioral, cognitive, and emotional improvement in ASD people. Along this line several studies do advocate (Wainer and Ingersoll, 2011; Bekele et al., 2014; Georgescu et al., 2014) that the use of ecological, realistic, and interactive virtual environments may be the solution for the well-known generalization problem of the rehabilitation of social skills in ASD subjects to real life settings. Golan and Baron-Cohen (2006) suggested that the use of computerized intervention in ASD individuals enables the development of skills in a highly standardized, predictable, and controlled environment, while simultaneously allowing an individual to work at his own pace and ability level.
Based on these suggestions, we propose a virtual reality P300-based BCI paradigm (which technical implementation is described in Amaral et al., 2017) that tries to couple the advantages of ecological, realistic and interactive virtual environments with the attention related nature of the P300 brain waveform to create a cognitive training tool for ASD. The P300-based paradigm that we present here consists on an immersive environment were the subject must follow a non-verbal social agent cue (head turn) and direct his/her attention to the target object. The attentional mental state of the subject is monitored through the detection of oddballs, which leads to a P300 signal which allows giving feedback about his/her attentional focus. The P300 signal is a well-known neural signature of attention processes for detection of rare items in a stimulus series—oddball paradigm—(for a review see Patel and Azzam, 2005; Polich, 2007; Duncan et al., 2009). We decided to couple the training of joint attention skills to the P300 signal because the latter is widely used in focused attention studies, and is related to integration of information with context and memory (Halgren et al., 1995). Moreover, with the automatic detection of P300 signals one can provide direct feedback about the participant's attentional focus. This provides information that the subject can use to self-monitor his/her performance about where to look and subsequently allow ASD subjects to adjust behavior. Given the repetitive nature of this type of oddball paradigm, and its operant learning properties, our motivation for the construction of this paradigm is based on the hypothesis that ASD subjects can assimilate joint attention skills by automating the response to the social cue that is given during the task we created. The current trial set out to assess the feasibility and potential clinical effects of the use of this type of technology in ASD and attempts to assess the use of neurophysiologic-based rehabilitation tools for improving social behavior in ASD.
Apparatus and methods
This was a single-arm clinical feasibility trial study conducted in Portugal.
Prior to subject recruitment, ethical approvals were obtained from the Ethics Commission of the Faculty of Medicine of the University of Coimbra (Comissão de Ética da Faculdade de Medicina da Universidade de Coimbra), the INFARMED-Autoridade Nacional do Medicamento e Produtos de Saúde, I.P. (Portuguese Authority of Medicines and Health Products) and CEIC—Comissão de Ética para a Investigação Clínica (Portuguese Ethics Committee for Clinical Research).
This study and all the procedures were approved and was conducted in accordance with the declaration of Helsinki. All subjects agreed and signed a written informed consent prior to screening procedures and recruitment (clinical-trial ID: NCT02445625-clinicaltrials.gov).
This study and all the procedures were approved and was conducted in accordance with the declaration of Helsinki.
All subjects agreed and signed a written informed consent prior to screening procedures and recruitment (clinical-trial ID: NCT02445625—clinicaltrials.gov).
Participants
Study included 15 adolescents and adults (mean age = 22 years and 2 months, ranging from 16 to 38 years old) with high-functioning ASD (Full-Scale Intelligent Quotient [FSIQ] (Wechsler, 2008): Mean = 102.53; SD = 11.64).
These participants met the inclusion criteria: positive diagnostic results for ASD assigned on the basis of the gold standard instruments: parental or caregiver interview—Autism Diagnostic Interview-Revised (Le Couteur et al., 2003); direct structured subject assessment—Autism Diagnostic Observation Schedule (Lord and Rutter, 1999); and/or the current diagnostic criteria for ASD according to the Diagnostic and Statistical Manual of Mental Disorders, Fifth Edition (DSM-5) (American Psychiatric Association, 2013).
All diagnostic and neuropsychological assessments were performed by a psychologist (SM or IB) under the supervision of a medical doctor—a neurodevelopmental pediatrician (GO) in a face to face standardized situation in our clinical research institute.
Participants were excluded if they had intellectual disability, with a FSIQ inferior to 80 (Wechsler, 2008) and associated medical conditions such as epilepsy, neurocutaneous, or other genetic known syndromes, or other usual comorbidity in ASD samples.
Intervention and apparatus
The baseline visit was used to obtain consent and collect baseline data. Collected baseline data included demographics, medication, neuropsychological measures related to the ASD diagnosis [ADI-R (Le Couteur et al., 2003); ADOS (Lord and Rutter, 1999); and DSM-5 (American Psychiatric Association, 2013) criteria] and intellectual ability (IQ measured by WAIS-III; Wechsler, 2008) and the outcome measures detailed below.
The intervention comprised seven BCI sessions spread over 4 months. The first four sessions weekly and the remaining monthly. Adherence and compliance were evaluated using the following definitions: Adherence was defined as attending all seven BCI sessions. Compliance was assessed based on the percent of subjects who have performed the scheduled number of interventional sessions.
Participants outcome assessments were performed at baseline (session 0), post-training (session 7), and follow-up (6 months post-training).
The baseline visit was in the same day of the session 1. The 7 sessions included BCI intervention, before and after which the participants were asked to complete a questionnaire about how were they feeling in the moment—Profile of Mood States (POMS) (McNair et al., 1992; Faro Viana et al., 2012).
The Primary outcome measure was a customized ecologic “Joint-attention assessment task” (JAAT), assessing the detection of initiation of joint attention cues (from avatars—gazing or pointing cues). We recorded (using eye-tracking) the number of items of social attention that a patient could accurately identify from an avatar's action cues (e.g., looking at, pointing at).
JAAT consisted in four virtual scenarios. The scenarios were as follows:
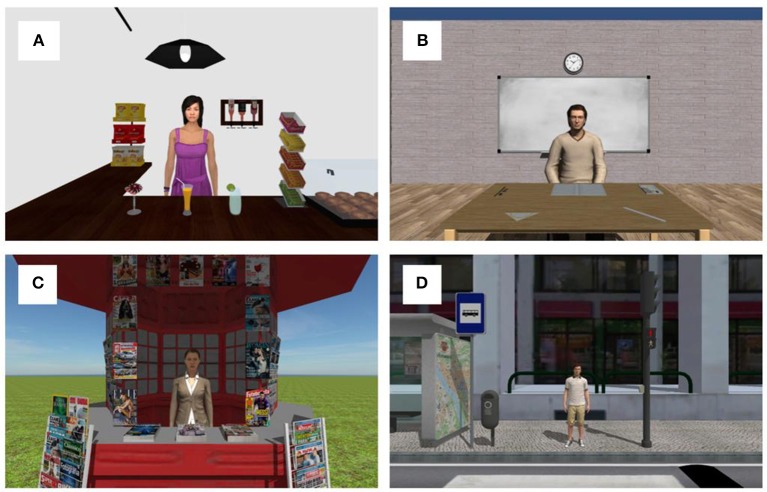
Cafe: interior of a cafe with a maid (avatar) inside the balcony. The viewer's position is in front of the balcony. Several common objects in a cafe (packets of chips, several drinks, chewing gums, bottles, and a lamp) are distributed the around the avatar's position. (Figure 1A);
Classroom: standing in front of a table with a professor (avatar) and with a ruler, a book, a notebook, a protractor, a pencil, and an eraser on top of the table (Figure 1B). The scenario also has another tables and chairs;
Kiosk: standing in front of a street kiosk with the employee inside and several newspapers and magazines scattered on the kiosk, around the employee position (Figure 1C);
Zebra crossing: standing in one side of a street, waiting to cross the zebra crossing, with one person on the other side. The other side of the street has a traffic light, a traffic signal, a garbage can, and a map in a bus stop (Figure 1D).
Figure 1.
Representation of the used scenarios. (A) Cafe scenario; (B) Classroom scenario; (C) Kiosk scenario; (D) Zebra crossing scenario.
Participants were sat in an adjustable rotary office chair wearing the Oculus Rift DK 2 headset. Eye movements were recorded with Eye Tracking HMD package from SMI embedded in the Oculus Rift itself, with sampling rate of 60 Hz, and accuracy of 0.5–1°. The scenes had a 360° perspective and a real-time fully immersive experience. JAAT started with the eye-tracker calibration and validation (5-point validation method built in-house). Next, the presentation of each scenario was done. The order by each scenario was presented was random. The task started with a 30 s free-viewing period followed by a series of avatar animations spaced by between 2 and 2.5 s. The animations were divided in joint attention animations and control animations. The joint attention animations comprise the head turning of the avatar or pointing to one object of interest in the scene.
The animations were repeated two times in a random order which gives a total of 18 joint attention animations in the café scenario, 10 in classroom scenario, 16 in kiosk, and 10 joint attention animations in zebra crossing scenario. The overall joint attention events were 54, and control (no joint attention) animations 32. Control animations included the avatar coughing, rolling the head, scratching the head and yawning. Participants were instructed to act naturally. They were not aware that their eye movements were being recorded.
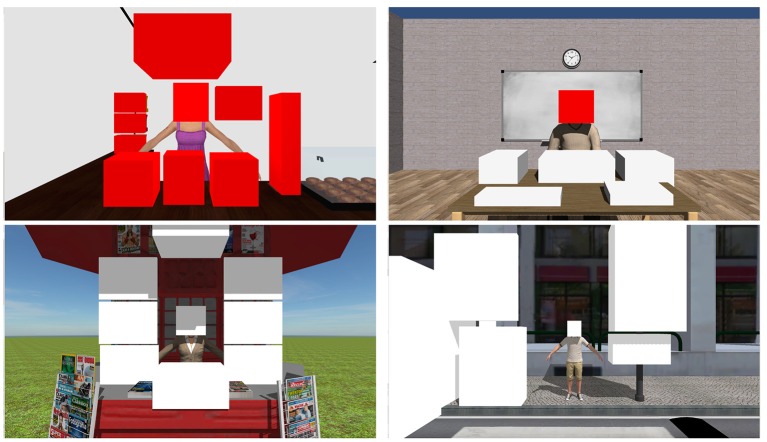
The number of items of social attention that a patient could accurately identify from an avatar's action cues were obtained by defining areas of interest (AI) with 3D boxes. These AI overlap with objects in the scenes that were relevant in the context. For example, the drinks in the cafe, the notebook and the ruler in the classroom, the magazines in the kiosk and the traffic lights on the zebra crossing scenario. AI in each scenario are shown in Figure 2.
Figure 2.
Areas of interest in each scenario of JAAT.
The number of items of social attention were defined as eye fixations inside the AI after the start of the joint attention animation and until between 2 and 2.5 s. We assumed a fixation duration as a fixation with more than 300 ms (based on the range of mean fixation duration in scene perception presented in Rayner, 2009). Inside the JA responses we considered two types of responses:
JAAT_No face—Fixation on the target object of the joint attention animation after the animation starts.
JAAT_Face—Fixation on the target object of the joint attention animation after the animation beginning that is preceded by a fixation on the face of the avatar.
As secondary outcome measures we included the Autism Treatment Evaluation Checklist (ATEC) (Rimland and Edelson, 1999), specifically designed to measure treatment effectiveness, and Vineland Adaptive Behavior Scales (VABS), which focuses on adaptive functioning (Sparrow et al., 1984). Other neuropsychological measures related to mood, anxiety and depression were also assessed: Profile of Mood States (POMS) (McNair et al., 1992; Faro Viana et al., 2012); Hospital Anxiety & Depression Scale (HADS) (Zigmond and Snaith, 1983; Pais-Ribeiro et al., 2007) and Beck Depression Inventory (BDI) (Beck, 1961; Vaz-Serra and Abreu, 1973; Beck and Steer, 1990).
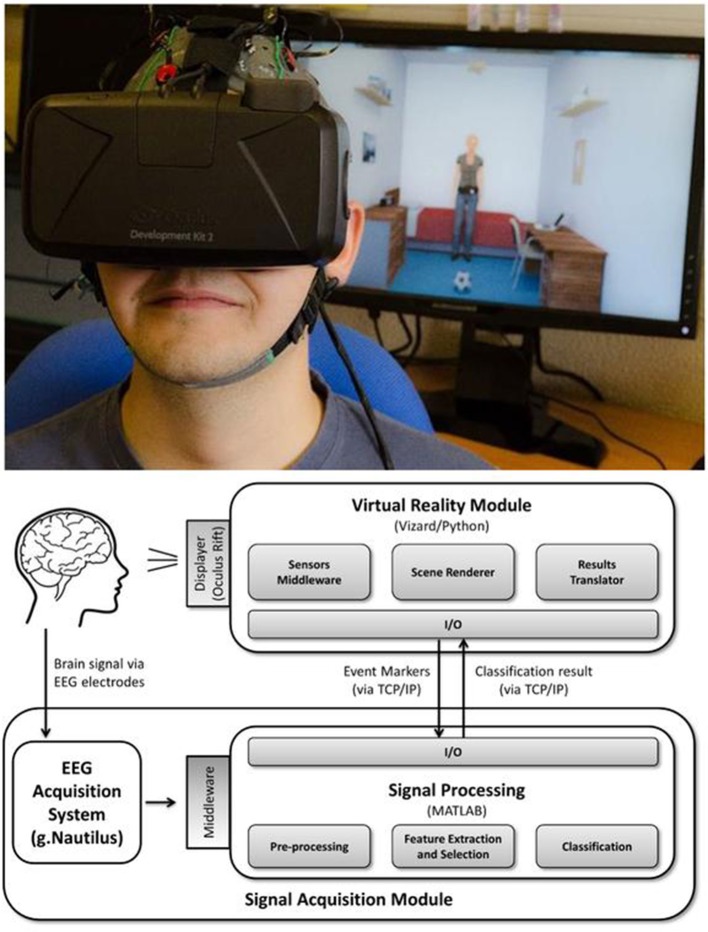
The experimental apparatus used for the BCI interventions is shown in Figure 3.
Figure 3.
BCI apparatus overview. (Top) Person wearing Oculus Rift and g.Nautilus EEG system (part of the virtual reality P300-based BCI) and the observer's viewing window on the screen. (Bottom) Block design of the system. Informed consent was obtained from the individual for the publication of this image.
BCI sessions were carried out in a spacious and quiet room with minimal electrical interference and participants were seated in an adjustable office chair in front of a table.
The virtual reality P300-based BCI paradigm used comprises an immersive virtual environment presented to the participants via the Oculus Rift Development Kit 2 headset (from Oculus VR) which participants wear in front of the eyes during the intervention sessions. An EEG cap was also placed in participants head. The cap had 16 active electrodes that do not require abrasive skin treatment and with completely wireless signal transmission (g.Nautilus from gTEC, Austria). The EEG data were acquired from 8 electrodes positions (C3, Cz, C4, CPz, P3, Pz, P4, POz), the reference was placed at the right ear and the ground electrode was placed at AFz. Sampling rate was set at 250 Hz. EEG data were acquired notch filtered at 50 Hz and passband filtered between 2 and 30 Hz.
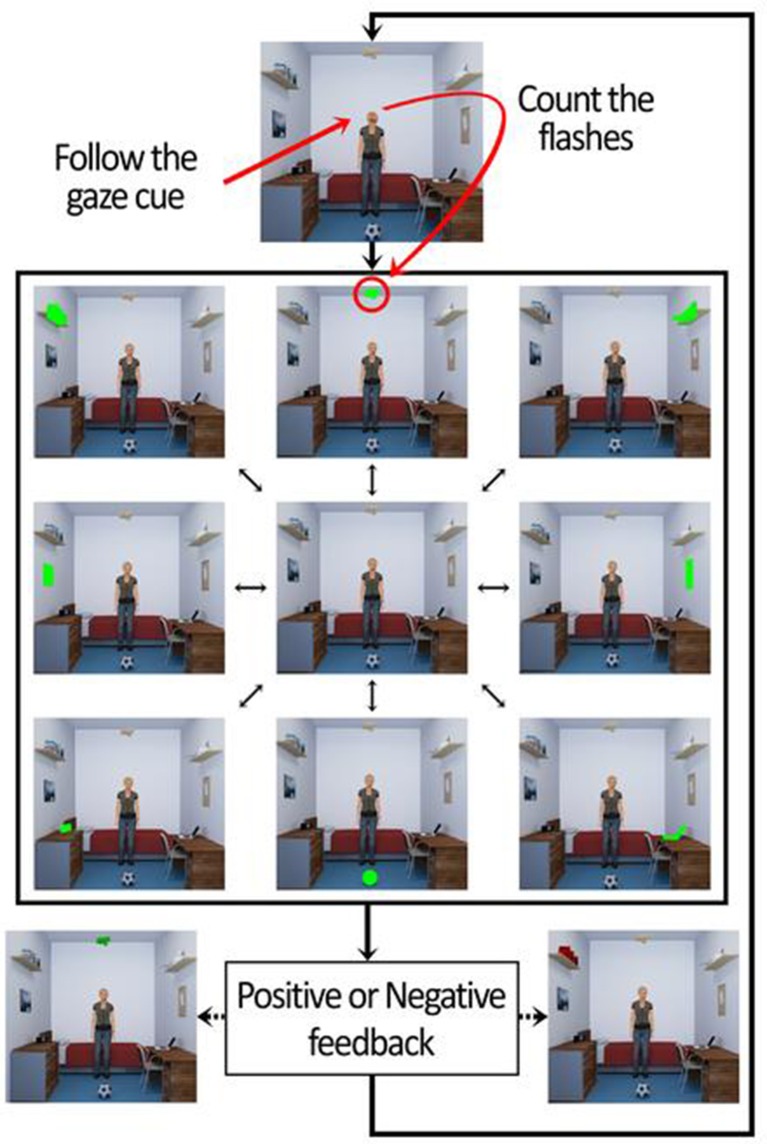
The virtual environment consists in a bedroom with common type of furniture (shelves, a bed, a table, a chair, and a dresser) and objects (frames, books, lights, a printer, a radio, a ball, a door, a window, and a laptop). The BCI task was divided in 3 phases. The first two were part of the calibration process of the BCI, and the last one the online phase. In the first phase the participants were directly and explicitly instructed to attend the target object in order to remove potential errors identifying the target object related with social attention deficits present in ASD. In the second phase the participants were asked about which object was chosen by the avatar (after avatar's animation) to guarantee the user learned to read the social joint attention cue of the avatar and use this information correctly. In the third phase the participants were asked to respond to the head cue of the avatar in the center of the scene, looking to the object of interest. In all the three phases of BCI, after the redirection of attention of participant in each trial, they were asked to mentally count the blinks of the object of interest. Each trial consisted in 10 sequential runs, and each such run consisted of flashing all the 8 objects in the scene (green flashes) in a randomized order: 1. a wooden plane hanging from the ceiling; 2. a printer on a shelf; 3. a corkboard on the wall; 4. a laptop on a table; 5. a ball on the ground; 6. a radio on top of a dresser; 7. a picture on the wall; 8. books on a shelf. The highlight (flash) of each object occurred with an inter-stimulus interval of 200 ms. Each flash had the duration of 100 ms. This gives a total of 80 flashes per trial. Participants performed a total of 70 trials (10 in the first phase, 10 in the second, and 50 in the online phase).
The data recorded from the first 20 calibration trials stores the P300 responses that occurs when the object of interest flashed, and statistical classifiers are used to identify this response. These classifiers are then used in the online phase to identify whether participants were counting the flashes of avatar's object of interest. If it was done properly by the participant the BCI gave a positive feedback (object of interest turns green at the end of the trial). If not, the object turned red. This mechanism is shown in Figure 4. The overall functioning of BCI is explained in detail in Amaral et al. (2017), where we tested the best setup to use in this BCI and also performed pilot tests in ASD participants.
Figure 4.
Sequence of events of the trials in the BCI online phase.
Statistical analysis
Our initial sample size was calculated using the G*Power tool (Faul et al., 2007). Based in other effects described in the literature, the effect size considered is 0.8 (the mean difference is 0.8 standard deviations). In these conditions, for power of 0.8 the estimated sample size is 15. Without the normality assumption of the distribution of the means differences, we would also need 15 subjects, considering a non-parametric test. However, these calculations were used only as a guide for sample size and in keeping with the feasibility design no explicit hypothesis testing was used.
The specific aim of the study was to assess the feasibility and effects of the use of virtual reality P300-based BCI paradigm in ASD. Based on this aforementioned aim, 95% confidence interval for differences in means are presented.
The assumptions of the statistical techniques used were validated. All statistical analysis was realized with the support of the version for Microsoft Windows® of the Statistical Package for Social Sciences, version 19 (SPSS®, Chicago, IL, USA).
Brain computer interface evaluation of signal stability
We tested the stability across the seven sessions of three parameters: the BCI's balanced accuracy (see definition below) of target object detection, the average P300 maximum amplitude across trials and the mean alpha power variation in the band [8 12] Hz per trial. For the latter two, a cluster of the 8 channels was formed. For each subject, a linear regression was computed using the value of each parameter across sessions. The first order coefficient of the linear regressed model was extracted, and its distribution was tested against the hypothesis that its median value was equal to zero, using a Wilcoxon signed rank test. Graphical illustration of the stability of measures across sessions is provided. The tests were performed in Matlab 2014a.
Results
Demographic data are provided in Table 1. Fifteen adolescents and adults (mean age = 22 years and 2 months, ranging from 16 to 38 years old) with high-functioning ASD (Full-Scale Intelligent Quotient [FSIQ] (Wechsler, 2008): Mean = 102.53; SD = 11.64) participated in the study between February 2016 and January 2017. Five patients were medicated (three with a neuroleptic, one with a psychostimulant and another with an antidepressant). We recruited 17 patients, because of two dropouts, which meets the target sample size. Dropouts were due to an eye abnormality in one patient, not reported during the recruitment, and a misdiagnosis of ASD in another patient.
Table 1.
Baseline demographic data.
| n | % or Mean (SD) | |
|---|---|---|
| Age | 15 | 22 years and 2 months (5 years and 6 months) |
| Gender | 15 | 100% Male |
| Education | 15 | Junior Highschool (9 years) 6.67% Incomplete Highschool (11 years)13.33% Highschool (12 years) 66.67% Bachelor 6.67% Master 6.67% |
Table 2 depicts the basic statistics related to core baseline and study specific outcome measures.
Table 2.
Baseline outcome measures.
| n | Mean (SD) | Data completeness % | |
|---|---|---|---|
| CORE OUTCOMES | |||
| ADIR_Social interaction | 14 | 16.14 (4.56) | 93 |
| ADIR_Communication | 14 | 12.14 (5.39) | 93 |
| ADIR _Repetitive and restricted behavior | 14 | 6.14 (2.41) | 93 |
| ADIR_Developmental delay | 14 | 2.21 (1.89) | 93 |
| ADOS _Communication | 15 | 3.20 (0.86) | 100 |
| ADOS_Social interaction | 15 | 6.27 (1.34) | 100 |
| ADOS_Total | 15 | 9.47 (1.92) | 100 |
| DSM_5 Criteria | 15 | 5.73 (0.59) | 100 |
| WAIS-III (FSIQ) | 15 | 102.53 (11.64) | 100 |
| WAIS-III (VIQ) | 15 | 102.33 (16.63) | 100 |
| WAIS-III (PIQ) | 15 | 102.47 (10.97) | 100 |
| HADS_Total | 15 | 10.93 (5.78) | 100 |
| BDI_Total | 15 | 9.13 (6.56) | 100 |
| POMS_Tension | 15 | 6.40 (3.23) | 100 |
| POMS_Depression | 15 | 7.53 (6.13) | 100 |
| POMS_Anger | 15 | 4.00 (3.46) | 100 |
| POMS_Vigour | 15 | 12.53 (6.80) | 100 |
| POMS_Fatigue | 15 | 4.47 (3.96) | 100 |
| POMS_Confusion | 15 | 6.80 (2.68) | 100 |
| POMS_Total | 15 | 116.67 (18.54) | 100 |
| STUDY SPECIFIC OUTCOMES | |||
| JAAT_NoFace | 15 | 16.33 (9.36) | 100 |
| JAAT_Face | 15 | 10.67 (9.35) | 100 |
| ATEC_SPEECH/LANGUAGE/ COMMUNICATION | 15 | 4.07 (1.82) | 100 |
| ATEC_SOCIABILITY | 15 | 12.64 (6.20) | 100 |
| ATEC_SENSORY/COGNITIVE AWARENESS | 15 | 9.50 (5.13) | 100 |
| ATEC_HEALTH/PHYSICAL/BEHAVIOR | 15 | 9.36 (6.25) | 100 |
| ATEC_Total | 15 | 35.57 (12.53) | 100 |
| VABS_COM_S1 | 15 | 68.27 (21.53) | 100 |
| VABS_DLS_S1 | 15 | 77.53 (14.05) | 100 |
| VABS_SOC_S1 | 15 | 65.80 (16.79) | 100 |
| VABS_ABC_S1 | 15 | 65.73 (15.56) | 100 |
Concerning measures of feasibility, they are reported in Table 3.
Table 3.
Primary outcome—feasibility.
| % (n/n) | |
|---|---|
| Recruitment/Consent | 100 |
| Retention (primary end point) | 100 |
| Retention (secondary end point) | 100 |
| Intervention uptake | 100 |
| Adherence/Completion | 100 |
| Compliance | 100 |
| Intervention delivery | 100 |
| Acceptability | 100 |
Although an effect was not found for our primary measure of choice (JAAT), most secondary measures demonstrated a change (Table 4).
Table 4.
Outcomes (for complete baseline and primary follow-up dataset).
| Baseline/Session 1 | Primary follow-up time point (Session 7—post intervention) | Mean difference and 95% CI | ||||
|---|---|---|---|---|---|---|
| n | Mean (SD) | n | Mean (SD) | Mean difference | 95% CI | |
| CORE OUTCOMES | ||||||
| HADS_Total | 15 | 10.93 (5.78) | 15 | 9.13 (4.22) | 1.80 | (−0.40, 4.00) |
| BDI_Total | 15 | 9.13 (6.56) | 15 | 6.67 (5.25) | 2.47 | (0.38, 4.56) |
| POMS_Tension | 15 | 6.40 (3.23) | 15 | 5.20 (5.51) | 1.20 | (−2.06, 4.46) |
| POMS_Depression | 15 | 7.53 (6.13) | 15 | 3.80 (5.20) | 3.73 | (0.49, 6.97) |
| POMS_Anger | 15 | 4.00 (3.46) | 15 | 2.93 (6.12) | 1.07 | (−2.47, 4.60) |
| POMS_Vigour | 15 | 12.53 (6.80) | 15 | 12.87 (7.97) | −0.33 | (−3.67, 3.00) |
| POMS_Fatigue | 15 | 4.47 (3.96) | 15 | 4.67 (5.92) | −0.20 | (−3.20, 2.80) |
| POMS_Confusion | 15 | 6.80 (2.68) | 15 | 6.07 (3.60) | 0.73 | (−1.26, 2.72) |
| POMS_Total | 15 | 116.67 (18.54) | 15 | 109.80 (25.77) | 6.87 | (−7.20, 20.93) |
| STUDY SPECIFIC OUTCOMES | ||||||
| JAAT_NoFace | 15 | 16.33 (9.36) | 15 | 13.73 (8.19) | 2.60 | (−2.20, 7.40) |
| JAAT_Face | 15 | 10.67 (9.35) | 15 | 7.80 (8.77) | 2.87 | (−0.07, 5.80) |
| ATEC_SPEECH/LANGUAGE/COMMUNICATION | 15 | 4.07 (1.82) | 15 | 2.93 (1.64) | 1.07 | (−0.23, 2.37) |
| ATEC_SOCIABILITY | 15 | 12.64 (6.20) | 15 | 8.50 (5.30) | 4.33 | (2.32, 6.35) |
| ATEC_SENSORY/COGNITIVE AWARENESS | 15 | 9.50 (5.13) | 15 | 6.14 (4.93) | 3.47 | (0.90, 6.03) |
| ATEC_HEALTH/PHYSICAL/BEHAVIOR | 15 | 9.36 (6.25) | 15 | 6.57 (5.39) | 2.80 | (0.65, 4.95) |
| ATEC_Total | 15 | 35.57 (12.53) | 15 | 24.29 (12.90) | 11.53 | (5.33, 17.74) |
| VABS_COM | 15 | 68.27 (21.53) | 15 | 71.33 (21.62) | −3.07 | (−8.37, 2.24) |
| VABS_DLS | 15 | 77.53 (14.05) | 15 | 81.60 (14.46) | −4.07 | (−6.40, −1.73) |
| VABS_SOC | 15 | 65.80 (16.79) | 15 | 67.67 (16.18) | −1.87 | (−4.44, 0.70) |
| VABS_ABC | 15 | 65.73 (15.56) | 15 | 69.00 (15.20) | −3.27 | (−5.48, −1.06) |
Table 4 shows the analysis of the clinical outcomes for complete baseline and primary follow-up. The analysis revealed no noticeable change in the total number of social attention items that a patient can accurately identify from avatar's action cues (JAAT_NoFace and JAAT_Face). On the other hand, there was variation in total ATEC scores, as well as in Sociability, Sensory/Cognitive Awareness, and Health/Physical/Behavior. Significant effects in Adapted Behavior Composite and in DLS (total and a subarea from VABS) were also observed. The depression subscale from POMS scores (POMS_Depression) showed a difference between the baseline and the primary follow-up time point. The mood disturbance/depression (BDI) scale also showed a change after the intervention.
In sum, we observed a 32% average decrease in total ATEC, rated autism symptoms (34% in Sociability; 37% in Sensory/Cognitive Awareness; 29% in Health/Physical/Behavior); 5% average improvement in Adapted Behavior Composite and 5% in DLS, subarea from VABS; 50% average decrease in Depression subscale from POMS and 27% average decrease in mood disturbance/depression (BDI).
Table 5 shows the analysis of the clinical outcomes for complete baseline and secondary follow-up. JAAT_NoFace and JAAT_Face scores also revealed no differences between baseline and the secondary follow-up time point. There were positive effects in all subscales (Speech/Language/Communication, Sociability, Sensory/Cognitive Awareness, and Health/Physical/Behavior) from ATEC and in ATEC total scores. There were also changes in Adapted Behavior Composite and in all subareas from VABS (COM, DLS, SOC).
Table 5.
Outcomes for complete baseline and secondary follow-up dataset.
| Baseline | Secondary follow-up time point (post intervention) | Mean difference and 95% CI | ||||
|---|---|---|---|---|---|---|
| n | Mean (SD) | n | Mean (SD) | Mean difference | 95% CI | |
| STUDY SPECIFIC OUTCOMES | ||||||
| JAAT_NoFace | 15 | 16.33 (9.36) | 15 | 15.00 (10.02) | 1.33 | (−4.47, 7.14) |
| JAAT_Face | 15 | 10.67 (9.35) | 15 | 7.53 (8.11) | 3.13 | (−2.00, 8.27) |
| ATEC_SPEECH/LANGUAGE/COMMUNICATION | 15 | 4.07 (1.82) | 14 | 1.79 (1.42) | 2.29 | (0.94, 3.63) |
| ATEC_SOCIABILITY | 15 | 12.64 (6.20) | 14 | 6.57 (5.14) | 6.07 | (3.23, 8.91) |
| ATEC_SENSORY/COGNITIVE AWARENESS | 15 | 9.50 (5.13) | 14 | 5.21 (4.28) | 4.29 | (1.31, 7.26) |
| ATEC_HEALTH/PHYSICAL/BEHAVIOR | 15 | 9.36 (6.25) | 14 | 4.86 (4.35) | 4.50 | (2.65, 6.35) |
| ATEC_Total | 15 | 35.57 (12.53) | 14 | 18.43 (11.77) | 17.14 | (10.38, 23.91) |
| VABS_COM | 15 | 68.27 (21.53) | 14 | 73.14 (17.29) | −7.36 | (−12.53, −2.18) |
| VABS_DLS | 15 | 77.53 (14.05) | 14 | 86.29 (14.02) | −10.14 | (−12.58, −7.71) |
| VABS_SOC | 15 | 65.80 (16.79) | 14 | 71.14 (16.11) | −6.79 | (−10.13, −3.44) |
| VABS_ABC | 15 | 65.73 (15.56) | 14 | 72.00 (13.65) | −8.21 | (−10.66, −5.77) |
No serious adverse events were reported.
Brain computer interface evaluation of signal stability
We analyzed whether the signal quality and performance of our brain computer interface remained stable across intervention sessions. Figure 5 shows across session balanced accuracy of our online classifier.
Figure 5.
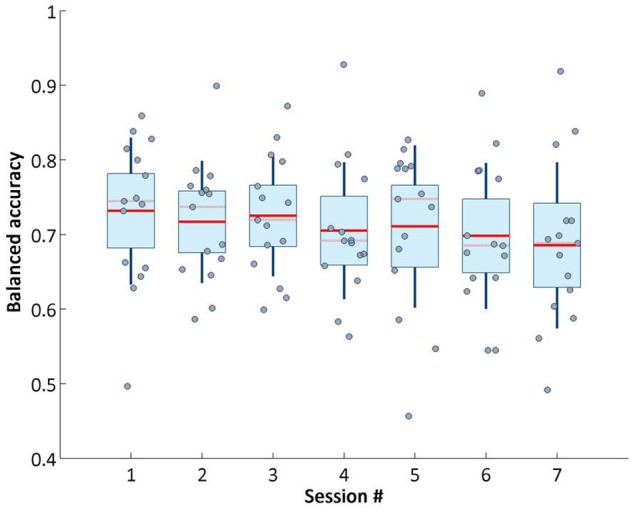
Balanced accuracy of target object detection on online phase across sessions.
The unbalanced nature of the data set (the non-target objects flashes are 8 times more than the target ones, because of the different occurrence probability) makes the balanced accuracy the more reliable metric for assessing the classifier performance (Brodersen et al., 2010). Balanced accuracy is calculated following the formula: (Specificity+Sensitivity)/2. This value did not vary greatly across sessions. Although the overall trend decreased very slightly from session 1 to 7, our system retained stable performance across visits.
Concerning the P300 signal, which is pivotal for decoding attention related information, it also remained stable across sessions, as shown in Figure 6. Average P300 maximum amplitude was calculated averaging the maximum amplitude values (between 250 and 500 ms after the flashes onset) of the averaged event-related potentials of the target object flashes in the third phase of BCI (online).
Figure 6.
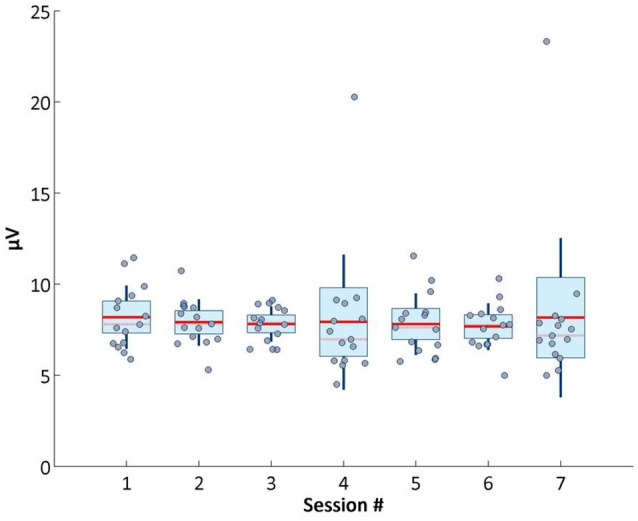
Average P300 maximum amplitude across sessions.
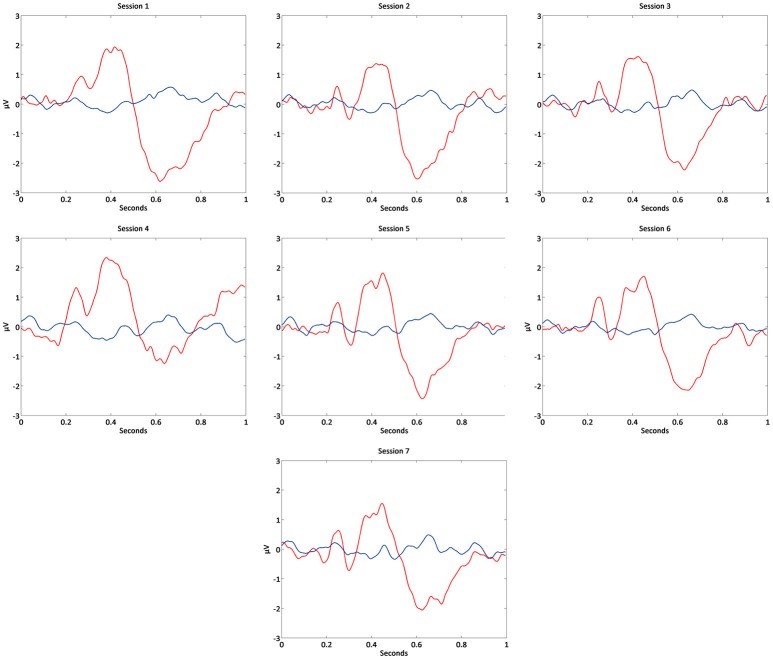
In Figure 7 it is possible to observe the P300 waveform across sessions.
Figure 7.
Grand-average of event-related potentials in each BCI session of Cz channel.
Accordingly, P300 maximum amplitude did not vary and was statistical verified, demonstrating the presence of stable attention related signals across visits. Stability of neurophysiological patterns was further examined by investigating changes in alpha modulation (Figure 8), and remained around similar levels across sessions.
Figure 8.
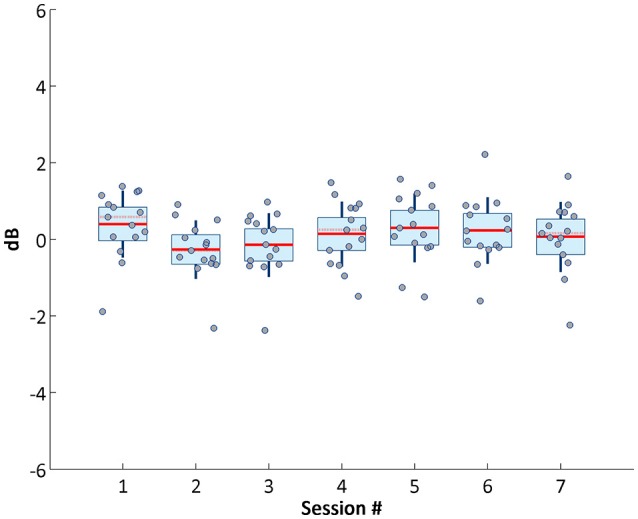
Average alpha power across sessions.
Discussion
In this study we assessed a virtual reality P300-based BCI paradigm in ASD. Our device coupled an interactive virtual environment with the attention signature of the P300 brain waveform, featuring a cognitive training tool for ASD. Participants had to follow a non-verbal social agent cue. As a cautionary note, the fact that a P300 signal can be detected with high accuracy does not necessarily imply that the stimulus is suitable and well tolerated. Nevertheless, the current trial proved the feasibility and potentially useful clinical effects of the use of this type of technology in ASD.
Although the main goal of the study was not to test efficacy measures, some relevant effects were observed, even in spite of the fact that our eye-tracking based assessment tool did not show a change in the total number of social attention items that a patient can accurately identify from avatar's action cues (JAAT_NoFace and JAAT_Face, only a small non-significant trend is visible possibly due to familiarity).
However, in the primary follow-up time point, there was an effect on total ATEC scores, which translates to a decrease in the severity of autism symptoms (specifically the ones related to Sociability and Sensory/Cognitive Awareness) as wells as the ones reported as more general symptoms (Health/Physical/Behavior). Effects in Adapted Behavior Composite and in DLS (subareas from VABS) were observed. The daily living skills (DLS) are one of the most compromised areas in ASD and an improvement in this area translates in a better integration in the daily routines, and improved self-sufficiency.
In the secondary follow-up time point, analysis replicated the maintenance of positive changes observed at the in the primary follow-up time point, which is noteworthy, because a decay of effects did not occur, and significance was still present.
JAAT_NoFace and JAAT_Face scores did not alter between baseline and the secondary follow-up time point.
There were positive effects in all subscales from ATEC and in ATEC total scores. There were also changes in Adapted Behavior Composite and in all subareas from VABS.
Our study suggests a long term beneficial effect in patient's mood/mental state. This effect cannot at this stage be causally attributed to specific mechanisms related the intervention, but gives a good insight about the structure of the intervention, the compliance and reliability of the measures used, which show long term significant effects.
Strengths and limitations
As strengths, we can list the high compliance, low/null dropout rates, and signal to noise stability and decoding accuracy of our BCI system across all seven sessions. Moreover, and in spite of the fact that our custom primary outcome measure failed to show improvement, most secondary clinical outcome measures (ATEC and VABS) suggested improvement. This improvement was maintained in the 6-months follow-up assessment, which reinforces the potential utility of these kind of interventions and the validity of this measures.
As limitations, we note the customized nature of our chosen primary outcome measure, which had no prior clinical validation, unlike the secondary measures. Moreover, in spite of the relatively realistic nature of our VR environment it can further be improved to train in a more effective way social attention skills.
Implications for practice and research
Given the very low rate of dropouts and the good classification accuracy over sessions, with stable neurophysiological signals, the system proves to be feasible as a tool in future efficacy trials. Given that several of the secondary clinical outcome measures showed improvement, we propose to use one of them (ATEC, VABS) or a combination of scores as the primary outcome measure in a future Phase 2 b clinical trial.
Data availability statement
The raw data supporting the conclusions of this manuscript will be made available by the authors, without undue reservation, to any qualified researcher.
Author contributions
CA, SM, MS, RP, RM, GO, and MC-B conceived and designed the study. CA, SM, HP, and IB performed the study. CA and SM analyzed the data. CA, SM, HP, IB, HQ, and MC-B contributed with recruitment, data collection and tools. CA, SM, RP, and MC-B wrote the paper. All authors read and approved the final manuscript.
Conflict of interest statement
The authors declare that the research was conducted in the absence of any commercial or financial relationships that could be construed as a potential conflict of interest.
Acknowledgments
We would like to acknowledge the Associação Portuguesa para as Perturbações do Desenvolvimento e Autismo (APPDA) from Coimbra and Viseu for their collaboration in the patient recruitment.
We would also like to acknowledge Professor Kerry Hood, Dr. Chao Huang, Gareth Watson, Sam Clarkstone, Vince Poile, and Liz Randell at the Centre for Trials Research at Cardiff University for their expertise and support in trial design, statistics, database development, and trial management throughout the research process.
Footnotes
Funding. This work was supported by FTC—Portuguese national funding agency for science, research, and technology [Grants PAC—MEDPERSYST, POCI-01-0145-FEDER-016428, COMPETE2020, POCI 030852, BIGDATIMAGE, CENTRO-01-0145-FEDER-000016 financed by Centro 2020 FEDER, COMPETE, FCT-UID/4539/2013—COMPETE, POCI-01-0145-FEDER-007440, and Fellowships SFRH/BD/78982/2011;SFRH/BD/77044/2011; SFRH/BD/102779/2014 and SFRH/BPD/101641/2014]; FLAD Life Sciences 2016, and the BRAINTRAIN Project—Taking imaging into the therapeutic domain: Self-regulation of brain systems for mental disorders [FP7-HEALTH-2013-INNOVATION-1–602186 20, 2013].
References
- Amaral C. P., Simões M. A., Mouga S., Andrade J., Castelo-Branco M. (2017). A novel Brain Computer Interface for classification of social joint attention in autism and comparison of 3 experimental setups: a feasibility study. J. Neurosci. Methods 290, 105–115. 10.1016/j.jneumeth.2017.07.029 [DOI] [PubMed] [Google Scholar]
- American Psychiatric Association (2013). Diagnostic and Statistical Manual of Mental Disorders, 5th Edn. Arlington, VA: American Psychiatric Association. [Google Scholar]
- Astrand E., Wardak C., Ben Hamed S. (2014). Selective visual attention to drive cognitive brain-machine interfaces: from concepts to neurofeedback and rehabilitation applications. Front. Syst. Neurosci. 8:144. 10.3389/fnsys.2014.00144 [DOI] [PMC free article] [PubMed] [Google Scholar]
- Bakeman R., Adamson L. B. (1984). Coordinating attention to people and objects in mother-infant and peer-infant interaction. Child Dev. 55, 1278–1289. [PubMed] [Google Scholar]
- Baron-Cohen S. (1989). Perceptual role taking and protodeclarative pointing in autism. Br. J. Dev. Psychol. 7, 113–127. 10.1111/j.2044-835X.1989.tb00793.x [DOI] [Google Scholar]
- Baron-Cohen S., Baldwin D. A., Crowson M. (1997). Do children with autism use the speaker's direction of gaze strategy to crack the code of language? Child Dev. 68, 48–57. [PubMed] [Google Scholar]
- Baxter A. J., Brugha T. S., Erskine H. E., Scheurer R. W., Vos T., Scott J. G. (2015). The epidemiology and global burden of autism spectrum disorders. Psychol. Med. 45, 601–613. 10.1017/S003329171400172X [DOI] [PubMed] [Google Scholar]
- Beck A. T. (1961). Beck depression inventory. Depression 2006, 2–4. [Google Scholar]
- Beck A. T., Steer R. A. (1990). Manual for the beck anxiety inventory. Behav. Res. Ther. 37, 25–74. [Google Scholar]
- Bekele E., Crittendon J., Zheng Z., Swanson A., Weitlauf A., Warren Z., et al. (2014). Assessing the utility of a virtual environment for enhancing facial affect recognition in adolescents with autism. J. Autism Dev. Disord. 44, 1641–1650. 10.1007/s10803-014-2035-8 [DOI] [PMC free article] [PubMed] [Google Scholar]
- Boshoff K., Gibbs D., Phillips R. L., Wiles L., Porter L. (2016). Parents' voices: ‘why and how we advocate'. A meta-synthesis of parents’ experiences of advocating for their child with autism spectrum disorder. Child Care Health Dev. 42, 784–797. 10.1111/cch.12383 [DOI] [PubMed] [Google Scholar]
- Brodersen K. H., Ong C. S., Stephan K. E., Buhmann J. M. (2010). The balanced accuracy and its posterior distribution, in 20th International Conference on Pattern Recognition (Istanbul: ), 3121–3124. 10.1109/ICPR.2010.764 [DOI] [Google Scholar]
- Charman T. (1998). Specifying the nature and course of the joint attention impairment in autism in the preschool years. Autism 2, 61–79. 10.1177/1362361398021006 [DOI] [Google Scholar]
- Charman T. (2003). Why is joint attention a pivotal skill in autism? Philos. Trans. R. Soc. B Biol. Sci. 358, 315–324. 10.1098/rstb.2002.1199 [DOI] [PMC free article] [PubMed] [Google Scholar]
- Christensen D. L., Baio J., Braun K. V. N., Bilder D., Charles J., Constantino J. N., et al. (2016). Prevalence and characteristics of autism spectrum disorder among children aged 8 years - autism and developmental disabilities monitoring network, 11 sites, United States, 2012. Morb. Mortal. Wkly. Rep. Surveill. Summ. 65, 1–23. 10.15585/mmwr.ss6503a1 [DOI] [PMC free article] [PubMed] [Google Scholar]
- Dawson G., Toth K., Abbott R., Osterling J., Munson J., Estes A., et al. (2004). Early social attention impairments in autism: social orienting, joint attention, and attention to distress. Dev. Psychol. 40, 271–283. 10.1037/0012-1649.40.2.271 [DOI] [PubMed] [Google Scholar]
- Duncan C. C., Barry R. J., Connolly J. F., Fischer C., Michie P. T., Näätänen R., et al. (2009). Event-related potentials in clinical research: guidelines for eliciting, recording, and quantifying mismatch negativity, P300, and N400. Clin. Neurophysiol. 120, 1883–1908. 10.1016/j.clinph.2009.07.045 [DOI] [PubMed] [Google Scholar]
- Faro Viana M., Almeida P., Santos R. C. (2012). Adaptação portuguesa da versão reduzida do Perfil de Estados de Humor – POMS. Anál. Psicol. 19, 77–92. 10.14417/ap.345 [DOI] [Google Scholar]
- Farwell L. A., Donchin E. (1988). Talking off the top of your head: toward a mental prosthesis utilizing event-related brain potentials. Electroencephalogr. Clin. Neurophysiol. 70, 510–523. 10.1016/0013-4694(88)90149-6 [DOI] [PubMed] [Google Scholar]
- Faul F., Erdfelder E., Lang A.-G., Buchner A. (2007). G*Power 3: a flexible statistical power analysis program for the social, behavioral, and biomedical sciences. Behav. Res. Methods 39, 175–191. 10.3758/BF03193146 [DOI] [PubMed] [Google Scholar]
- Friedrich E. V., Suttie N., Sivanathan A., Lim T., Louchart S., Pineda J. A. (2014). Brain-computer interface game applications for combined neurofeedback and biofeedback treatment for children on the autism spectrum. Front. Neuroeng. 7:21. 10.3389/fneng.2014.00021 [DOI] [PMC free article] [PubMed] [Google Scholar]
- Georgescu A. L., Kuzmanovic B., Roth D., Bente G., Vogeley K. (2014). The use of virtual characters to assess and train non-verbal communication in high-functioning autism. Front. Hum. Neurosci. 8:807. 10.3389/fnhum.2014.00807 [DOI] [PMC free article] [PubMed] [Google Scholar]
- Golan O., Baron-Cohen S. (2006). Systemizing empathy: teaching adults with Asperger syndrome or high-functioning autism to recognize complex emotions using interactive multimedia. Dev. Psychopathol. 18, 591–617. 10.1017/S0954579406060305 [DOI] [PubMed] [Google Scholar]
- Halgren E., Baudena P., Clarke J. M., Heit G., Marinkovic K., Devaux B., et al. (1995). Intracerebral potentials to rare target and distractor auditory and visual stimuli. II. Medial, lateral and posterior temporal lobe. Electroencephalogr. Clin. Neurophysiol 94, 229–250. 10.1016/0013-4694(95)98475-N [DOI] [PubMed] [Google Scholar]
- Harrop C., McBee M., Boyd B. A. (2016). How are child restricted and repetitive behaviors associated with caregiver stress over time? A parallel process multilevel growth model. J. Autism Dev. Disord. 46, 1773–1783. 10.1007/s10803-016-2707-7 [DOI] [PubMed] [Google Scholar]
- Jones S., Bremer E., Lloyd M. (2016). Autism spectrum disorder: family quality of life while waiting for intervention services. Qual. Life Res. 26, 331–342. 10.1007/s11136-016-1382-7 [DOI] [PubMed] [Google Scholar]
- Karst J. S., Van Hecke A. V. (2012). Parent and family impact of autism spectrum disorders: a review and proposed model for intervention evaluation. Clin. Child Fam. Psychol. Rev. 15, 247–277. 10.1007/s10567-012-0119-6 [DOI] [PubMed] [Google Scholar]
- Kleih S. C., Kaufmann T., Zickler C., Halder S., Leotta F., Cincotti F., et al. (2011). Out of the frying pan into the fire-the P300-based BCI faces real-world challenges. Prog. Brain Res. 194, 27–46. 10.1016/B978-0-444-53815-4.00019-4 [DOI] [PubMed] [Google Scholar]
- Klin A. (2002). Visual fixation patterns during viewing of naturalistic social situations as predictors of social competence in individuals with autism. Arch. Gen. Psychiatry 59, 809–816. 10.1001/archpsyc.59.9.809 [DOI] [PubMed] [Google Scholar]
- Larson E. B., Feigon M., Gagliardo P., Dvorkin A. Y. (2014). Virtual reality and cognitive rehabilitation: a review of current outcome research. NeuroRehabilitation 34, 759–772. 10.3233/NRE-141078 [DOI] [PubMed] [Google Scholar]
- Larson M. J., South M., Krauskopf E., Clawson A., Crowley M. J. (2011). Feedback and reward processing in high-functioning autism. Psychiatry Res. 187, 198–203. 10.1016/j.psychres.2010.11.006 [DOI] [PubMed] [Google Scholar]
- Le Couteur A., Lord C., Rutter M. (2003). The Autism Diagnostic Interview-Revised (ADI-R). (Los Angeles, CA: Western Psychological Services), 659–685. [Google Scholar]
- Leekam S. R., Moore C. (2001). The development of attention and joint attention in children with autism, in The Development of Autism: Perspectives from Theory and Research, eds Burack J. A., Charman T., Yirmiya N., Zelazo P. R. (New Jersey, NJ: Lawrence Erlbaum; ), 105–129. [Google Scholar]
- Lord C., Rutter M. (1999). Autism Diagnostic Observation Schedule-WPS (ADOS-WPS). Los Angeles, CA: Western Psychological and Counseling Services. [Google Scholar]
- Lyall K., Croen L., Daniels J., Fallin M. D., Ladd-Acosta C., Lee B. K., et al. (2017). The changing epidemiology of autism spectrum disorders. Annu. Rev. Public Health 38, 81–102. 10.1146/annurev-publhealth-031816-044318 [DOI] [PMC free article] [PubMed] [Google Scholar]
- Mak J. N., Arbel Y., Minett J. W., McCane L. M., Yuksel B., Ryan D., et al. (2011). Optimizing the P300-based brain-computer interface: current status, limitations and future directions. J. Neural Eng. 8:25003. 10.1088/1741-2560/8/2/025003 [DOI] [PubMed] [Google Scholar]
- McNair D. M., Lorr M., Droppleman L. F. (1992). Profile of Mood States Manual. San Diego, CA: Educational and Industrial Testing Service. [Google Scholar]
- Oliveira G., Ataíde A., Marques C., Miguel T. S., Coutinho A. M., Mota-Vieira L., et al. (2007). Epidemiology of autism spectrum disorder in Portugal: prevalence, clinical characterization, and medical conditions. Dev. Med. Child Neurol. 49, 726–733. 10.1111/j.1469-8749.2007.00726.x [DOI] [PubMed] [Google Scholar]
- Pais-Ribeiro J., Silva I., Ferreira T., Martins A., Meneses R., Baltar M. (2007). Validation study of a Portuguese version of the hospital anxiety and depression scale. Psychol. Health Med. 12, 225–237. 10.1080/13548500500524088 [DOI] [PubMed] [Google Scholar]
- Patel S. H., Azzam P. N. (2005). Characterization of N200 and P300: selected studies of the Event-Related Potential. Int. J. Med. Sci. 2, 147–154. 10.7150/ijms.2.147 [DOI] [PMC free article] [PubMed] [Google Scholar]
- Polich J. (2007). Updating P300: an integrative theory of P3a and P3b. Clin. Neurophysiol. 118, 2128–2148. 10.1016/j.clinph.2007.04.019 [DOI] [PMC free article] [PubMed] [Google Scholar]
- Rayner K. (2009). Eye movements and attention in reading, scene perception, and visual search. Q. J. Exp. Psychol. 62, 1457–1506. 10.1080/17470210902816461 [DOI] [PubMed] [Google Scholar]
- Rimland B., Edelson M. (1999). Autism Treatment Evaluation Checklist. SanDiego, CA: Autism Research Institute. [Google Scholar]
- Salisbury D. B., Dahdah M., Driver S., Parsons T. D., Richter K. M. (2016). Virtual reality and brain computer interface in neurorehabilitation. Proc. (Bayl. Univ. Med. Cent). 29, 124–127. Available online at: http://www.pubmedcentral.nih.gov/articlerender.fcgi?artid=PMC4790543 [DOI] [PMC free article] [PubMed] [Google Scholar]
- Schlebusch L., Samuels A. E., Dada S. (2016). South African families raising children with autism spectrum disorders: relationship between family routines, cognitive appraisal and family quality of life. J. Intellect. Disabil. Res. 60, 412–423. 10.1111/jir.12292 [DOI] [PubMed] [Google Scholar]
- Sparrow S., Balla D. A., Cicchetti D. V. (1984). Vineland Adaptative Behaviour Scales: Interview Edition, Survey Form. Circle Pines, MN: American Guidance Service. [Google Scholar]
- Swettenham J., Baron-Cohen S., Charman T., Cox A., Baird G., Drew A., et al. (1998). The frequency and distribution of spontaneous attention shifts between social and nonsocial stimuli in autistic, typically developing, and nonautistic developmentally delayed infants. J. Child Psychol. Psychiatry 39, 747–753. 10.1017/S0021963098002595 [DOI] [PubMed] [Google Scholar]
- Tankus A., Fried I., Shoham S. (2014). Cognitive-motor brain-machine interfaces. J. Physiol. Paris 108, 38–44. 10.1016/j.jphysparis.2013.05.005 [DOI] [PMC free article] [PubMed] [Google Scholar]
- Vaz-Serra A., Abreu J. (1973). Aferição dos quadros clínicos depressivos I: ensaio de aplicação do “Inventário Depressivo de Beck” a uma amostra portuguesa de doentes deprimidos. Coimbra Med. 20, 623–644. [Google Scholar]
- Wainer A. L., Ingersoll B. R. (2011). The use of innovative computer technology for teaching social communication to individuals with autism spectrum disorders. Res. Autism Spectr. Disord. 5, 96–107. 10.1016/j.rasd.2010.08.002 [DOI] [Google Scholar]
- Wechsler D. (2008). Escala de Inteligência de Wechsler Para Adultos -3.a edição: Manual [Wechsler Adult Intelligence Scale-3rd Edn. Manual]. Lisbon: CEGOC-TEA. [Google Scholar]
- Wolpaw J., Wolpaw E. W. (2012). Brain–Computer Interfaces. Principles and Practice. Oxford University Press; 10.1093/acprof:oso/9780195388855.001.0001 [DOI] [Google Scholar]
- Zigmond A. S., Snaith R. P. (1983). The hospital anxiety and depression scale. Acta Psychiatr. Scand. 67, 361–370. 10.1111/j.1600-0447.1983.tb09716.x [DOI] [PubMed] [Google Scholar]
Associated Data
This section collects any data citations, data availability statements, or supplementary materials included in this article.
Data Availability Statement
The raw data supporting the conclusions of this manuscript will be made available by the authors, without undue reservation, to any qualified researcher.


