Significance
The dynamics in many complex systems is essentially heterogeneous and involves a series of discrete events—in particular, local structural changes. The nature and scale of these changes may vary greatly, ranging from rearrangements of atomic positions during phase transitions to displacements of tectonic plates during earthquakes. In this work, we introduce X-ray photon correlation spectroscopy (XPCS) as a powerful tool for investigating heterogeneous dynamics of interfaces. We observe the motion of ferroelectric domain walls by means of XPCS and obtain the information about nanoscale changes, which is inaccessible for other techniques. Further experiments can provide important insights into the mechanisms of unusual properties of materials such as anomalously large piezoelectric response in relaxor-based ferroelectrics and magnetoelectric coupling in multiferroics.
Keywords: domain walls, ferroelectrics, X-ray photon correlation spectroscopy, speckle patterns, PZT
Abstract
Technologically important properties of ferroic materials are determined by their intricate response to external stimuli. This response is driven by distortions of the crystal structure and/or by domain wall motion. Experimental separation of these two mechanisms is a challenging problem which has not been solved so far. Here, we apply X-ray photon correlation spectroscopy (XPCS) to extract the contribution of domain wall dynamics to the overall response. Furthermore, we show how to distinguish the dynamics related to the passing of domain walls through the periodic (Peierls) potential of the crystal lattice and through the random potential caused by lattice defects (pinning centers). The approach involves the statistical analysis of correlations between X-ray speckle patterns produced by the interference of coherent synchrotron X-rays scattered from different nanosize volumes of the crystal and identification of Poisson-type contribution to the statistics. We find such a contribution in the thermally driven response of the monoclinic phase of a ferroelectric PbZr0.55Ti0.45O3 crystal and calculate the number of domain wall jumps in the studied microvolume.
Many applications of ferroelectric materials are based on the dynamical properties of domain walls. For example, polarization switching in ferroelectric random access memory (FeRAM) devices proceeds through domain wall motion (1). This motion can contribute greatly not only to the performance of FeRAM, but also to that of piezoelectric actuators, sensors, and dielectric capacitors (2, 3). Domain walls can enhance electrical conductivity (4, 5), create superconductivity (6), and trigger multiferroicity (7). Therefore, domain engineering provides intriguing opportunities for nanoelectronic devices (8).
While the static morphology (structure) of domains on different (down to atomic) length scales has been studied extensively and fruitfully using, for example, polarized light (9), electron (10, 11), confocal Raman (12), or piezoresponse force (13) microscopy, the experimental characterization of domain wall dynamics has not been so successful. Ferroelectric and ferroelastic domain wall displacements can be commonly modeled by a series of stop-and-go motions (jerks) between the wells of a multiwell energy landscape. This landscape consists of both periodically located wells (Peierls “atomic washboard” crystalline potential) originating from the interactions between the wall and the regular crystal lattice (14, 15) and randomly distributed wells (pinning centers) caused by defects of crystal structures (16). This picture mainly rests on indirect experimental data such as Barkhausen pulses in switching current (17), dielectric and piezoelectric nonlinearity in ferroelectrics (18), or crackling noise in ferroelastics (19) induced by external fields.
Novel ferroelectric materials have emerged recently showing an extraordinary potential in their respective application fields. The role of the domain wall dynamics in these materials is currently under debate. In particular, the highest piezoelectric performance of relaxor-based ferroelectrics is achieved in the composition range of the morphotropic phase boundary (MPB), where a complex hierarchical nanodomain and microdomain structure is observed (20). The mechanisms of the enhanced piezoelectricity in these materials have been the subject of intensive investigation, and a number of microscopic models have been proposed. Among them are models relating the piezoresponse to extrinsic reasons, in particular to the displacement of domain walls (21). Alternatively, a giant piezoresponse could be of intrinsic nature and related to an energetically favorable, field-induced rotation of spontaneous polarization (22). Experimental identification, separation, and characterization of these different mechanisms are challenging tasks. Accordingly, the underlying mechanisms of the response remain unverified. Another example that raises similar problems is the multiferroic composites where extraordinary magnetoelectric coupling (23) has been found to be mediated by strain (24). However, it is still not clear whether the strain results from domain wall displacements or from changes in the lattice parameters. Basically, there are no experimental methods to determine if and how the domain walls move under an external (small-signal) stimulus and thereby contribute to the total response.
Here, we present a successful investigation of the dynamics of ferroelectric domain walls using X-ray photon correlation spectroscopy (XPCS). XPCS involves collecting X-ray speckle patterns—that is, extremely detailed scattering patterns originating from the interaction of a coherent synchrotron X-ray beam with the sample (25). It is usually based on the analysis of the temporal evolution of speckles and has been used for studying slow dynamics in polymers (26), hydrodynamics of colloidal suspensions (27), capillary wave dynamics in polymer films (28), atomic diffusion in metallic alloys (29), nanoscale domain wall fluctuations in antiferromagnetic crystals (30), etc. As for ferroelectrics, coherent X-ray scattering speckle patterns have been studied at temperatures above the Curie point and related to heterophase fluctuations (31).
We investigate in this work a single crystal of lead zirconate titanate PbZr1-xTixO3 (PZT) with the composition close to the MPB (x = 0.45) where the electromechanical, dielectric, and pyroelectric properties are enhanced (32). Using XPCS, we confirm that the ferroelectric domain wall motion proceeds via a series of distinct jumps. Using statistical data analysis, we separate the contribution of these jumps to the XPCS correlation function from other contributions and characterize the domain wall dynamics quantitatively. In particular, our calculations show that a 1 K change in temperature may induce ∼20–40 domain wall jumps over the Peierls potential barriers in a volume of ∼1 μm3 in the monoclinic phase of PZT. This information provides a valuable input for the theoretical modeling of ferroic domain wall dynamics in general.
Results
Experimental Details.
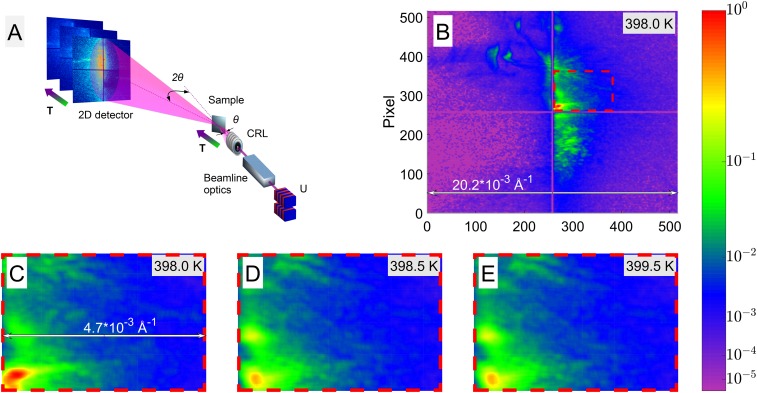
The experiment was carried out on a (001)-oriented platelet of a PbZr0.55Ti0.45O3 single crystal, similar to that studied previously (33). Polarized light microscopy investigations revealed the first phase transition from the paraelectric phase of cubic symmetry to the ferroelectric tetragonal (T) phase at TC ∼ 655 K and the second transition to the ferroelectric monoclinic (M) phase at ∼530 K upon cooling. A sketch of the XPCS experimental setup is shown in Fig. 1A, while further experimental details are presented in Materials and Methods.
Fig. 1.
Sketch of the XPCS experimental setup and some examples of speckles. (A) The coherent X-ray beam is produced at the PETRA III synchrotron storage ring, including the undulator (U), beamline optics, and compound refractive lenses (CRL). The MAXIPIX 2D pixel detector is fixed at the end of the 5-m-long detector arm, supplied by an evacuated flight tube. A series of high-resolution speckle patterns at ∼0.5° away from the exact 0 0 1 Bragg position was recorded as the sample temperature decreased. (B) The intensity distribution over the entire detector at 398 K. (C–E) Zoomed-in images of the selected areas in B showing the evolution of speckles within 2 K temperature range. The horizontal double arrows in B and C indicate the reciprocal space extension of the relevant detector segments.
Fig. 1B shows as an example the speckle pattern collected at 398.0 K. The entire detector covers a reciprocal space segment of ΔQDET ≈ 0.02 Å−1 = 0.012 reciprocal lattice units (r.l.u., which are defined relative to the unit cell with a lattice parameter of ∼4.1 Å), and a single pixel covers ΔQPIX ≈ 4 × 10⁻⁵ Å−1 = 2.6 × 10⁻⁵ r.l.u. Therefore, the speckle fringes whose period extends over the entire detector correspond to real space modulations of while the features whose period fits a single pixel size correspond to real space modulations as large as . Because the speckle pattern was fine-structured at a level down to a few pixels, they represent the modulations of the domain patterns on the micrometer- and nanometer-length scales. To avoid the physically meaningless speckle features corresponding to >3-µm modulations (exceeding the size of the beam), the intensity of each pixel was averaged over 24 neighbors.
Correlation Analysis of Speckle Patterns.
The standard approach in XPCS experiments is to analyze temporal intensity variations in speckle patterns while keeping the temperature constant (34). However, we observed practically static speckle patterns at fixed temperatures, indicating the absence of significant dynamics on the relevant length and time scales. Isothermal speckles are shown in Movies S1–S8. Upon changing the temperature, the patterns displayed strong fluctuations. Such temperature-driven changes of the speckle topology are clearly visible in Fig. 1 C–E and are also presented in Movie S9. To track these fluctuations, we used an alternative operational mode: We collected speckle patterns at ∼11,000 different temperatures in the course of slowly cooling the sample from 650 to 350 K and then analyzed the correlations between them.
To quantify these changes, we evaluated the correlation between pairs of speckle patterns A and B using the following equation:
| [1] |
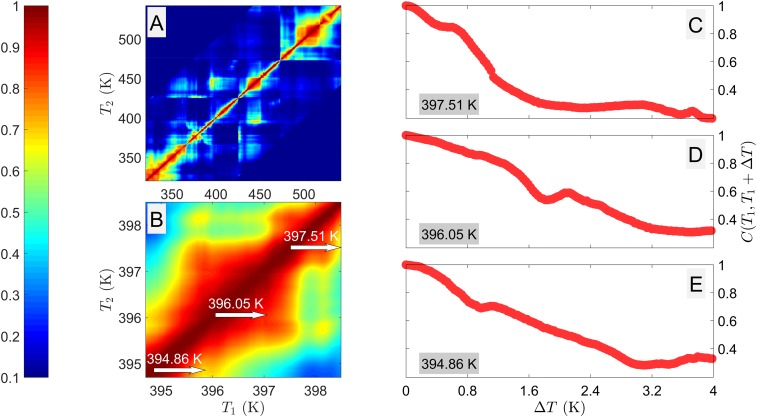
where C(A, B) is the correlation coefficient, Am and Bm are the intensities recorded in the detector pixel m, and are the average intensities of images A and B, respectively, and m runs over all pixels. This correlation coefficient varied between 1 (identical images) and 0 (completely uncorrelated images). Fig. 2A displays the resulting false-color map of the correlation C(T1, T2) between pairs of speckles taken at the temperatures T1 and T2, respectively. It portrays the decay of correlations as the temperature difference ΔT = |T2 − T1| increases. In the area around the main diagonal where the ΔT values are small (<1 K), C is close to unity. The value of the correlation coefficient C is <0.2 for speckle patterns with temperature differences >30 K. The temperature dependence of the decorrelation rate is clearly visible in the oscillations of the correlation map near the main diagonal.
Fig. 2.
False-color map of the correlation matrix and examples of the correlation decay. (A) The correlation coefficients, C(T1, T2), between pairs of speckle patterns collected at temperatures T1 and T2. (B) Zoomed-in section of A for the temperature range between 394.7 and 398.5 K. (C–E) Correlation decays C(ΔT) = C(T1, T1 + ΔT) for three different starting temperatures T1 (along the lines indicated by arrows in B).
Fig. 2B focuses on a narrower interval of starting temperatures, T1, between 394.7 and 398.5 K. It shows that even a small variation of T1 significantly changes the correlation function; three examples are shown in Fig. 2 C–E. While the C(T1, T1 + ΔT) functions for individual starting temperatures are irregular and can hardly be described analytically, their averaged values over a large number N of starting temperatures, T1i, display a smooth variation with ΔT. Fig. 3 exemplifies this behavior in three selected intervals of T1.
Fig. 3.
Thermally induced correlation decays, averaged over different starting temperature intervals (A) T1 = 410–443 K in the monoclinic (M) phase. (B) T1 = 460–482 K in the M phase. (C) T1 = 590–650 K in the tetragonal (T) phase. Symbols are experimental results, and solid lines are the fits to Eq. 2 with the best-fit parameters indicated.
The temperature-driven changes of the speckle topology observed in the ferroelectric single crystal may be caused by the following factors: (i) displacement of the whole sample due to thermal expansion of the sample holder, (ii) homogeneous and inhomogeneous variations of the lattice parameters due to thermal expansion and the spontaneous strain associated with ferroelectric and ferroelastic phase transitions, and (iii) rearrangement of the complex domain structure due to the domain wall motion. In the following discussion, we show that the last mechanism was observed only in the M phase, and it contributed specifically to the observed speckle fluctuations.
For the analysis of the speckle correlations in jammed and glassy soft matter, including colloidal gels, concentrated emulsions, surfactant phases, etc. (see ref. 35 for a review), the expression is widely used to empirically describe the correlation decay as a function of time t, where τ denotes the relaxation time and β is the shape parameter characterizing the degree of deviation from an exponential function. Our attempts to fit the dependences in a wide range of data to a similar equation with t replaced by ΔT (ΔT is proportional to t in our experiments) failed: Satisfactory fitting could only be obtained at sufficiently small ΔT (smaller than ∼1 K). We found, however, that the dependences can be typically described by a modified exponential function:
| [2] |
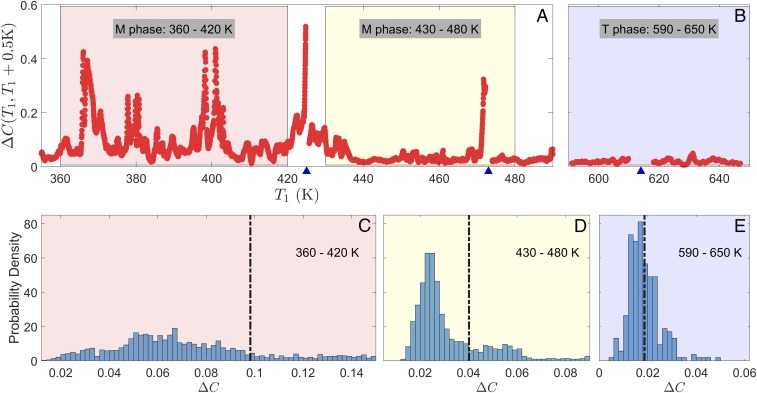
which contains one additional adjustable (here empirical) parameter ΔE (Fig. 3). Although the average correlation decay in the M phase was faster than in the T phase, we could not clearly distinguish the phases based on the values of E, ΔE, or β. Therefore, we performed a statistical analysis of the decorrelation functions, ΔC(T1, T1 + ΔT) = 1 − C(T1, T1 + ΔT), based on the distributions of ΔC with a fixed value of ΔT which are determined in the intervals of starting temperatures T1. Fig. 4 A and B depicts the decorrelations ΔC(T1, T1 + 0.5 K) as a function of T1 (see Movie S10 for different ΔT values), while Fig. 4 C–E plots the histograms describing the probabilities of finding particular values of ΔC in three different intervals of T1 when ΔT = 0.5 K. The vertical dashed lines in Fig. 4 C–E mark the sample mean values, μ(ΔT) =〈ΔC(T1, T1 + ΔT)〉, in these temperature intervals. The animated version of this figure in Movies S11–S13 shows how the histograms change with increasing ΔT.
Fig. 4.
Statistics of the correlation decay. (A and B) Plot of the decorrelation decay, ΔC(T1, T1 + 0.5 K) as a function of starting temperature in the monoclinic (M) and tetragonal (T) phases. (C–E) The histograms of the values in A and B, for three selected intervals of T1: 360–420 K, 430–480 K, and 590–650 K. The dashed lines show the sample mean positions. The multimodal character of the histograms in the monoclinic phase is evident. The tick marks on the bottom of A and B show the temperatures at which the sample was realigned.
In the T phase (Fig. 4E), a single bell-shaped peak (mode) was observed at comparatively small ΔC with the maximum coinciding with μ(ΔT). The unimodal character of the histogram suggested that the decorrelation was likely to be controlled by a single mechanism. In contrast, the histograms in the M phase (Fig. 4 C and D) included several overlapping modes, and μ(ΔT) was located far away from the histogram maxima. Such a multimode structure was maintained at other values of ΔT (Movies S11–S13), and with increasing ΔT each mode propagated to larger ΔC. We assigned each mode to a mesoscopic process in the system corresponding to a particular type of structural rearrangement and developing at a certain rate. In the PbZr0.55Ti0.45O3 crystal, the second-order transition is observed at TC (36), while the transition between the M and T phases is of first order (see Materials and Methods for details). Therefore, the fastest temperature-dependent strain variation and the largest related ΔC were expected to occur just below TC (i.e., in the T phase). In contrast, much larger ΔC values were observed in the M phase of the studied sample (Fig. 4A), suggesting that an additional correlation decay mechanism must be switched on in the M phase. Different histogram modes in this phase might be assigned to the motion of different domain walls. Indeed, the graph in Fig. 4A is reminiscent of the so-called crackling noise, which is produced in ferroic materials by jerky displacements of domain walls and is detected in macroscopic experiments via observation of acoustic emission, electric Barkhausen pulses, or heat fluxes (37, 38). In Statistical Analysis of the Correlation Decay, we perform a detailed statistical analysis to confirm this assignment.
Statistical Analysis of the Correlation Decay.
Different types of structural responses are expected to follow different statistical behavior. In particular, passing of domain walls through the Peierls potential wells makes ΔC a discrete variable. These domain wall jumps can be considered as countable independent events. Countable independent events usually follow the Poisson probability distribution, and we can expect such behavior for the wall dynamics, too. In contrast, both thermal expansion and phase transition-induced lattice distortion are continuous, and thereby the related ΔC should be continuous as well. Continuous dynamics usually results in a normal (Gaussian) distribution of correlations.
The corresponding distribution functions can be mathematically described as follows. Let k be the number of jumps experienced by a domain wall or a set of walls during the temperature change ΔT. Suppose that each jump decorrelates the speckle pattern by the same amount, s. The corresponding correlation decay is given by
| [3] |
The integer values of k for different starting temperatures, T1, are expected to be randomly distributed according to the Poisson probability distribution function:
| [4] |
where P(k) is the probability that a given temperature change ΔT will cause k jumps, and λ is the expected mean number of jumps over all T1 temperatures in the studied interval. The value of λ evidently increases with increasing ΔT. Inserting k from Eq. 3 into Eq. 4 leads to the probability density function of ΔC:
| [5] |
On the other hand, the Gaussian distribution expected for decorrelations that are not related to domain wall jumps can be written as
| [6] |
where μN is the mean (expected value) and is the variance of the Gaussian distribution.
The unique property of the Poisson process is that the mean value of the distribution λ is equal to the variance . Therefore, in terms of the experimentally observed correlation decay, distribution [5] should lead to the following relation between the sample mean μ and the sample SD, σ:
| [7] |
where n = 2, and
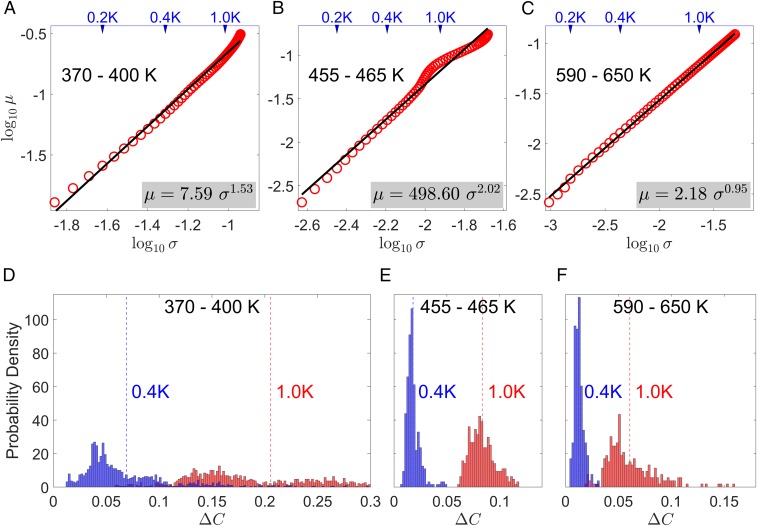
To verify if Eq. 7 applies to our data, we calculated μ(ΔT) and σ(ΔT) in different intervals of T1 and plotted the μ vs. σ dependences in double-logarithmic scale in Fig. 5 A–C. In Fig. 5 D–F, the histograms at selected ΔT are shown for a visual inspection of the analyzed data. Although in the M phase the histograms are typically multimodal, comparatively small T1 intervals can be selected within which they are unimodal (Fig. 5 B and E). In the latter case, the μ(σ) dependence can be well fitted to Eq. 7 with n = 2, suggesting that the corresponding mode represents a single Poisson process. While the T phase histograms are also unimodal, the mode exponent n is close to unity, suggesting that the mode is not a Poisson process. The intermediate value of n = 1.53 in the other M-phase interval in Fig. 5A is justified by the multimodal structure of the histograms, where the existence of several Poisson modes propagating at different rates automatically leads to the enhancement of σ and the corresponding decrease of n.
Fig. 5.
Relationship between the sample mean and the SD for the correlation decay in the selected temperature intervals. (A) T1 = 370–400 K in the M phase. (B) T1 = 455–465 K in the M phase. (C) T1 = 590–650 K in the T phase. The lines are the fits to Eq. 7 with best-fit parameters indicated. Arrows at the top indicate the corresponding values of ΔT. (D–F) Histograms of ΔC(T1, T1 + 0.4 K) and ΔC(T1, T1 + 1 K) in the same three temperature intervals as in A–C. Dashed lines show the positions of the sample mean μ. The T phase histogram is unimodal with the mode exponent n = 1. The M-phase 455–465 K histogram is also unimodal, with n close to 2, while the 370–400 K histogram is multimodal with the mode exponent having an intermediate value.
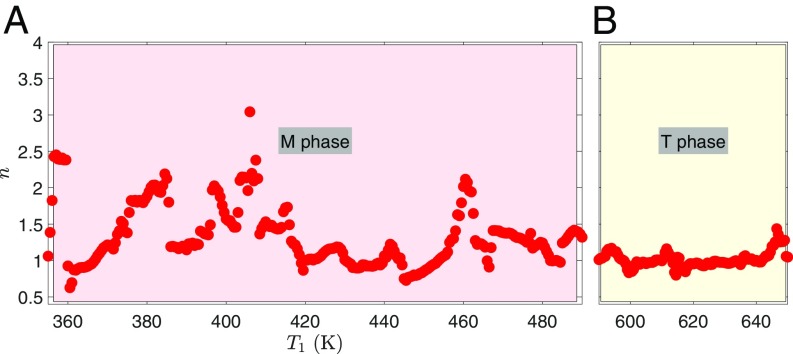
To illustrate this behavior, Fig. 6 shows the exponent n obtained by fitting the μ(σ) dependences to Eq. 7 in other 10 K wide intervals of the starting temperatures T1. It is clear that in the T phase (Fig. 6B), the values of n remain close to unity and in the M (Fig. 6A) phase n fluctuates mainly between 1 and 2. The explanation for this behavior is the following: In relatively rare temperature intervals where n ≈ 2, a single Poisson mode exists (like in Fig. 5E), while in other intervals, several Poisson modes overlap (like in Fig. 5D). To confirm this explanation, we showed that the complex multimode correlation decay spectra can be deconvoluted into constituent Poisson processes by using appropriate fitting procedures and that the parameters of each process can be determined separately.
Fig. 6.
Temperature dependence of the mode exponent n found in different (T1, T1 + 10 K) temperature intervals of the M (monoclinic, A) and T (tetragonal, B) phases.
Characterizing of Histogram Modes.
It is known that for large enough values of λ, the Poisson distribution function can be approximated by a Gaussian distribution function. Thus, to describe the Poisson process we can use the Gaussian expression [6] with an expectation value μN = λs and a constraining relationship between the expectation value and the variance, according to Eq. 7:
| [8] |
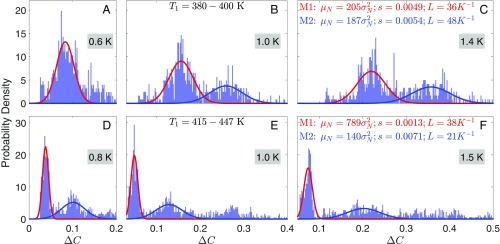
with n = 2. Fig. 7 A–C illustrates the example of this histogram decomposition performed for the interval of starting temperatures of 380–400 K in the M phase, which comprises two decorrelation modes. Each histogram corresponding to a particular value ΔT was fitted to the sum of two Gaussian functions [6]. To ensure that these functions approximate the Poisson distribution, the fittings for all ΔT were performed simultaneously, while the constraint [8] was imposed. We treated s for each mode and the exponent n as adjustable parameters (see Materials and Methods for the fitting procedure details). Fig. 7 D–F shows the result for a different M-phase interval: These spectra contain three noticeable decorrelation modes, and two of them (the dominating ones) are fitted. For both intervals, we found the best-fit values of n very close to 2 (2.09 and 2.04, respectively), which confirms the Poisson character of all of the modes considered. To determine the parameter s for each mode, we then repeated the fitting with a fixed n = 2 and found the best-fit values listed in Fig. 7 C and F.
Fig. 7.
Deconvolution of the M-phase decorrelation histograms into two Poisson modes. The histograms in two different temperature intervals: T1 = 380–400 K (A–C) and T1 = 415–447 K (D–F). The histograms comprise two dominating modes which move to the right as ΔT increases. Red and blue lines are the Poisson functions, describing the modes. The best-fit values of parameter s and the number of domain wall motion events per ΔT = 1 K, calculated according to Eq. 9, are displayed for each mode.
While each mode stands for a single Poisson process, the speckle decorrelation caused by a single wall jump s is different in two processes analyzed in a particular temperature interval, suggesting that they are related to the different types of domain wall motion or similar walls moving in different directions. Furthermore, the number of modes and their parameters differ in different temperature intervals (compare Fig. 7C and Fig. 7F). This is probably because the wall dynamics changes with temperature or because different walls enter the X-ray illuminated area.
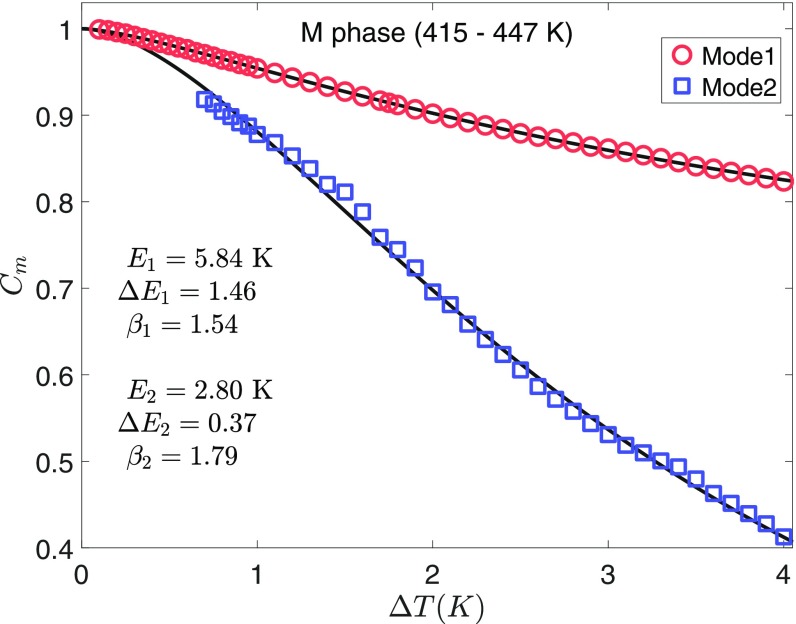
Using the mean values σNm(m = 1,2,...) obtained for each mode in the fitting procedure, one can find the average correlation coefficient for the mode as Cm(ΔT) = 1 − μNm(ΔT). Fig. 8 shows these coefficients as a function of ΔT. Similar to the behavior of the total correlation coefficients (Fig. 3), each of these dependences can be well fitted to Eq. 2 with individual parameters Em, ΔEm, and βm. As discussed above, each mode originates from the temperature-driven motion of a particular domain wall or a set of domain walls. The rate of Cm(ΔT) change is determined by the rate of the Poisson process, Lm = λm/ΔT (average number of domain wall jumps per decay interval of 1 K) and the value of sm (average decorrelation per jump). Therefore, we can estimate the rate of each wall motion in the volume of the sample irradiated by the X-ray beam as
| [9] |
These rates are explicitly displayed in Fig. 7. For example, for the two modes in the interval of T1 = 415–447 K, we find s1 = 0.0013, L1 ≈ 38 K−1; s2 = 0.0071, L2 ≈ 21 K−1 (i.e., the walls of the second type are subject to a smaller number of jumps, but each jump produces a larger decorrelation in the speckle pattern).
Fig. 8.
The correlation coefficients of the modes in the temperature range of T1 = 415–447 K. Symbols are the results extracted from the fitting of experimental data as explained in the text; solid lines are the fits to Eq. 2 with the best-fit parameters indicated. M, monoclinic.
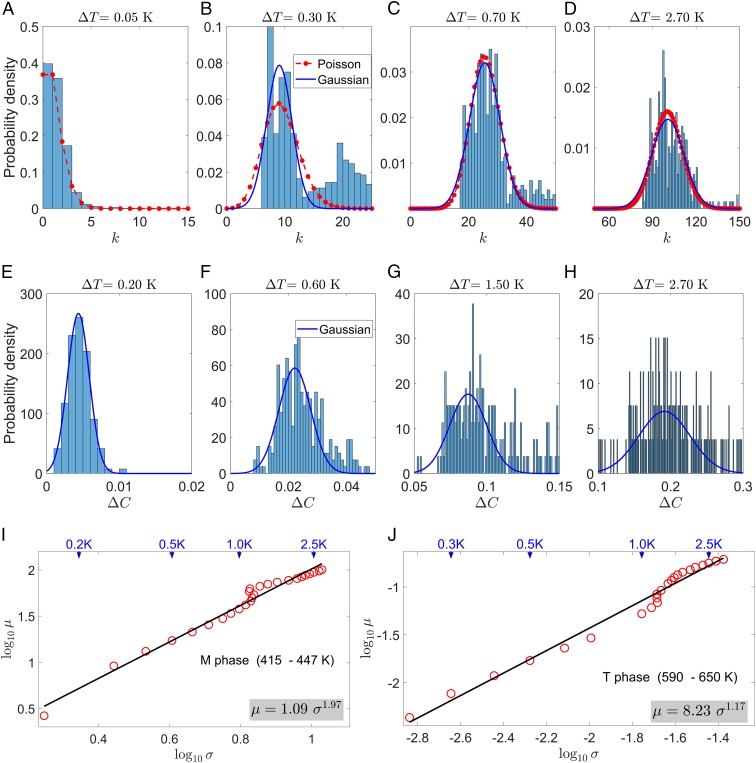
Let us now analyze the data at small ΔT values where the mean number of wall jumps λ is expected to be small. Here, the Gaussian distribution does not fit the correlation histograms, and the Poisson distribution [5] is needed. Having determined the parameters sm, we are now able to construct for each mode the histograms P(k) describing the probability distribution for k = ΔC/sm wall jumps and fit them directly to a Poisson distribution [4]. Fig. 9 A–D shows such histograms and fittings for the first mode in the T = 415–447 K temperature interval of the M phase. At comparatively large ΔT values, the Gaussian and Poisson fitting curves practically coincide, as expected. In contrast, at small ΔT values where λ is close to unity (Fig. 9A), the Gaussian is totally unsuitable, as the probability monotonously decreases with increasing k. The calculated histograms are compatible with the Poisson distribution. Fig. 9I shows the relation between the best-fit values of μN and σN obtained from the Gaussian fitting. At ΔT > 0.4 K where such fitting is adequate, the relation points to the Poisson distribution.
Fig. 9.
Fitting of the probability histograms in the monoclinic (M) and tetragonal (T) phases to the Poisson and Gaussian functions. (A–D) Histograms at selected values of ΔT for the first (slow) mode in the temperature interval of T1 = 415–447 K in the M phase. The histogram bin size is chosen to be equal to s1 so that the histograms represent the probability of k = ΔC/s1 domain wall jumps. Solid blue and dashed red lines are the fits to the Gaussian and Poisson functions, respectively. (E–H) Decorrelation histograms at selected ΔT values for the temperature interval of T1 = 590–650 K in the T phase. Solid blue lines are the fits to the Gaussian function. (I and J) Relationships between the best-fit mean and SD of fitted Gaussian function in the M and T phases. The lines are the fits to Eq. 8 with the best-fit parameters presented. Arrows at the top indicate the values of ΔT for the corresponding data points.
The correlation histograms for the T phase are shown in Fig. 9 E–H, for comparison. At all ΔT values, the bell-shaped distribution is observed. Although slightly asymmetric (positively skewed), it can, nevertheless, be satisfactorily fitted to the Gaussian. As Fig. 7J shows, the calculated μN vs. σN relation is practically linear, in agreement with the μ vs. σ dependence shown in Fig. 5C, but in sharp contrast to the Poisson characteristics. This behavior suggests that in the T phase, the domain walls do not shift with temperature.
Discussion
The differences between the domain wall dynamics in the M and T phases can be explained as follows. The position of domain walls in a ferroelectric crystal is mainly determined by electrical and mechanical compatibility conditions (39). According to these conditions, the walls in the tetragonal phase should be parallel at any temperature to one of the 12 {011} Miller planes (90° walls) or the 〈001〉 crystallographic directions (180° walls). In contrast, some walls in the monoclinic phase [the so-called S walls (39)] lack a symmetry-related correlation to any particular crystallographic plane or direction. The orientation of an S-wall is determined by the relation between the components of the spontaneous strain tensor and thereby necessarily depends on temperature near the ferroelastic and ferroelectric phase transitions. The S walls in the monoclinic PZT crystals have been observed by means of polarized light microscopy in ref. 33 and also in the sample studied in the present work. Besides, the 180° walls in the monoclinic phase should be parallel to the spontaneous polarization vector, which can rotate in the M phase of PZT within the {011} planes when the temperature changes. Consequently, the temperature-induced motion of domain walls with respect to the crystal lattice should be observed in the M phase. In the T phase, however, the domain structure may remain temperature-independent. The crystallographic axes corresponding to different twin variants are slightly tilted with respect to one another. A temperature-induced variation of the tetragonality changes the tilt angle and induces internal stress. This stress can generally induce a wall displacement with respect to the crystal lattice, but not necessarily. Our results correspond to the case where the internal stresses are accommodated without domain wall motion. This consideration validates our results and provides additional indirect confirmation of the monoclinic and tetragonal symmetries for the MPB phases in PZT.
The observed Poisson statistics of the domain wall motion implies that the wall jumps are similar-sized and independent events [the corresponding dynamics are sometimes called popping noise (38)]. This is compatible with the thermally activated jumping over the potential wells of the periodic Peierls potential. Theoretically, the wall jumps in such a process are considered as proceeding via nucleation and growth of atomic layers with a different alignment of order parameter (17). Experimentally, the corresponding jumps have been observed and counted in a ferromagnetic material with the technique of ballistic Hall micromagnetometry (15). However, the limited resolution of known experimental techniques can hardly allow similar observations in ferroelectrics and ferroelastics. Another mechanism of domain wall propagation is known to be active in real materials where the ideal periodicity is always disturbed by lattice defects. Interactions of walls with lattice defects (pinning centers) or neighboring walls lead to the development of large random-sized jerks (avalanches), which are known as crackling noise (36, 37). In contrast to the statistically independent wall jumps over the Peierls potential barriers, this process is developed due to multiple interactions between the walls (40). Collective crackling noise dynamics typically results in a power law-type probability distribution function of the observed response. The tails in the histograms of the M phase at ΔC exceeding the peak values greatly (Figs. 4 C and D and 7) can be well related to the crackling-noise mechanism. Unfortunately, our dataset is not large enough to confirm unambiguously that they really obey the power law expected for crackling noise. Additional measurements are needed to obtain a sufficient statistics.
In conclusion, we have developed an experimental approach which allows us to separate the contributions of domain wall motion and crystal lattice distortion to the properties of a ferroelectric material by means of deconvolution of the XPCS spectra. The wall motion in Peierls potential appears in the form of a temperature-driven decorrelation statistics of Poisson character. We are able to count the number of domain wall jumps between the wells of Peierls crystalline potential induced by the given change of external conditions. XPCS is shown to be a more powerful tool compared with the existing techniques for the characterization of domain walls propagation and dynamics not only because of its much higher spatial resolution, but also because the X-ray diffraction information can be simultaneously obtained to characterize the lattice strain.
Materials and Methods
Crystal Growth, Preparation, and Preliminary Characterization.
The PbZr0.55Ti0.45O3 crystal was grown by using a top-seeded solution method as described in ref. 33. The crystal platelet with a thickness of 0.2 mm was cut with large faces (1.4 × 1.4 mm) perpendicular to the pseudocubic [001] direction. The crystal was mirror-polished and heated up to 820 K to eliminate internal stress. Optical examination of domain structures and phase transitions was performed by using an Olympus BX60 polarizing microscope combined with a Linkam THMS600 optical heating and cooling stage and revealed the behavior similar to that we previously found in PZT crystal with close composition (33). At comparatively low temperatures, the ferroelectric phase of monoclinic (Cm or Cc) symmetry was observed, with the structure of fine lamellar domains having a thickness of 1–3 μm. At higher temperatures, another ferroelectric phase of tetragonal 4-mm symmetry was found with the domains of submicrometer size. The transition from the M to the T phase should be classified as a first-order one, since a temperature hysteresis of ∼35 K was revealed. Significant spatial inhomogeneity was also observed, namely, the transition temperature changed from ∼490 K (upon cooling) at one edge of the crystal plate to ∼570 K at the opposite edge. Such inhomogeneity was shown to be related to the gradient of Zr/Ti concentration in the bulk of PZT crystals (33) and is typical of perovskite solid solution crystals (41). At the center of the crystal plate where the XPCS experiments were performed, the transition temperature was ∼530 K. No temperature hysteresis of the Curie point TC ∼ 655 K was observed, in agreement with the reported second-order nature of the tetragonal-cubic phase transition (36).
Details of the XPCS Experiment.
The XPCS experiment was performed at the coherent X-ray scattering P10 beamline of the PETRA III storage ring with a photon energy of 7 keV. The sample was mounted into a furnace and aligned at a Bragg angle of 12.05° corresponding to the position of the 0 0 1 Bragg reflection. The beam path between the sample and the detector was covered with an evacuated flight tube. The beam focused on the crystal surface had a Gaussian intensity shape with FWHM of 3 × 5 μm2. Speckle patterns were acquired by using a Maxipix area detector (55 × 55 µm2 pixel size, 516 × 516 pixels per active area) positioned at a two-theta angle of 25.1° at a distance of 5 m downstream of the sample. The speckle patterns were recorded at the footsteps of the Bragg reflection (∼0.5° away from the exact Bragg position) where the pattern covered the whole area of the detector, while the oversaturation of the detector by the strong Bragg peak component was avoided. The crystal was heated up to ∼650 K and then slowly cooled down to 320 K at the rate of ∼1 K/min. The sample was realigned each time the speckle moved out of the detector.
Fitting Histograms.
The direct least-squares fitting of decorrelation histograms at fixed ΔT to Poisson distribution [5] is technically cumbersome because it requires the calculation of the factorials of the ΔC/s values. Therefore, the histograms should be plotted for which these values are integers. However, the value of s (i.e., the correlation decay produced by a single wall jump) is not known a priori. Furthermore, s may differ for different decorrelation modes. To determine the values of s, we developed MATLAB-based scripts for the least-squares fit of the histograms. First, we inspected the histograms to assign the temperature interval, [ΔTmin, ΔTmax], where the modes were clearly separated. For both ΔTmin and ΔTmax, we selected the ranges of correlation decay ΔC for fitting, while the ranges for other ΔT values were calculated proportionally. In these ranges, the histograms for all selected ΔT were fitted simultaneously to the sum of K functions (K is the number of considered modes) of the form:
where the maximum intensity I0, the mean μ(ΔT) and the SD σ(ΔT) were fitted against the data of individual histograms, while the global parameters s and n were refined against the entire temperature-dependent dataset.
Supplementary Material
Acknowledgments
We thank E. K. H. Salje for illuminating discussions. A.A.B., Y.X., and Z.-G.Y. were supported by U.S. Office of Naval Research Grants N00014-12-1-1045 and N00014-16-1-3106; and Natural Sciences and Engineering Research Council of Canada Grant 203773. S.G., U.P., and C.G. were supported by German Federal Ministry of Education and Research (Bundesministerium für Bildung und Forschung) Grants 05K13PSA and 05K13PS5.
Footnotes
The authors declare no conflict of interest.
This article is a PNAS Direct Submission.
This article contains supporting information online at www.pnas.org/lookup/suppl/doi:10.1073/pnas.1720991115/-/DCSupplemental.
References
- 1.Scott JF. Applications of modern ferroelectrics. Science. 2007;315:954–959. doi: 10.1126/science.1129564. [DOI] [PubMed] [Google Scholar]
- 2.Zhang QM, Wang H, Kim N, Cross LE. Direct evaluation of domain-wall and intrinsic contributions to the dielectric and piezoelectric response and their temperature dependence on lead zirconate-titanate ceramics. J Appl Phys. 1994;75:454–459. [Google Scholar]
- 3.Bassiri-Gharb N, et al. Domain wall contributions to the properties of piezoelectric thin films. J Electroceram. 2007;19:49–67. [Google Scholar]
- 4.Farokhipoor S, Noheda B. Conduction through 71° domain walls in BiFeO3 thin films. Phys Rev Lett. 2011;107:127601. doi: 10.1103/PhysRevLett.107.127601. [DOI] [PubMed] [Google Scholar]
- 5.Seidel J. Domain walls as nanoscale functional elements. J Phys Chem Lett. 2012;3:2905–2909. [Google Scholar]
- 6.Aird A, Salje EKH. Sheet superconductivity in twin walls: Experimental evidence of WO3-x. J Phys Condens Matter. 1998;10:L377–L380. [Google Scholar]
- 7.Meier D. Functional domain walls in multiferroics. J Phys Condens Matter. 2015;27:463003. doi: 10.1088/0953-8984/27/46/463003. [DOI] [PubMed] [Google Scholar]
- 8.Catalan G, Seidel J, Ramesh R, Scott JF. Domain wall nanoelectronics. Rev Mod Phys. 2012;84:119–156. [Google Scholar]
- 9.Gorfman S, Schmidt O, Tsirelson VG, Ziolkowski M, Pietsch U. Crystallography under external electric field. Z Anorg Allg Chem. 2013;639:1953–1962. [Google Scholar]
- 10.Asada T, Koyama Y. Ferroelectric domain structures around the morphotropic phase boundary of the piezoelectric material PbZr1−xTixO3. Phys Rev B Condens Matter Mater Phys. 2007;75:214111. [Google Scholar]
- 11.Schierholz R, Fuess H. Ferroelectric domains in PZT ceramics at the morphotropic phase boundary. Can the splitting of reflections in SAED patterns be used for the distinction of different pseudo-cubic phases? J Appl Crystallogr. 2012;45:766–777. [Google Scholar]
- 12.Shur VY, et al. Formation of self-assembled nanodomain structures in single crystals of uniaxial ferroelectrics lithium niobate, lithium tantalate and strontium–barium niobate. J Adv Dielectr. 2014;4:1450006. [Google Scholar]
- 13.Wu H, et al. Recent progress on the structural characterizations of domain structures in ferroic and multiferroic perovskite oxides: A review. J Eur Ceram Soc. 2014;35:411–441. [Google Scholar]
- 14.Peierls R. The size of a dislocation. Proc Phys Soc. 1940;52:34–37. [Google Scholar]
- 15.Novoselov KS, Geim AK, Dubonos SV, Hill EW, Grigorieva IV. Subatomic movements of a domain wall in the Peierls potential. Nature. 2003;426:812–816. doi: 10.1038/nature02180. [DOI] [PubMed] [Google Scholar]
- 16.Boser O. Statistical theory of hysteresis in ferroelectric materials. J Appl Phys. 1987;62:1344–1348. [Google Scholar]
- 17.Tagantsev AK, Cross LE, Fousek J. Domains in Ferroic Crystals and Thin Films. Springer; New York: 2010. [Google Scholar]
- 18.Taylor DV, Damjanovic D. Evidence of domain wall contribution to the dielectric permittivity in PZT thin films at sub-switching fields. J Appl Phys. 1997;82:1973–1975. [Google Scholar]
- 19.Zhao Z, Ding X, Sun J, Salje EKH. Thermal and athermal crackling noise in ferroelastic nanostructures. J Phys Condens Matter. 2014;26:142201. doi: 10.1088/0953-8984/26/14/142201. [DOI] [PubMed] [Google Scholar]
- 20.Park S-E, Shrout TR. Ultrahigh strain and piezoelectric behavior in relaxor based ferroelectric single crystals. J Appl Phys. 1997;82:1804–1811. [Google Scholar]
- 21.Viehland DD, Salje EKH. Domain boundary-dominated systems: Adaptive structures and functional twin boundaries. Adv Phys. 2014;63:267–326. [Google Scholar]
- 22.Fu H, Cohen RE. Polarization rotation mechanism for ultrahigh electromechanical response in single-crystal piezoelectrics. Nature. 2000;403:281–283. doi: 10.1038/35002022. [DOI] [PubMed] [Google Scholar]
- 23.Fiebig M, Lottermoser T, Meier D, Trassin M. The evolution of multiferroics. Nat Rev Mater. 2016;1:16046. [Google Scholar]
- 24.Trivedi H, et al. Local manifestations of a static magnetoelectric effect in nanostructured BaTiO3-BaFe12O9 composite multiferroics. Nanoscale. 2015;7:4489–4496. doi: 10.1039/c4nr05657d. [DOI] [PubMed] [Google Scholar]
- 25.Sutton M, et al. Observation of speckle by diffraction with coherent X-rays. Nature. 1991;352:608–610. [Google Scholar]
- 26.Mochrie SGJ, et al. Dynamics of block copolymer micelles revealed by X-ray intensity fluctuation spectroscopy. Phys Rev Lett. 1997;78:1275–1278. [Google Scholar]
- 27.Dierker SB, Pindak R, Fleming RM, Robinson IK, Berman L. X-ray photon correlation spectroscopy study of Brownian motion of gold colloids in glycerol. Phys Rev Lett. 1995;75:449–452. doi: 10.1103/PhysRevLett.75.449. [DOI] [PubMed] [Google Scholar]
- 28.Alvine KJ, et al. Capillary wave dynamics of thin polymer films over submerged nanostructures. Phys Rev Lett. 2012;109:207801. doi: 10.1103/PhysRevLett.109.207801. [DOI] [PubMed] [Google Scholar]
- 29.Leitner M, Sepiol B, Stadler L-M, Pfau B, Vogl G. Atomic diffusion studied with coherent X-rays. Nat Mater. 2009;8:717–720. doi: 10.1038/nmat2506. [DOI] [PubMed] [Google Scholar]
- 30.Shpyrko OG, et al. Direct measurement of antiferromagnetic domain fluctuations. Nature. 2007;447:68–71. doi: 10.1038/nature05776. [DOI] [PubMed] [Google Scholar]
- 31.Ohwada K, Mizuki J, Matsushita M, Namikawa K. Heterophase fluctuations near Tc in the relaxor ferroelectrics (1−x)Pb(Zn1/3Nb2/3)O3−xPbTiO3 (x = 0.09) studied by X-ray diffuse scattering and coherent X-ray scattering. Phys Rev B Condens Matter Mater Phys. 2014;90:104109. [Google Scholar]
- 32.Jaffe B, Roth RS, Marzullo S. Piezoelectric properties of lead zirconate-lead titanate solid-solution ceramics. J Appl Phys. 1954;25:809–810. [Google Scholar]
- 33.Bokov AA, Long X, Ye Z-G. Optically isotropic and monoclinic ferroelectric phases in PbZr/TiO3(PZT) single crystals near morphotropic phase boundary. Phys Rev B Condens Matter Mater Phys. 2010;81:172103. [Google Scholar]
- 34.Shpyrko OG. X-ray photon correlation spectroscopy. J Synchrotron Radiat. 2014;21:1057–1064. doi: 10.1107/S1600577514018232. [DOI] [PubMed] [Google Scholar]
- 35.Cipelletti L, Ramos L. Slow dynamics in glassy soft matter. J Phys Condens Matter. 2005;17:R253–R285. [Google Scholar]
- 36.Hyun Kim T, et al. Phase transition behaviors of PbZr1−xTixO 3 single crystals as revealed by elastic anomalies and central peaks. Appl Phys Lett. 2012;100:82903. [Google Scholar]
- 37.Salje EKH, Dahmen KA. Crackling noise in disordered materials. Annu Rev Condens Matter Phys. 2014;5:233–254. [Google Scholar]
- 38.Sethna JP, Dahmen KA, Myers CR. Crackling noise. Nature. 2001;410:242–250. doi: 10.1038/35065675. [DOI] [PubMed] [Google Scholar]
- 39.Fousek J, Janovec V. The orientation of domain walls in twinned ferroelectric crystals. J Appl Phys. 1969;40:135–142. [Google Scholar]
- 40.Bintachitt P, et al. Collective dynamics underpins Rayleigh behavior in disordered polycrystalline ferroelectrics. Proc Natl Acad Sci USA. 2010;107:7219–7224. doi: 10.1073/pnas.0913172107. [DOI] [PMC free article] [PubMed] [Google Scholar]
- 41.Ye Z-G. High-performance piezoelectric single crystals of complex perovskite solid solutions. MRS Bull. 2009;34:277–283. [Google Scholar]
Associated Data
This section collects any data citations, data availability statements, or supplementary materials included in this article.


