Significance
The right and left cerebral hemispheres (together forming the endbrain) support cognition and affect, and, structurally, each hemisphere consists of a cortical sheet and set of deep nuclei (often called the basal ganglia). Experimental evidence in the literature identified more than 10,000 axonal macroconnections between the 244 gray matter regions of the endbrain, and the global organizing principles of the network formed by these connections were subjected to multiresolution consensus clustering analysis. The result was a hierarchy of subsystems that has only four components at the top level and 60 components at the bottom level. Furthermore, a region’s status as a connectivity hub in a network is not absolute; it depends on the size and coverage of its anatomical neighborhood.
Keywords: cognition, connectomics, mammal, neural connections, neuroinformatics
Abstract
The endbrain (telencephalon) is at the rostral end of the central nervous system and is primarily responsible for supporting cognition and affect. Structurally, it consists of right and left cerebral hemispheres, each parceled into multiple cortical and nuclear gray matter regions. The global network organization of axonal macroconnections between the 244 regions forming the endbrain was analyzed with a multiresolution consensus clustering (MRCC) method that provides a hierarchical description of community clustering (modules or subsystems) within the network. Experimental evidence was collated from the neuroanatomical literature for the existence of 10,002 of a possible 59,292 connections within the network, and they cluster into four top-level subsystems and 60 bottom-level subsystems arranged in a 50-level hierarchy. Two top-level subsystems are bihemispheric: One deals with auditory and visual information, and the other corresponds broadly to the default mode network. The other two top-level subsystems are bilaterally symmetrical, and each deals broadly with somatic and visceral information. Because the entire endbrain connection matrix was assembled from multiple subconnectomes, it was easy to show that the status of a region as a connectivity hub is not absolute but, instead, depends on the size and coverage of its anatomical neighborhood. It was also shown numerically that creating an ultradense connection matrix by converting all “absent” connections to a “very weak” connection weight has virtually no effect on the clustering hierarchy. The next logical step in this project is to complete the forebrain connectome by adding the thalamus and hypothalamus (together, the interbrain) to the endbrain analysis.
The right and left cerebral hemispheres are often considered the most important parts of the human nervous system because they are primarily responsible for generating cognition and affect. The cerebral hemispheres were defined and named over 350 y ago by Willis (1). In humans and other large mammals, he differentiated structurally between an outer cortical division and an inner noncortical division (which he called corpus striatum), and he speculated that, functionally, the hemispheres control voluntary behavior. In 1828, Baer (2) discovered that the early embryological precursor of the cerebral hemispheres is recognizable in all vertebrates as the most rostral of five brain vesicles, now called the telencephalic (Greek) or endbrain (English) vesicle, which has right and left halves separated by a thin roof plate. Since this foundational work, extensive research has clarified structure/function regionalization of the cerebral hemispheres and has provided the broad generalization that each half may be divided into a superficial or outer cerebral cortex division and a deep or inner cerebral nuclei division, each of which is subdivided multiple times in a clearly defined way based on current evidence (3, 4). The cerebral nuclei division is equivalent to Willis’s corpus striatum, and this division forms the largest component of what are commonly referred to as the basal ganglia (4).
To start a systematic analysis of the nervous system’s basic wiring diagram in the rat (5), the mammalian species for which the most data are available, subconnectomes for known association (ipsilateral) and commissural (contralateral or crossed) connections between all regions of the two cerebral hemisphere divisions, cerebral nuclei (6) and cerebral cortex (7), have been collated and subjected to network analysis. Here, the analysis is extended to combine these initial published subconnectomes with new subconnectomes for connections between the 244 gray matter regions of the two divisions in both hemispheres, producing a complete endbrain subconnectome.
As in previous work, the focus of the analysis is on identifying brain regions that stand out due to the density of their connections and their central embedding in the overall subconnectome, as well as characterizing network architecture by detecting groupings of regions (also called communities or modules) that form dense clusters of connections. Since this project began, network analysis tools, especially for community detection, have continued to evolve, and we apply here a multiresolution consensus clustering strategy (MRCC) (8) for detecting modules that are hierarchically arranged across multiple spatial scales. In the neuroscience domain, a more familiar term for community or module organization is subsystem organization.
The network analysis is based on data from experimental pathway tracing methods that rely on axonal transport to identify monosynaptic axonal connections between gray matter regions, referred to as macroconnections (9, 10). These data form a weighted and directed macroconnectome that includes all 45 gray matter regions of the cerebral nuclei and all 77 gray matter regions of the cerebral cortex recognized for each hemisphere in a standard rat brain atlas (11). The goal of this research is to provide organizing principles of intrinsic cerebral hemisphere circuitry as a top-level conceptual model for more detailed analyses at the nested meso-, micro-, and nanolevels of granularity (12). The value of conceptual models in systems neuroscience is becoming increasingly obvious as vast amounts of data accumulate rapidly at the finer levels of circuit granularity.
Results
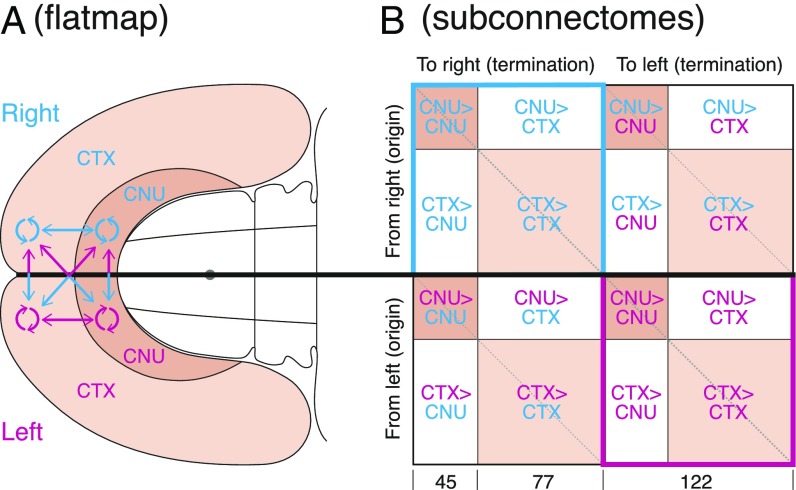
The analysis is based on macroconnections within and between all component regions of the right and left cerebral nuclei, within and between all component regions of the right and left cerebral cortex, and between all component regions of the right and left cerebral nuclei and cerebral cortex (Fig. 1A). There are 10 consensus basic parts of the vertebrate central nervous system (13), and the cerebral nuclei and cerebral cortex are the two most rostral parts. For convenience of data collection and analysis, the cerebral hemispheres or endbrain connectome (connection matrix) is divided into 16 subconnectomes (Fig. 1B). Eight subconnectomes are published: Four concern intrinsic cerebral nuclei connections (6), and four concern intrinsic cerebral cortex connections (7). Data for extrinsic connections, between the cerebral nuclei and cerebral cortex (the other eight subconnectomes), were collated for the current analysis.
Fig. 1.
Overview of the analysis strategy. (A) Right and left cerebral nuclei (CNU) and cerebral cortex (CTX) on a flat map of the rat forebrain (11), also showing the arrangement of connections within (circular arrows) and between (straight arrows) the components forming the cerebral hemispheres. (B) Schematic view of the bilateral cerebral hemisphere connectome (connection matrix) with its 16 subconnectomes. The cerebral nuclei have 45 regions (nodes), and the cerebral cortex has 77 regions (nodes), giving a combined total of 122 regions for each cerebral hemisphere [244 for the entire endbrain (EB2)]. Colored subconnectomes were published previously (see main text and refs. 6 and 7). The main diagonal (upper left to lower right) represents connections of a region to itself and has no value in a macroconnectome. The two shorter diagonals with the same orientation represent homotypic crossed connections: connections from a region on one side of the brain to the corresponding region on the other side.
Systematic review of the neuroanatomical literature yielded no reports of statistically significant male/female, right/left, or strain differences for any connection used in the analysis, which thus applies to the adult rat generally; possible quantitative differences in these variables should be addressed in future studies. Each cerebral hemisphere has 14,762 (1222–122; Fig. 1B) possible ipsilateral connections between its intrinsic regions [29,524 for the right and left hemispheres; EB1 (ipsilateral endbrain) for all connections within a cerebral hemisphere], and each cerebral hemisphere has 14,884 (1222) possible contralateral connections with cerebral hemisphere regions on the other side (29,768 for both sides). Thus, the number of possible ipsilateral and contralateral connections between gray matter regions in both cerebral hemispheres is 59,292 [EB2 (bilateral endbrain) for all connections within and between the two hemispheres].
A dataset of 43,341 connection reports was collated by one of the authors (L.W.S.) from 253 peer-reviewed research publications in the neuroanatomical literature since 1974 for 29,646 possible intrahemispheric ipsilateral and contralateral connections arising in one hemisphere (given no reports of statistically significant right/left differences, these numbers are doubled to give 86,682 connection reports for 59,292 possible connections arising from both hemispheres). The connection reports were from 41 journals, books, and theses (54% from the Journal of Comparative Neurology) involving about 130 laboratories; 28% of the reports (12,301 for ipsilateral and contralateral connections arising in one hemisphere) were from the L.W.S. laboratory.
Standard rat brain parcellation and nomenclature (11), based primarily on architecture, topography, and connections and secondarily on function, was used to describe all connection reports, which, in turn, were based on the results of experiments using monosynaptic anterograde and retrograde axonal pathway tracing methods (19 different pathway tracers in total, identified for each connection report in SI Appendix and Dataset S1)
Basic Connection Numbers.
The collation identified 4,118 intrinsic ipsilateral connections as present (connections that exist) and 10,045 as absent (connections that do not exist) between the 122 gray matter regions comprising the entire cerebral hemisphere on one side, for an EB1 connection density of 29.1% (considering connections for which data exist and with absent including “unclear” values in SI Appendix, Fig. S1). In contrast, 883 contralateral connections from one cerebral hemisphere to the other were identified as present and 12,876 as absent, a contralateral connection density of 6.4% (considering connections for which data exist). For all possible ipsilateral and contralateral connections arising in one cerebral hemisphere, 5,001 were present and 22,921 were absent, for an overall connection density of 17.9%. The mean validity rating for experimental pathway tracing methods used to identify connections for the entire network analysis was 6.5 for present connections (on a scale of 1 = lowest to 7 = highest) (7) and 6.2 for absent connections (an explanation of validity rating is provided in SI Appendix).
No adequate published data were found for 599 (4.1%) of all possible (14,762) EB1 macroconnections, reflecting a matrix coverage (fill ratio) of 95.9% (SI Appendix, Fig. S1). Matrix coverage for commissural connections was 92.4% (no published data for 1,125 of 14,884 possible connections). Data coverage for all possible ipsilateral and contralateral connections arising in one hemisphere was 94.2% (SI Appendix, Fig. S1). Assuming data collected from the literature representatively sample the 122-region ipsilateral matrix, the complete ipsilateral and contralateral connection dataset for one hemisphere would contain ∼4,292 ipsilateral macroconnections, and the complete intrinsic contralateral connection dataset would contain ∼955 macroconnections. Combining the ipsilateral and contralateral connection data, each cerebral hemisphere generates ∼5,310 intrinsic connections: a total of about 10,620 macroconnections for both the left and right cerebral hemispheres.
For network analysis, reported values of “no data” (and “unclear”) are assigned to and binned with reported values in the “absent” category (SI Appendix, Fig. S1) resulting in connection densities of 27.9% (4,118 of 14,762 connections) for intrinsic ipsilateral (EB1) connections in one hemisphere, 5.9% (883 of 14,884 connections) for intrinsic contralateral connections from that hemisphere, and 16.9% for intrinsic ipsilateral and contralateral connections combined arising in one hemisphere (Dataset S2). Considering only positively identified connections yields a mean number of input or output connections per region of 34 (4,118 connections for 122 regions) for EB1 connections (within one hemisphere), with considerable variations for individual cerebral hemisphere regions (input range: 1–80, output range: 0–95, range of total number of input and output connections: 1–175). The mean number of input or output connections per region for contralateral (crossed) intrahemispheric connections was seven (883 connections for 122 regions) (input range: 0–31, output range: 0–59, range of total number of input and connections: 0–69).
When both the right and left hemispheres are considered, the dataset for network analysis contained a grand total of 10,002 EB2 connections between 244 regions, with a connection density of 16.9%. The mean number of EB2 input or output pathways per region was 41 (input range: 1–95, output range: 0–149, range of total number of input and output connections: 1–212). On average, therefore, each of the 244 regions has 82 macroconnections within the right and left hemispheres.
The distribution of weight categories for intrinsic ipsilateral (EB1) connections and intrinsic contralateral connections reported as present for each hemisphere is shown (respectively) in SI Appendix, Fig. S2 A and B. As in previous work, for weighted network analysis, an exponential scale was applied to the ordinal weight categories (SI Appendix, SI Materials and Methods and Fig. S2C) such that the strongest and weakest connection weights spanned four orders of magnitude, a range consistent with quantitative pathway tracing results in rat (5).
Modularity/Subsystem Analysis.
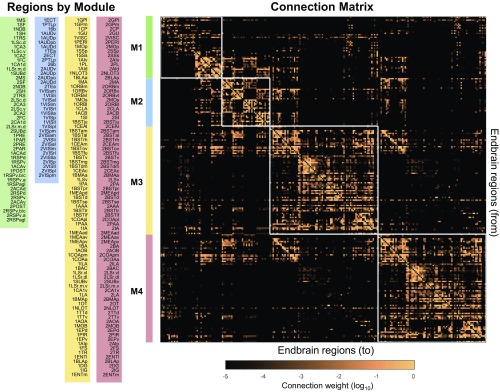
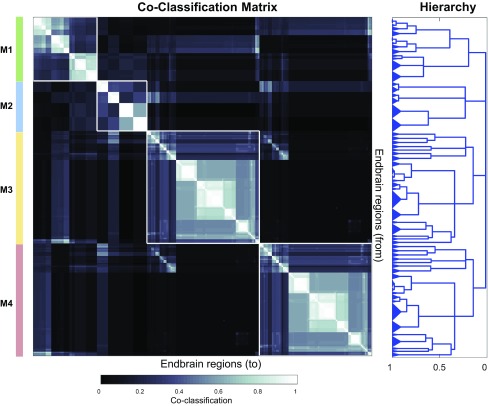
MRCC analysis (8) applied to the entire 244 × 244 matrix of connections between the right and left cerebral hemispheres (together, the complete endbrain or EB2 matrix) yielded a top-level or first-order solution of four modules (M1–M4; Fig. 2). The complete coclassification matrix displays 60 bottom-level modules arranged in a hierarchy or cluster tree with 50 levels or solutions, segregated into bilaterally symmetrical sets of 30 modules and 25 levels on each side of the brain (Fig. 3 and Movie S1).
Fig. 2.
EB2 connection matrix, with connection weights displayed on a log10 scale and arranged in an ordering that matches the hierarchical ordering delivered by MRCC. MRCC yields four top-level modules (subsystems, clusters) for the complete set of 244 (122 per side) endbrain regions (EB2). The regions (nodes) in each module of this coclassification connection matrix are arranged to match the ordering in Fig. 3. For the underlying MRCC (8), we used α = 0.05 with 100,000 event samples. Details of individual gray matter region arrangement and definitions of region abbreviations are provided in Dataset S2. The prefix “1” or “2” for region names refers (respectively) to “side 1” (Left or Right) or “side 2” (Left or Right) of the endbrain.
Fig. 3.
Complete coclassification matrix obtained from MRCC (as in Fig. 2) for 244 (122 per side) cerebral hemisphere (endbrain) regions (EB2). A linearly scaled coclassification index gives a range between 0 (no coclassification at any resolution) and 1 (perfect coclassification across all resolutions). Ordering and hierarchical arrangement are determined after building a hierarchy of nested solutions that recursively partition each cluster/module, starting with the four top-level clusters/modules. The 60 modules obtained for the finest partition are indicated on the left edge of the hierarchy, while the four top-level modules appear at the top of the tree on the right edge of the hierarchy. The total set of 50 distinct levels of the hierarchy represent partitions along vertical cuts through each unique set of branches (also Movie S1). The length of each distinct set of branches represents a distance between adjacent solutions in the hierarchical tree that may be interpreted as its persistence along the entire spectrum; dominant solutions extend longer branches, while fleeting or unstable solutions extend shorter branches. All solutions plotted in the tree survive the statistical significance level of α = 0.05. Gray matter region abbreviations (matching those in Fig. 2) are defined in Dataset S2.
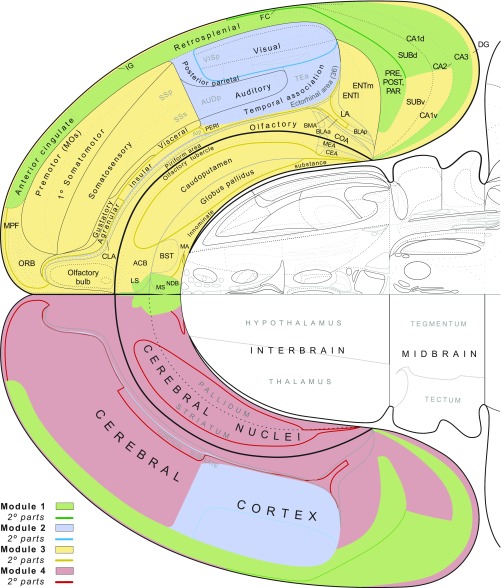
The broad structure/function significance of the four parent modules is most easily appreciated by viewing them on a flat map (Fig. 4), where it is clear that two modules (M3 and M4) are mirror images, one (arbitrarily) on the right and one (arbitrarily) on the left, and the other two modules (M1 and M2) are bihemispheric, each with identical components on the two sides. It is also clear that, topologically, the cortical regions belonging to each parent module form a spatially segregated entity with the aggregate modules on each side forming a core and shell arrangement. Cortical parts of M2 form the core, cortical parts of M3 and M4 form the ventral shell, and cortical parts of M1 form the relatively narrow dorsal shell. In other words, the structural regions comprising the nodes in top-level endbrain modules are highly compact spatially, and this applies to both cerebral cortical and cerebral nuclei parts (Fig. 4).
Fig. 4.
Spatial distribution of high-level connection modules of the cerebral hemispheres displayed on a flat map of the rat forebrain and midbrain. The four top-level modules (Fig. 2) are color-coded as in Figs. 2 and 3 (key at lower left) and form a basic core and shell motif in each hemisphere. The next level partition of each parent module (Fig. 3) is indicated by a correspondingly colored line (key at lower left). High-resolution details and further explanation of the flat map are provided in the study by Swanson (11). Abbreviations are defined in Dataset S2. The flat map is adapted from ref. 11.
M2 is the easiest to describe (Figs. 2–4, blue and SI Appendix, Fig. S3). Mirror image halves on the right and left sides contain all of the visual and auditory areas along with nearby “association” areas, and, uniquely, this module has no cerebral nuclei components. M2 has three second-order modules. One consists of the 10 visual areas on the right side and 10 visual areas on the left side. The other two second-order modules are identical on the right and left sides, each consisting of the four auditory areas (AUDp,d,v,po), a temporal association area (TEa), a posterior parietal area (PTLp), an ectorhinal area (ECT; inferior temporal), and subplate layer 6b. Finally, each “auditory-related” second-order module has two identical third-order modules: (i) AUDp,d,v,po and TEa and (ii) ECT, PTLp, and 6b.
M3 is the largest top-level subsystem (Figs. 2–4, yellow and SI Appendix, Fig. S4); it is unilateral only, and M4 is its mirror image in the opposite hemisphere (Figs. 2–4, pink). M3 (and M4) has two second-order modules. The cortical components of one second-order module consist of primary somatosensory (SSp) and supplemental somatosensory (SSs), primary somatomotor (MOp) and secondary somatomotor (MOs; also called premotor), gustatory (GU), and visceral sensory-motor (VISC) areas; the prelimbic (PL; medial prefrontal), medial, ventral, ventrolateral, and lateral orbital (ORBm,v,vl,l), ventral and dorsal agranular insular, and perirhinal (PERI) areas; the claustrum (CLA); and the anterior basolateral amygdalar nucleus (BLAa) and nucleus of the lateral olfactory tract dorsal cap (NLOT3). Cerebral nuclei components of this second-order module include the caudoputamen (CP), medial and lateral globus pallidus, and magnocellular nucleus (MA).
This M3 (and M4) second-order module, in turn, has three third-order modules: (i) cerebral cortical SSp, SSs, MOp, GU, and VISC, with cerebral nuclei CP, lateral globus pallidus (GPl), and medial globus pallidus (GPm); (ii) cerebral cortical PL, dorsal agranular insular, ventral agranular insular, NLOT3, and BLAa; and (iii) cerebral cortical MOs, ORBm,v,vl,l, and CLA, with cerebral nucleus MA. Each third-order module is then further subdivided. For example, the first third-order module i has three fourth-order modules: the familiar CP, GPl, and GPm (the dorsal striatopallidum); the GU, VISC, and PERI; and the SSp, SSs, and MOp.
The other second-order component of M3 (and M4) has three third-order parts that are somewhat difficult to categorize. Generally, one third-order module is dominated by main olfactory components and the medial and lateral entorhinal areas (ENTm,l); another third-order module is dominated by accessory olfactory components and the ventral hippocampus (CA1v, ventral subiculum); and the remaining third-order module is dominated by the accumbens nucleus and innominate substance (SI) (the ventral striatopallidum), central amygdalar nucleus, and bed nuclei of the terminal stria. These third-order modules are further divided multiple times.
M1, like M2, has mirror image halves on the right and left sides (Figs. 2–4, green and SI Appendix, Fig. S3), so only one side requires description. The cortical part of M1 resembles a module identified earlier in an analysis of cortex-alone connectivity (7), and it corresponds approximately to the default mode network identified in humans, rats, and mice. M1 (on each side) has two second-order modules. One consists of the ventral and dorsal anterior cingulate areas; the dorsal, anterior part of ventral, a part of ventral, and b/c part of ventral retrosplenial areas (RSPd,v,v.a,v.b/c); and the postsubiculum, presubiculum, and parasubiculum of the hippocampal formation. There are no cerebral nuclei components of this second-order module. The other second-order module has cortical and nuclear components. The main cortical parts are hippocampal and include fields CA3 and CA2, dorsal field CA1, and the dorsal subiculum. Main nuclear parts are in the septal region and include the medial septal and diagonal band nuclei, parts of the lateral septal nucleus, and the septofimbrial and triangular nuclei.
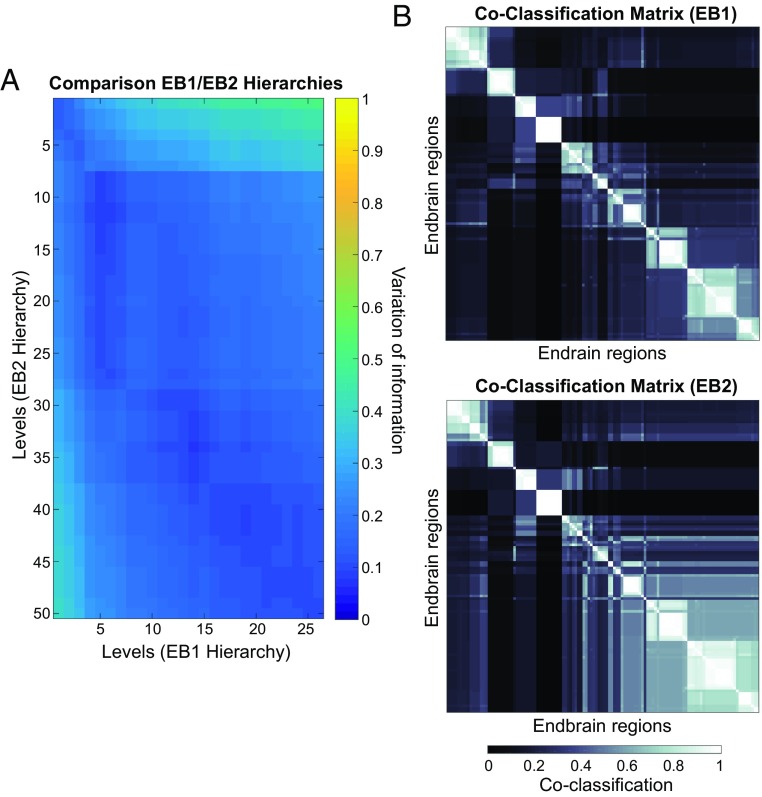
MRCC analysis was also applied to the 122 × 122 EB1 matrix of connections within a single cerebral hemisphere, reminiscent of a hemisphere isolated from its counterpart on the other side in a split-brain preparation. This analysis yielded a top-level solution of four modules (SI Appendix, Fig. S5A). Two of these modules are identical to M1 and M2 of the bilateral solution, and the other two modules partition M3 (and its M4 counterpart on the opposite side). The smaller of the two partitions includes the accessory olfactory bulb; the cortical, basomedial, and lateral amygdalar nuclei; the prefrontal infralimbic area (ILA); and ventral parts of the hippocampus (CA1 and subiculum). The complete coclassification matrix displays 31 bottom-level modules arranged in a hierarchy with 26 levels (SI Appendix, Fig. S5B and Movie S1). Comparing these 26 solutions with the 50 solutions derived from the bihemispheric endbrain (discussed above) reveals high similarity throughout the hierarchy (Fig. 5).
Fig. 5.
Comparison of modules derived from EB1 and EB2 MRCC. (A) Variation of information (VI; a measure quantifying the similarity of two partitions) is plotted between all levels in the EB1 MRCC hierarchy and all levels in the EB2 MRCC hierarchy. (B) EB1 coclassification matrix (SI Appendix, Fig. S5B) next to the corresponding portion (unilateral only) of the EB2 coclassification matrix. The low VI values, with minima reached along the diagonal axis of the plot in A and the strong overlap of plots in B indicate strong similarity between module EB1 and EB2 partitions. Any deviations are due to the addition of contralateral projections to the EB2 subconnectome. As in Fig. 3, the linearly scaled coclassification index gives a range between 0 (no coclassification at any resolution) and 1 (perfect coclassification across all resolutions).
Comparison Between Different Module Analysis Methods.
In previous analyses of bilateral intracerebral nuclear (6) and intracerebral cortical (7) connectivity, modules were detected with a modularity maximization algorithm, systematically varying the spatial resolution parameter γ between 0.5 and 1.5 (centered on the commonly used default setting of 1) and choosing for further consideration the single solution that was most stable and fully homogeneous over the widest range of γ. Here, the modularity maximization algorithm was updated to better match results of the MRCC approach, and a wider range of γ values between 0.1 and 4.0 (in 0.01 steps, resulting in 391 levels of γ) was employed. We then examined optimal module partitions at each separate level of spatial resolution defined by γ and compared them with the MRCC-derived modular partitions.
First, the EB1 subconnectome (122 × 122 regions) was used, and of the 391 solutions, the most stable module partitioning was found between γ = 0.65 and γ = 0.85 (SI Appendix, Fig. S6A, Left and Center). This partitioning has four modules/subsystems that are nearly identical to those from the MRCC analysis (Modularity/Subsystem Analysis and SI Appendix, Fig. S6A, Right), with the sole exception of the ventral orbital area, whose assignment differs for the two approaches. The same analysis carried out on the EB2 connectome (244 × 244 regions), again yielding 391 solutions, with the most stable partitioning yielding a six-module solution between γ = 1.0 and γ = 1.3 (SI Appendix, Fig. S6B, Left and Center), which is closest to solutions around levels 8–10 in the MRCC hierarchical tree (SI Appendix, Fig. S6B, Right).
Comparison with Modules Generated in Cerebral Nuclei and Cerebral Cortex Subconnectomes.
In previous work, we described modules extracted from the cerebral nuclei (6) and cerebral cortex (7) subconnectomes, and we selected stable solutions comprising four and three modules per subconnectome, respectively. We asked if these seven modules show any resemblance to the dominant four-module solutions identified for EB1 and EB2, respectively. SI Appendix, Fig. S7A plots the distance (expressed as the variation of information) between all solutions in the multiresolution hierarchy here and the modules extracted from subconnectomes previously. Distances are significantly smaller than expected by chance across all levels. More detailed analysis (SI Appendix, Fig. S7B) shows that several cerebral nuclei and cerebral cortex modules transfer to the modular arrangements of EB1 and EB2, suggesting that at least some of the subconnectome modular architecture is preserved as these structures are considered jointly, as part of a single network.
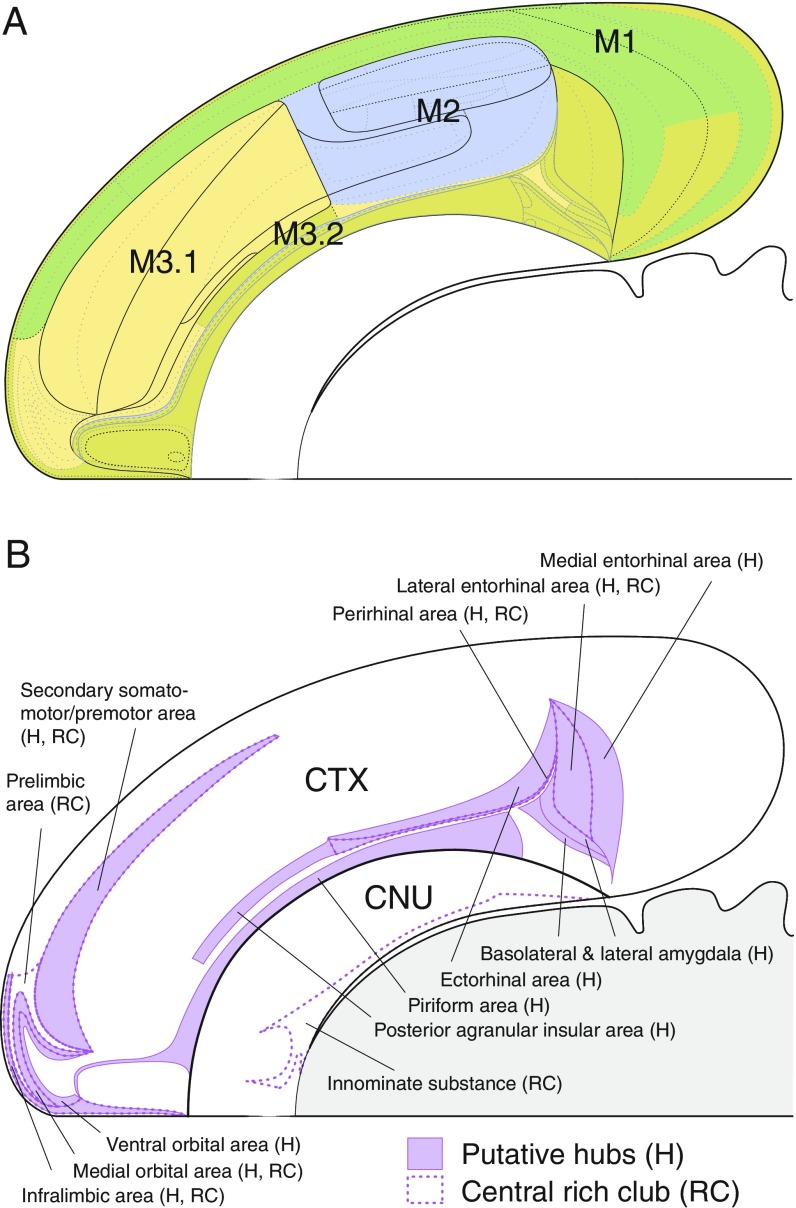
A clear example of such preservation is provided by the first division of the four parent (top-level) modules in the hierarchy tree (Fig. 3 and bilaterally symmetrical levels 3 and 4 in Movie S1). The two-part division (Fig. 6A) yields (i) a core of somatosensory- and somatomotor-associated regions rostrally adjacent to the core of visual- and auditory-associated regions and (ii) a ventral shell of regions associated with the medial prefrontal cortex, olfactory cortex, amygdalar region, and ventral hippocampus. This core and shell arrangement is very reminiscent of the four-module solutions arrived at previously (5, 7) for the cerebral cortex alone.
Fig. 6.
(A) First division of top-level subsystems for the right cerebral hemisphere displayed on a flat map of the rat forebrain and midbrain. As shown in the hierarchy of Fig. 3 and Movie S1, module 3 (and the corresponding module 4 on the other side, not shown) splits into two parts. The result is a clear four-part core and shell topology on each side, with M2 (blue) and M3.1 (yellow) as the core and M1 (green) and M3.2 (dark yellow/mustard) as the dorsal and ventral shells, respectively. (B) Spatial distribution of putative hubs (H) and the central rich club (RC) of the bilateral endbrain connectome that are symmetrically arranged in each hemisphere. For simplicity, they are displayed for the right cerebral hemisphere on a flat map of the rat forebrain and midbrain. Together the hubs and rich club form a C-shaped domain lying predominantly within module 3 on one side and the corresponding module 4 on the other side (Fig. 4). The only exception is the inferior temporal ECT in module 2. The 13 hubs are as follows: piriform area, medial entorhinal area, lateral entorhinal (ENTl) area, ILA, posterior agranular insular area, ventral orbital area, medial orbital (ORBm) area, MOs area, PERI area, ECT, BLAa nucleus, posterior basolateral amygdalar nucleus, and lateral amygdalar nucleus. The rich club consists of SI and ENTl, ILA, PL, ORBm, MOs, and PERI areas. The flat map is adapted from ref. 11.
Small World, Hubs, and Rich Club.
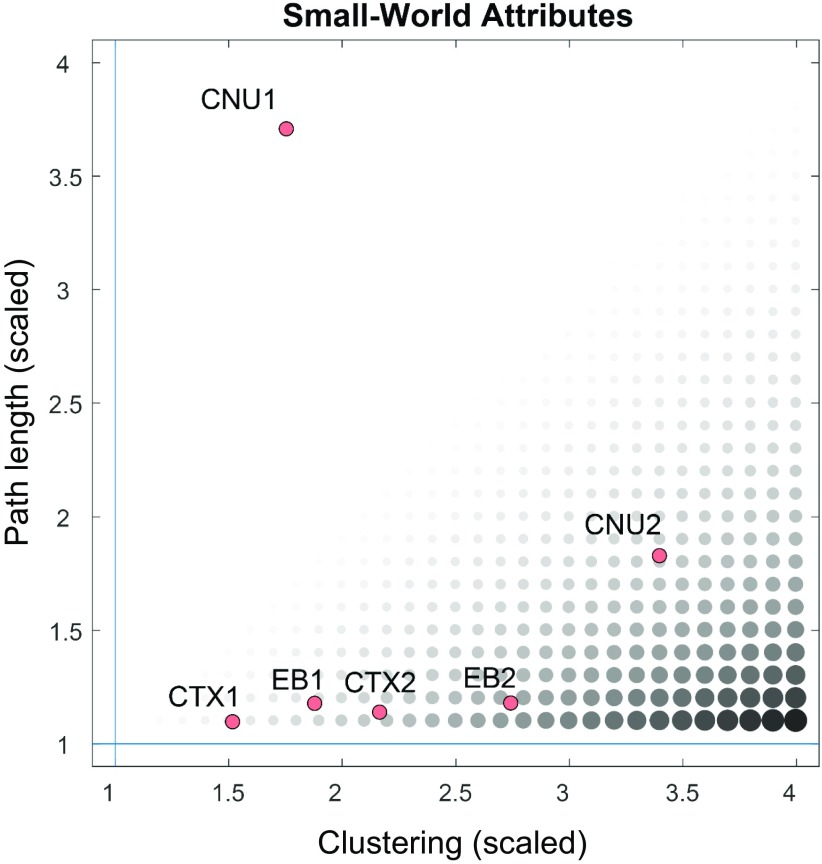
The connection topology of the rat EB2 macroconnectome (Fig. 2) exhibits small-world attributes (SI Appendix) characterized by high clustering (a weighted clustering coefficient of 0.0197) that is significantly greater than that of a population of 10,000 randomly rewired networks preserving degree sequence (0.0072 ± 1.1 × 10⁻⁴, mean and SD) and high global efficiency (0.1835) approaching that of the null model (0.2175 ± 0.0021). It is instructive to consider how small-world attributes of the two subconnectomes combine in the overall endbrain architecture (Fig. 7). Considered in isolation, the unilateral cerebral nuclei (CNU1) network exhibits path lengths that are significantly greater than those of random null models, and hence lacks small-world organization (6). Including contralateral projections generally increases clustering and lowers the path length; this can be seen for the bilateral cerebral nuclei (CNU2), cerebral cortex (CTX2), and EB2 networks. As reported earlier (7), the unilateral cerebral cortex (CTX1) network does show both high clustering and short path length; in this case, the combination of both subconnectomes (CNU1 + CTX1), as well as their bilateral counterpart, restores small-world attributes to the overall EB2 architecture.
Fig. 7.
Summary of small-world attributes for various subconnectomes (CNU1, CNU2, CTX1, and CTX2). Clustering is computed as the nodal mean of the weighted and directed clustering coefficients, and path length is computed as the global mean of the weighted path lengths between all node pairs. Both metrics are scaled by the median of the corresponding measures obtained from 1,000 degree-preserving randomized networks. The size and gray level of black symbols correspond to the ratio between scaled clustering and scaled path length, the small-world index (19). For a network to possess small-world attributes, this index should be >1, with a high (scaling >> 1) clustering index and a short (scaling near 1) path length. CTX1/CTX2 and EB1/EB2 exhibit such small-world attributes, while CNU1 does not. The addition of contralateral connections in CNU2 increases clustering and lowers path length, with the network approaching the small-world regime.
Rankings of brain areas according to four centrality measures (degree, strength, betweenness, and closeness) computed from the EB2 network are summarized in Fig. 8. Twenty-six regions (13 pairs across both sides) form putative hubs in the network topology, based on their aggregated ranking score in the top 20th percentile on all four centrality measures. All 13 hub regions (Fig. 6B) are in the cerebral cortex (none are in the cerebral nuclei), and all but one are members of M3 (and its identical M4 counterpart on the other side of the brain); the exception is the ventral temporal ECT in M2.
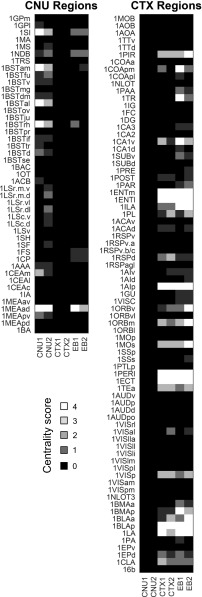
Fig. 8.
Comparison of candidate hubs obtained from subconnectomes CNU1, CNU2, CTX1, and CTX2 with those obtained from analysis of EB1 and EB2. Grayscale indicates the “centrality score,” expressing the number of times each region ranked in the top 20% for each of four centrality measures (degree, strength, closeness, and betweenness). Regions with a centrality score of 4 were considered candidate hubs in previous studies (6, 7). All centrality scores for CNU regions (Left) and CTX regions (Right) are listed here. Note that hub rankings are modulated as subconnectomes grow, either from including only ipsilateral connections to including also contralateral connections (CNU1 > CNU2, CTX1 > CTX2, EB1 > EB2) or by aggregating different subdivisions of the nervous system (CNU1 + CTX1 > EB1; CNU2 + CTX2 > EB2).
Together, the 13 putative hubs form a topographically related C-shaped band in each cortical sheet. Rostrally, the band of hubs consists of the medial prefrontal ILA, and dorsolateral to it, the premotor area (MOs) forms the dorsal arm of the band. The ventral arm of the band extends caudally as the medial and ventral orbital areas; piriform and posterior agranular insular areas; ECT, PERI, and ENTm,l areas; and BLAa, posterior basolateral amygdalar, and lateral amygdalar nuclei.
How do hub rankings for EB2 compare with hubs detected in its constituent subconnectomes, that is, in CNU1, CNU2, CTX1, CTX2, and EB1? Hub rankings for all six structures are shown in Fig. 8. Notably, as subconnectomes combine into larger networks, regional hub rankings shift, with some regions maintaining their status as hubs, while others fall in ranking. Only six hubs maintain the highest rankings in all four CTX-EB analyses, and all of these hubs are in or near ventral (inferior) and medial temporal cortical regions; in contrast, no hubs maintain the highest ranking across all four CNU-EB analyses. These results suggest that the consideration of connections between major anatomical subdivisions (e.g., those between CNU and CTX subconnectomes), and of contralateral connections, can alter a given region’s connectivity fingerprint sufficiently to elevate or diminish its global centrality in the network. Hence, the status of a region as a connectivity hub is not absolute but, instead, depends on the size and coverage of its anatomical neighborhood.
Rich club analysis (details are provided in SI Appendix) revealed the presence of rich club organization in the EB2 connectome. High-degree nodes exhibited significantly greater density of mutual interconnections compared with a degree-preserving null model, assessed after correcting for multiple comparisons. The rich club regime extends over a broad range of node degrees, forming several different levels or “shells.” Focusing on the innermost (core) rich club shell, we find it comprises a total of 14 regions composed of two identical sets of seven nodes that lie entirely within M3 and its bilaterally symmetrical counterpart M4. Six rich club members in each hemisphere are in the cerebral cortex, where they form two “patches” (Fig. 6B): a caudal patch in medial temporal regions (PERI and adjacent lateral entorhinal area) and a rostral patch in prefrontal regions [the contiguous MOs (premotor), PL, ILA, and medial orbital areas]. The SI/ventral pallidum is the sole representative of the cerebral nuclei in the central rich club of each hemisphere.
Discussion
Three main findings emerge from the analysis presented here. First, available experimental pathway tracing data suggest that at least 10,000 macroconnections (of a possible 59,292) exist between the 244 gray matter regions identified so far in the right and left cerebral hemispheres of the rat (122 corresponding regions in each side). Second, despite this complexity, MRCC analysis provides a hierarchical framework for identifying putative subsystem organization within the network, with a surprisingly simple four-subsystem solution at the top level. Third, subconnectome analysis indicates that the status of a region as a connectivity hub in a network is not absolute but, instead, depends on the size and coverage of its anatomical neighborhood.
Before discussing the implications of our results, it is important to recognize that databases of connection reports, and the methods used to analyze properties of networks formed by the connections, can be expected to evolve. For example, more extensive curation of the existing literature (7) and the publication of new connectional studies stimulate the creation of new versions of existing connectomes. Therefore, it is important for researchers to provide open-access versions of their connectome metadata along with clear versioning information.
Similarly, the development of new network analysis tools leads to more refined insights into network architecture, even in legacy databases. The MRCC approach was recently designed (8) to capture and organize the large diversity of community structure solutions that are often obtained across multiple spatial scales within the same real-world network, by deploying a dual approach based on consensus clustering and identifying consensus hierarchical structures. A direct comparison of community detection within the same datasets based on the MRCC used here and the modularity maximization approach used previously (6, 7) showed that the single most stable solution identified in the latter can be detected within the cluster hierarchy resulting from the former analysis, with very minor or no differences in community identity. One of the major advantages of the multiresolution technique is that it delivers a full picture of a network’s community structure across multiple scales (accounting for statistical significance of solutions) without the need to select a single solution based on some criterion of stability or persistence.
We approach the goal of creating a top-level, global-wiring diagram of the rodent nervous system [a neurome (5)] systematically by assembling from rostral to caudal a sequence of subconnectomes based on the 10 basic parts of the central nervous system (13). First, the network architecture of axonal connections within and between the right and left cerebral nuclei was investigated (6), followed by a similar analysis of connections between the right and left cerebral cortex (7). Here, the analysis is extended to include connections between the cerebral nuclei and cortex (Fig. 1), which involved assembling 16 subconnectomes. Naturally, the question arises as to how network architecture changes as components are added or subtracted, and the current analysis provided an opportunity to address this question. Clearly, module composition, small-world attributes, hub identity, and rich club membership can and do change, but often in systematic ways. This is easily appreciated for putative hubs, where some remain highly ranked with varying submodule composition and others fall in the rank ordering (Fig. 8).
There are no comparable systematic analyses of endbrain (telencephalic) global network organization with which to compare our results, and we have reviewed other connectomics analyses of intracortical axonal connections in the mouse, rat, and monkey elsewhere (5, 7). A recent analysis of connectivity arising in 19 regions and projecting to 42 ipsilateral regions of the mouse cerebral cortex reported that 97% of all possible interregional connections were detected with the retrograde tracer diamidino yellow (14). This result was based on a pathway tracer that can be taken up avidly and transported by axons-of-passage (15), and a substantial proportion of the reported connections were very to extremely weak. By contrast, in our ipsilateral intracortical network, 38% of the possible connections between 77 regions in the rat have been reported in the literature (7). This discrepancy prompted us to test in the EB1 network the effect on module configuration of converting the 62% absent connections to a weight of very weak, numerically adding 10,644 “false positives” to the dataset and producing a fully connected network. Analyzing this artificially ultradense EB1 network with both the modularity maximization and MRCC approaches used here gave very similar results to the original dataset. The largest deviation between the original EB1 network and the ultradense EB1 network was a single region that switched modules. This finding confirms that, in weighted network analysis, extremely weak connections have little impact on salient network attributes, such as modules. It is noteworthy that this does not contradict Granovetter’s seminal thesis about the “strength of weak ties” (16) because weak ties do not (as is often misunderstood; e.g., ref. 14) refer to very weak connections per se but, rather, to connections that link distinct communities or modules.
The magnitude of complexity within the top-level architecture of the rodent cerebral hemispheres is daunting: At least 10,002 of 59,292 possible axonal macroconnections between their currently recognized 244 gray matter regions have been reported in the neuroanatomical literature based on experimental pathway tracing methods. However, the MRCC approach (8) applied here provides a systematic way to analyze the subsystem organization of this network through hierarchical community clustering. In the current analysis, there are 60 subsystems at the bottom of the hierarchy, and they combine in specific ways through 50 levels of the hierarchy branching pattern (Movie S1) to form just four primary subsystems at the top level.
As presented in Results, following the subsystem organization down the hierarchy tree can readily be interpreted within a broadly neurobiologically meaningful functional framework. This quantitative, “bias-free,” and data-driven approach has proven useful for understanding organizing principles of intrinsic circuitry for major central nervous system parts like the cerebral cortex alone; the cerebral nuclei alone; or their combination, the endbrain/telencephalon as a whole. However, our results also make clear that the network role of individual nodes and clusters within major parts can be expected to change when interactions between the major parts are considered, and when additional subconnectomes are assembled together. The logical next step in our research is to include the connections of the two other parts of the forebrain, the thalamus and hypothalamus, in the network dataset and analysis.
In conclusion, it is important to note that the major strengths of the approach taken here are that (i) connection matrices (connectomes), in principle, organize all relevant data (including negative evidence and gaps in existing data) associated with a particular domain in a systematic, internally consistent way; (ii) the large datasets in these matrices may be subjected to “unbiased” investigation with a variety of network analysis tools; and (iii) the underlying “gold standard” database of connection reports is provided to the community as an open-access resource for further analysis or modification. On the other hand, it is also important to emphasize that one caveat of the approach is that the network features associated with a connectome may change with (i) newer versions of the connection matrix based on additional connection reports and/or different network analysis strategies and (ii) the addition or deletion of subconnectomes. In short, we are using a data-driven approach, and current conclusions about network properties may be confirmed, disproven, or modified by future versions of the connection matrices, and by wider or deeper anatomical coverage of the nervous system as a whole. For example, while no sex-related or right/left differences have yet been substantiated for connections within the rat endbrain, both types of difference have been reported for connections associated with more caudal parts of the brain (17, 18).
Materials and Methods
Methods for the underlying network analysis are essentially the same as those described in detail elsewhere (7, 8); they are also described and elaborated in SI Appendix. All relevant data in the primary literature were interpreted in the only available standard, hierarchically organized, annotated parcellation and nomenclature for the rat brain (11) using descriptive nomenclature defined in the foundational model of connectivity (9, 10). Ipsilateral and contralateral connection reports were assigned qualitative connection weights on an ordinal scale based on pathway tracing methodology, injection site location and extent, and described anatomical density. All collated connection report data and annotations are provided in a Microsoft Excel worksheet (Dataset S1), and the data extracted from these reports to construct connection matrices are provided (in multiple representative arrangements) in an Excel workbook (Dataset S2). To facilitate access to the connection report data, they are also provided on an open-access website (The Neurome Project) that serves as an additional web repository for these efforts.
Supplementary Material
Acknowledgments
This work was supported, in part, by the Kavli Foundation (L.W.S. and J.D.H.).
Footnotes
The authors declare no conflict of interest.
Data deposition: An implementation of the multiresolution consensus clustering methods is available at https://github.com/LJeub/HierarchicalConsensus; all connection reports used for this study are supplied as a Microsoft Excel worksheet in SI Appendix, SI Materials and Methods and have been deposited at The Neurome Project (neuromeproject.org).
This article contains supporting information online at www.pnas.org/lookup/suppl/doi:10.1073/pnas.1807255115/-/DCSupplemental.
References
- 1.Willis T. 1664. Cerebri Anatome: Cui Accessit Nervorum Descriptio et Usus (Flesher, Martyn and Allestry, London). Latin.
- 2.Baer KEv. 1828. Über Entwickelungsgeschichte der Thiere. Beobachtung und Reflexion, Part 1 (Bornträger, Königsberg, Russia). German.
- 3.Swanson LW. Cerebral hemisphere regulation of motivated behavior. Brain Res. 2000;886:113–164. doi: 10.1016/s0006-8993(00)02905-x. [DOI] [PubMed] [Google Scholar]
- 4.Swanson LW. Neuroanatomical Terminology: A Lexicon of Classical Origins and Historical Foundations. Oxford Univ Press; Oxford: 2015. [Google Scholar]
- 5.Bota M, Sporns O, Swanson LW. Architecture of the cerebral cortical association connectome underlying cognition. Proc Natl Acad Sci USA. 2015;112:E2093–E2101. doi: 10.1073/pnas.1504394112. [DOI] [PMC free article] [PubMed] [Google Scholar]
- 6.Swanson LW, Sporns O, Hahn JD. Network architecture of the cerebral nuclei (basal ganglia) association and commissural connectome. Proc Natl Acad Sci USA. 2016;113:E5972–E5981. doi: 10.1073/pnas.1613184113. [DOI] [PMC free article] [PubMed] [Google Scholar]
- 7.Swanson LW, Hahn JD, Sporns O. Organizing principles for the cerebral cortex network of commissural and association connections. Proc Natl Acad Sci USA. 2017;114:E9692–E9701. doi: 10.1073/pnas.1712928114. [DOI] [PMC free article] [PubMed] [Google Scholar]
- 8.Jeub LGS, Sporns O, Fortunato S. Multiresolution consensus clustering in networks. Sci Rep. 2018;8:3259. doi: 10.1038/s41598-018-21352-7. [DOI] [PMC free article] [PubMed] [Google Scholar]
- 9.Swanson LW, Bota M. Foundational model of structural connectivity in the nervous system with a schema for wiring diagrams, connectome, and basic plan architecture. Proc Natl Acad Sci USA. 2010;107:20610–20617. doi: 10.1073/pnas.1015128107. [DOI] [PMC free article] [PubMed] [Google Scholar]
- 10.Brown RA, Swanson LW. Neural systems language: A formal modeling language for the systematic description, unambiguous communication, and automated digital curation of neural connectivity. J Comp Neurol. 2013;521:2889–2906. doi: 10.1002/cne.23348. [DOI] [PMC free article] [PubMed] [Google Scholar]
- 11.Swanson LW. Brain maps 4.0-Structure of the rat brain: An open access atlas with global nervous system nomenclature ontology and flatmaps. J Comp Neurol. 2018;526:935–943. doi: 10.1002/cne.24381. [DOI] [PMC free article] [PubMed] [Google Scholar]
- 12.Swanson LW, Lichtman JW. From Cajal to connectome and beyond. Annu Rev Neurosci. 2016;39:197–216. doi: 10.1146/annurev-neuro-071714-033954. [DOI] [PubMed] [Google Scholar]
- 13.Swanson LW. What is the brain? Trends Neurosci. 2000;23:519–527. doi: 10.1016/s0166-2236(00)01639-8. [DOI] [PubMed] [Google Scholar]
- 14.Gămănuţ R, et al. The mouse cortical connectome, characterized by an ultra-dense cortical graph, maintains specificity by distinct connectivity profiles. Neuron. 2018;97:698–715.e10. doi: 10.1016/j.neuron.2017.12.037. [DOI] [PMC free article] [PubMed] [Google Scholar]
- 15.Payne JN. Comparisons between the use of true blue and diamidino yellow as retrograde fluorescent tracers. Exp Brain Res. 1987;68:631–642. doi: 10.1007/BF00249806. [DOI] [PubMed] [Google Scholar]
- 16.Granovetter MS. The strength of weak ties. Am J Sociol. 1973;78:1360–1380. [Google Scholar]
- 17.Gu G, Cornea A, Simerly RB. Sexual differentiation of projections from the principal nucleus of the bed nuclei of the stria terminalis. J Comp Neurol. 2003;460:542–562. doi: 10.1002/cne.10677. [DOI] [PubMed] [Google Scholar]
- 18.Gerendai I, Halász B. Asymmetry of the neuroendocrine system. News Physiol Sci. 2001;16:92–95. doi: 10.1152/physiologyonline.2001.16.2.92. [DOI] [PubMed] [Google Scholar]
- 19.Humphries MD, Gurney K. Network ‘small-world-ness’: A quantitative method for determining canonical network equivalence. PLoS One. 2008;3:e0002051. doi: 10.1371/journal.pone.0002051. [DOI] [PMC free article] [PubMed] [Google Scholar]
Associated Data
This section collects any data citations, data availability statements, or supplementary materials included in this article.


