Abstract
Human cell-based 3D tissue constructs play an increasing role in disease modeling and drug screening. Inflammation, atherosclerosis, and many autoimmune disorders involve the interactions between immune cells and blood vessels. However, it has been difficult to image and model these interactions under realistic conditions. In this study, we fabricated a perfusion and imaging chamber to allow the real-time visualization of leukocyte perfusion, adhesion, and migration inside a tissue-engineered blood vessel (TEBV). We monitored the elevated monocyte adhesion to the TEBV wall and transendothelial migration (TEM) as the TE BV endothelium was activated by the inflammatory cytokine TNF-α. We demonstrated that treatment with anti-TNF-α or an NF-kB signaling pathway inhibitor would attenuate the endothelium activation and reduce the number of leukocyte adhesion (>74%) and TEM events (>87%) close to the control. As the first demonstration of real-time imaging of dynamic cellular events within a TEBV, this work paves the way for drug screening and disease modeling in TEBV-associated microphysiological systems.
Introduction
Many vascular diseases, such as inflammation, atherosclerosis, and cancer metastasis,1–4 involve the interactions between leukocyte and the endothelium of blood vessel. The number of leukocytes that aggregate near a lesion, adhering to, or transmigrating into the blood vessel, can serve as an important biomarker for vascular disease or drug screening. However, as blood vessels are opaque and mostly embedded within the human body, conventional optical or confocal microscopy cannot be applied, except to the microvessels. Other imaging modalities such as computed tomography (CT) scan and magnetic resonance imaging (MRI), which has a spatial resolution at hundreds of microns, cannot observe at the cellular level.5–6 In short, poor access to human blood vessels and the difficulty to image cellular interactions within them hinder the understanding of many vascular disease mechanisms.
Advances in vascular tissue engineering offer an alternative to the accessibility of human blood vessels. Human cell-based tissue-engineered blood vessels (TEBV) have been demonstrated as predictive in vitro models to facilitate drug toxicity/efficacy testing and disease modelling.7–11 Differing from earlier generations of artificial blood vessels fabricated from synthetic polymers like expanded polyetrafluoroethylene (ePTFE) and polyethylene terephthalate fibre, these TEBV are made with human cells and ECM proteins, thus can mimic many native blood vessel functions such as vaso-contractility, constriction, dilation, and endothelium-dependent NO release. Recent studies demonstrated the feasibility of studying drug responses in those TEBV.12–14 However, another important feature of blood vessel function – leukocyte-endothelium interactions – has not been characterized. Only limited studies have tackled the leukocytes interaction with TEBV, relying on “end-stage” observations in which TEBV are fixed and cut open at the end of the experiment to characterize the location of the leukocytes on and in the TEBV.13–14 The most desired information – the dynamics of leukocyte adhesion and transendothelial migration into the TEBV – has not been available. There are two primary obstacles that currently hinder the live imaging of TEBV, one is the lack of an optimally designed bioreactor that is compatible with microscopy regarding working distance of the microscope objectives. The other is the opaqueness of TEBV – it is not possible to look deep into the TEBV with common microscopic techniques.15
In this work, we address both problems by developing a Perfusion and Imaging Chamber (PIC), that coupled with deep-penetrating two-photon laser microscopy can observe dynamically the interactions of leukocyte with TEBV. We captured the leukocyte behaviour inside of TEBV under flow conditions and observed leukocyte-TEBV endothelium interactions such as leukocyte adhesion, migration, and trans-endothelial migration. We further investigated drug-induced alteration in leukocyte behaviour. As a first demonstration of real-time imaging of leukocyte adhesion on TEBV, this work paves the way for studying the mechanisms of immune cell-related vascular disease, offering a potential platform to screen anti-inflammatory drugs.
Materials and Methods
Cell Culture
hEPC: Human umbilical cord blood derived Endothelial Progenitor Cells (hEPCs) were isolated as previously described.12 In short, umbilical cord blood was obtained from the Carolina Cord Blood Bank. All patient identifiers were removed prior to receipt. The protocol for the collection and the usage of human blood in this study was approved by the Duke University Institutional Review Board. Cells were maintained in EGM2 (Lonza) in a humidified 5% CO2 incubator. Medium was changed every day. After reaching 90% confluency, cells were trypsinized (0.05% Trypsin/EDTA; Gibco) and split 1:4. Cells were used at passages 6-9 for TEBV lumen perfusion to form the endothelium. UASMC: Umbilical Artery Smooth Muscle Cells (UASMCs) were purchased from Lonza and cultured in SmGM (Lonza) in a humidified 5% CO2 incubator. After reaching 90% confluence, cells were trypsinized (0.25% Trypsin/EDTA; Gibco) and split 1:6. Cells were used at passages 5-6 to make the collagen tubular-TEBV. Leukocytes: Monocyte-like HL-60 cells were purchased from ATCC and cultured in RPMI-1640 with 15% FBS (Gibco) in a humidified 5% CO2 incubator. Cells were split 1:8 when reach 2×10⁶ cell/mL.
Fabrication of UASMC-TEBV in collagen scaffold
Collagen-TEBV: Collagen TEBV was fabricated similarly as previously described.12 Briefly, 5,000,000 UASMCs were embedded in 3mL (1.5mg/mL) Rat-tail collagen I (BD Biosciences) in a 3cc syringe (BD) with a closed two-way Luer-Lok stopcock (Cole-Parmer) attached. After gelation for 30 minutes, TEBVs were gently dehydrated to remove the water and increase the collagen fibre density.12 The outer and inner diameters of the TEBV were decided by the size of the mandrel and the mold, which was 2.5mm and 0.8mm respectively. TEBVs were then cultured in DMEM with 1.1g/L glucose L-glutamine and 110mg/L sodium pyruvate supplemented with 5% heat inactivated-Fatal Bovine Serum (Gibco) in a rotating bioreactor for two days. The TEBV lumen was then coated with EPCs (2×10⁶ cell/mL) by injecting EPCs into the lumen of each TEBV and rotated at 10 rotations per hour (rph) on a custom-made rotation platform for 2 minutes at 37°C to allow for cell adhesion. The TEBV was cultured for extra two weeks in a perfusion reactor with perfusion at a speed of 2mL/min. Peristaltic pump (Ismatec) was used to create flow through the TEBV. Flow circuit for TEBV was created using Tygon LMT-55 Tubing (Ismatec) and reservoirs. The circuit contained 35mL of flow media (DMEM with 1.1g/L glucose L-glutamine, and 110mg/L sodium pyruvate supplemented with 3.3% heat inactivated-Fatal Bovine Serum (Gibco), 1xNEAA,100U Pen-Strep). Media was replaced every 2-3 days.
Imaging
DIC/Phase/Epi-fluorescence imaging: DIC and Phase contrast imaging was taken using an Olympus IX81 inverted microscope with a 10× or 20× objective. Images were captured using an air-cooled SensiCam QE CCD camera (Cooke Corp., Romulus, MI) driven by Metamorph (Molecular Devices/Meta Imaging, Downingtown, PA).
Two-photon-/Multi-photon Confocal microscopy: Confocal images were taken using Nikon A1RMP laser scanning system on an Eclipse Ti stand equipped with a 25×/NA1.1 Apo LWD water-immersion objective. For two-photon imaging, samples were excited at 890 nm with infrared light produced by a Chameleon Vision II tunable laser (Coherent, Santa Clara, CA).
The second harmonic generated (SHG) signal from collagen fibres was detected with a non-descanned detector (NDD) using a 400-450 nm bandpass filter. The green and red fluorescence signal from cells was detected as well with NDD using a 470-550 nm and a 570-640 nm bandpass filter, respectively.
Leukocyte adhesion and trans-endothelial (TEM) migration assay
a. 2D-assay and DIC imaging
The confluent layer of endothelial progenitor cells (EPCs) was treated with or w/o TNF- alpha (200U/mL) for 4 hours before 1mL of monocytes like HL-60 was added to the confluent layer of the endothelial cell in 6-well plate at a concentration of 2×10⁵ cell/mL. Leukocytes were labelled with 1μM CMFDA for 30 minutes. After incubation for 1 hour, images serials were taken for 5 minutes at a 30 sec-interval. Cells that underwent transendothelial migration (TEM) – which significantly changed their shape – were recorded. After that, the dish was gently washed with PBS w/ Ca2+ and Mg2+ three times before fixation. Both phase images and fluorescent images were taken to analyze the adherent and transmigrated leukocyte. The number of cells attached to ECs was calculated by Analyze Particle with ImageJ software. The number of cells transmigrated was manually counted as their morphology was significantly different from other fluorescence-labelled monocytes. In each experiment, the cell number was counted and averaged from three microscopic views. Results were from four independent experiments
b. 3D-assay and two-photon imaging
Perfusion Assay: Monocyte-like HL-60 cells were labelled with red CMTPX (1μM) for 45 minutes. Endothelialized TEBV was perfused with 200U/mL TNF-α-containing DMEM medium for 4 hours. The leukocyte (2×10⁵ cell/mL) was then perfused in TEBV at a speed of 0.2mL/min (inducing a shear stress of ~0.5 dyne/cm2). Images/movies were taken using the two-photon confocal microscopy with a 25×/NA1.1 Apo LWD water-immersion objective. The 2D side-view of the TEBV for the perfusion of leukocyte, or the 3D-view of TEBV endothelium for the migration of leukocyte in TEBV was performed. Bi-directional imaging mode was used for leukocyte perfusion study to reach a scanning speed at 1 Frame Per Sec (FPS) (512×512 pixel). For leukocyte migration study, the stack of five images at different z position was imaged every minute (one z-stack per min) to achieve a better imaging quality (1024×1024 pixel). An 890nm infrared laser was used to illuminate the second harmonic signal of collagen and cells labelled with green or red fluorescence signals. For the leukocyte perfusion study, the TEBV was perfused with leukocyte-containing medium continuously. For the leukocyte migration study, the TEBV was perfused with HL-60 cell-containing DMEM medium for 20 minutes, and then followed with medium without the leukocytes. All images were taken in a time-lapse mode, and played back at different speed as indicated in the figure/movie captions. 3D images were 3D-reconstructed by Imaris 7.7. Results were calculated from 60 leukocytes in three experiments.
Leukocyte adhesion and TEM in TEBV (End-point Imaging): Monocyte-like HL-60 cells were labelled with red CMTPX (1μM), while EPCs, UASMCs in TEBV were labelled green CMFDA (1μM) for 45 minutes. TEBV were perfused with 200U/mL TNF-α-containing DMEM medium for 4 hours and then perfused with monocyte-like HL-60 cells at a concentration of 5×10⁶ cell/mL for 1 hour. The TEBVs were then washed with medium, fixed with 4% PFA, and the cell nucleus labelled with DAPI and imaged with two-photon microscopy. The TEBV cells (in green) and leukocytes (in red) could be distinguished by their fluorescent colour and their relative 3D positions – on the lumen of TEBV or in the blood vessel wall – were 3D- reconstructed by Imaris 7.7. The numbers of cells that adhered on the lumen of TEBV or migrated into the wall of TEBV were first filtered using Imaris 7.7 with size and fluorescent intensity filters and then counted manually. Data are averaged from three independent experiments.
Data Analysis and Statistics
Data was expressed as mean±SEM. Statistically significant difference was determined by either student t-tests or one-way ANOVA and Tukey’s post hoc test, statistical significance was set at p < 0.05.
Results
The process of a leukocyte interaction with TEBV is shown schematically in Figure 1. To perform the real-time imaging in TEBV, we first fabricated the TEBV and the Perfusion and Imaging Chamber for TEBV imaging.
Figure 1.
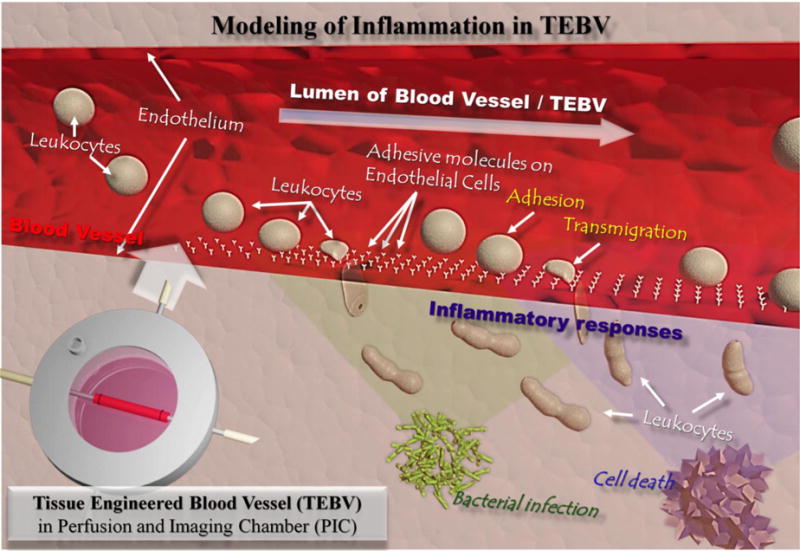
Schematic illustration of immune cell interactions with endothelium in blood vessels during inflammation caused by stimuli such as external bacterial infection or internal cell necrosis. Human cell-based tissue-engineered blood vessel (TEBV) is proposed as a model for disease modelling or drug screening in the vascular system.
Fabrication of Collagen Scaffold-based Tissue-Engineered Blood Vessel (TEBV)
Human umbilical artery smooth muscle cells (UASMC) were mixed within type I collagen hydrogel scaffold and embedded in a tubular mould to construct the vessel wall of the TEBV (details in Materials and Methods “TEBV-Tubular Method”). The cell-laden TEBVs were condensed and transferred to a micro-gravity bioreactor. After microgravity culture for two days, TEBVs were mounted on to a perfusion bioreactor and endothelialized by perfusion of Endothelial Progenitor Cells (EPC) through the TEBV lumen (details in Materials and Methods “TEBV-Endothelialization”). The endothelialized TEBV continued to be perfused in the bioreactor for another two weeks for maturation before further analysis. The overall process of fabrication and culture of TEBV is schematically shown in Figure 2A. Figures 2B to 2E are images of a TEBV in perfusion (2B), an SEM image of a TEBV (2C), an H&E staining of a TEBV (2D) (Supplemental Figure 1), and an immune-fluorescent staining image of a TEBV (2E), respectively.
Figure 2.
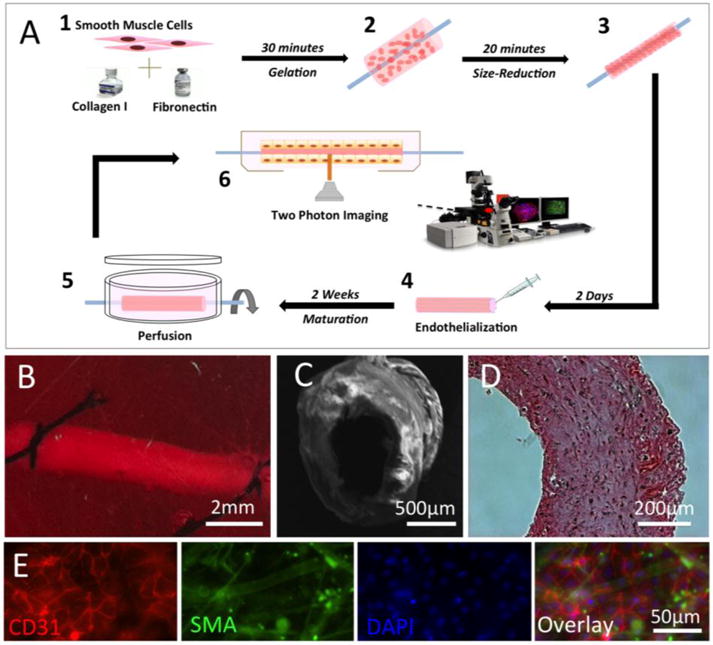
Fabrication of human cell-based tissue-engineered blood vessel (TEBV). (A) Schematic illustration of the fabrication process of a TEBV. (B) A TEBV in perfusion inside of a bioreactor. (C) Image of TEBV with Scanning Electron Microscopy (SEM). (D) Image of TEBV with H&E staining. (E) Immunostaining of TEBV showing the blood vessel wall with an intact endothelium (Red: CD31 as a marker for endothelial cells) and vascular smooth muscle cells (Green: smooth muscle actin as a marker for smooth muscle cells). Scale bars are indicated in each panel.
Design and Fabrication of Perfusion and Imaging Chamber (PIC) for Two-photon Imaging of TEBV
To facilitate both perfusion and imaging for TEBV, we specially designed the PIC chamber. The base of the chamber was 3D-printed with an inner diameter (I.D.) of 50mm for microscopic stage mounting, and large observation windows on both the chamber lids and chamber bottom to facilitate transmitted or inverted imaging. The central line of the inlet/outlet grips (in Figure 3A) in PIC were designed to be 1.5mm away from the observation window to meet the microscopy objective working distance specification (2mm). Two other side-channels in PIC are designed for chamber medium exchange (details in Materials and Methods). The main components of PIC are shown schematically in Figures 3A and 3B and the fabricated PIC with TEBV inside is shown in Figure 3C. The key components in the integrated PIC-two photon imaging setup are shown as inserts in Figure 3D.
Figure 3.
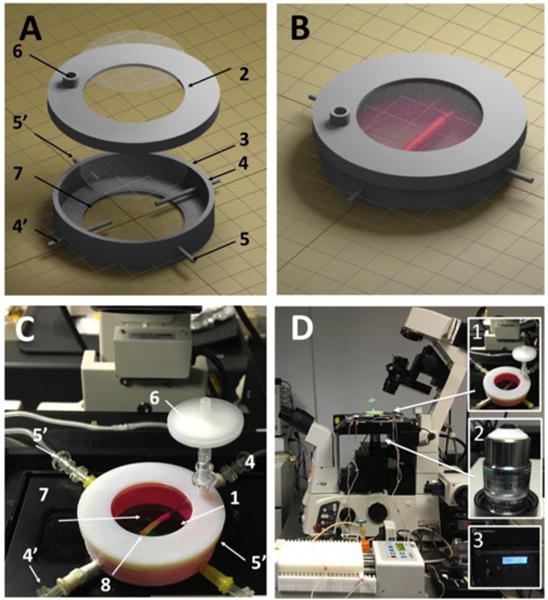
The PIC chamber and the imaging system setup. (A) Components of a PIC chamber; numbers described in (C). (B) Illustration of a TEBV inside a PIC chamber. (C) The TEBV-PIC chamber in actual imaging condition. Major components are labelled: top observation window (1), cover (2), chamber (3), TEBV perfusion inlet/outlet (4/4′), chamber medium perfusion inlet/outlet (5′), connector for air filter (6), bottom observation window (7), TEBV (8). (D) The setup of PIC perfusion on the confocal microscope. Inserted figures are the key components for TEBV imaging: PIC chamber (1), NIKON 25× LWD (2.0mm) objective (2), two-photon laser (3).
The main text of the article should appear here with headings as appropriate.
Leukocyte Interaction with Endothelial Cells on 2D and in 3D PIC System
Activation of vascular endothelium is one of the initial and essential steps in vascular inflammatory responses [3]. Activated endothelial cells (ECs) express surface adhesion molecules to recruit leukocytes, e.g. monocytes and neutrophils, to the inflammatory sites, and induce their attachment, aggregation, migration, and transendothelial migration (TEM). We first performed a 2D assay in the conventional Transwell configuration. In the 2D model, the monocyte adhesion and transmigration on confluent endothelial cell layer was significantly increased for > 70 folds after the endothelial cells were activated by TNF-α (Figures 4). The complete process of TEM, which typically transpire at a time scale of tens of seconds, was recorded (Supplemental Movie 1) and the montage of this process is shown in Figure 4B. During TEM, the monocytes underwent (orange arrow) a significant morphological change, from a spherical shape (yellow arrow) to a flattened shape (red arrow), as they moved under the endothelial cells.
Figure 4.
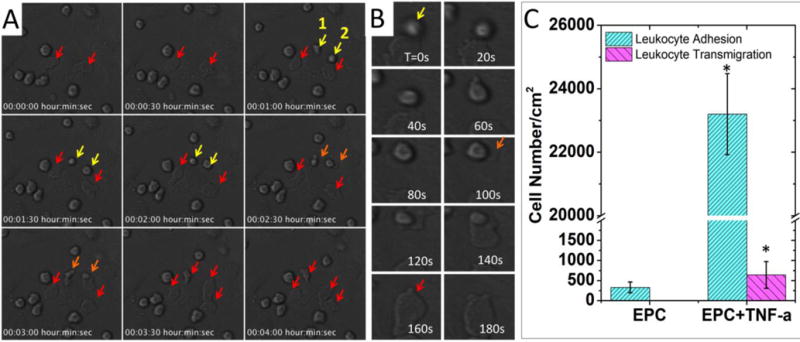
Imaging of monocyte adhesion and transmigration on 2D-cultured endothelial cells. (A) Time-lapse imaging of monocyte-like HL-60 cells attached to TNF-α-activated endothelial progenitor cells (EPC). Arrows indicate monocytes attached to ECs. Yellow arrow: attached monocytes. Orange arrow: monocytes undergoing transendothelial migration. Red arrow: monocytes after transendothelial migration. Cell morphologies changed after transmigration, as they were squeezed and trapped between ECs and the substrate. (B) A montage of monocytes undergoing trans-endothelial migration. The transmigration event happened during 100s-160s. (C) Comparison of the monocytes interaction with EPCs with or without TNF-α treatment. Adhesion: control (330±133/cm2) vs. TNF-α (23200±1276/cm2); transmigration: control (not observed) vs. TNF-α (640±332/cm2). In each experiment, the cell number was counted and averaged from 3 microscopic views. Data are shown as mean ± SEM from four independent experiments. Significance was determined by student t-test; * p<0.05.
To observe the monocyte-endothelium interactions in TEBV, the PIC system was installed onto the Nikon A1R confocal microscopy stage with a 25× L.W.D. objective (W.D.=2mm, N.A.=1.10) and using a two-photon imaging module. Monocytes were pre-labelled with red-fluorescent marker CMPTX. To minimize fluorescence background and possible fluorescence bleed through, we did not stain the blood vessel wall but used the second harmonic mode to image the collagen fibres in the TEBV vessel wall. After screening, we selected wavelength of 890nm as the best condition to obtain the second harmonic signals from collagen fibres (Supplemental Figure 2). With this setup, we could directly image the leukocytes inside the TEBV with a perfusion flow rate of 0.2mL/min. The imaging focal plane is schematically shown as Figure 5A upper left panel; and a full view of the microscopic image is shown in Figure 5A upper right panel. The blue signal indicates the dense collagen meshwork in TEBV wall, and the red signals are the stained monocytes. Monocytes in perfusion showed up as an elongated particle (green arrow) as they were fast moving across the whole imaging plane during the imaging. Leukocytes that firmly attached onto the endothelium of TEBV showed as red dots (yellow arrow) (Figure 5B; Supplemental Movie 2). In the movie, the monocyte highlighted by the arrow attached to the TEBV endothelium and gradually moved out of the confocal focal plan, indicating a TEM event (Supplemental Movie 2’0”-2′37”); next, another monocyte (green arrow) approached and attached at the same region (Supplemental Movie 2’48”). The montage of the entire process was shown in Figure 5C.
Figure 5.
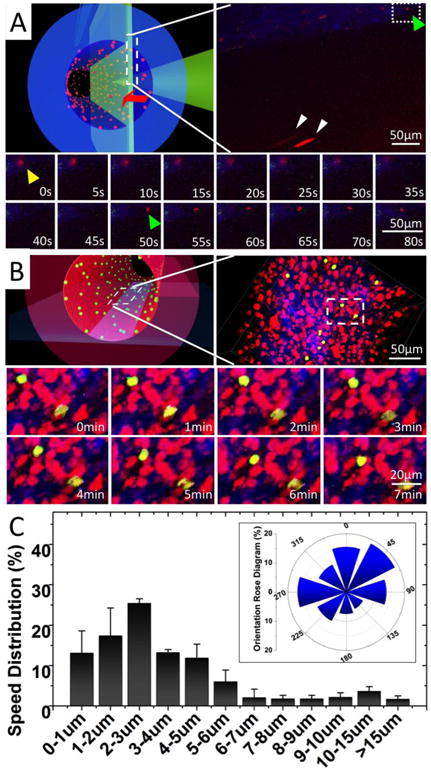
Real-time imaging of monocyte perfusion, adhesion and migration inside TEBV. (A) Monocyte perfusion and adhesion in TEBV. Upper left panel, a schematic illustration of the imaging focal-plane. Upper right panel, a full view of monocyte perfusion in TEBV. Yellow arrow: a monocyte adhered to endothelium during its transmigration. Green arrow: a new monocyte attachment event. White arrow: monocyte in perfusion. Lower panel, montage of the monocyte attachment and transmigration events (Supplemental Movie 2). (B) Monocyte migration on the TEBV endothelium. Upper left panel, a schematic illustration of the imaging focal-plane. Upper-right panel, a full view of monocyte migration on TEBV endothelium. Lower panel, montage of leukocyte migration on TEBV endothelium (Supplemental Movie 3). (C) Quantification of leukocyte migration speed distribution on TEBV endothelium and their migration directionality with Rose Diagram (inserted panel). The flow direction is set as degree zero. Results were calculated from 60 leukocytes in three experiments. Data are shown as mean ± SEM.
To investigate the leukocyte migration on the TEBV endothelium, we performed time-lapse multiple-layer Z-scanning at a higher resolution. The focal plane for imaging is schematically shown in Figure 5B upper left panel; and a microscopic image is shown in Figure 5B upper right panel. We pre-labelled monocytes with the green-fluorescent marker (CMFDA) and SMCs/EPCs with the red-fluorescent marker (CMTPX). The second harmonic imaging was used to display collagen fibres in TEBV wall. Monocytes attached to the endothelium and migrated on its surface were imaged and demonstrated as a montage in Figure 5A lower panel. Supplemental Movie 3 was a movie made from 3D-reconstructed image series to demonstrate the monocyte migration on the TEBV lumen. The monocyte migration speed and directionality were analysed and demonstrated in Figure 5C and the insert panel.
Inhibition of Leukocyte-Endothelium Interaction in TEBV
To explore if this model can be used for future drug testing, we used two anti-inflammatory drugs, TNF-α-neutralizing antibody and Bay-11-7082 (an NF-kB signalling pathway inhibitor), to attenuate the endothelium activation.16–18 Using the same cell-labelling scheme shown in Figure 5, the monocyte adhesion or TEM in the TNF-α activated TEBV was imaged in Figure 6A and documented in 6B. We first confirmed in the 2D model that both drugs could reduce the monocyte adhesion to the EC layer (Supplemental Figure 3). We selected the anti-TNF-α antibody at 10nM, or Bay-11-7082 at 1mM for the TEBV perfusion experiment. The anti-TNF-α significantly reduced the monocyte adhesion and TEM by 80.2% and 74.7%, (p<0.05) respectively; similarly, addition of Bay-11-7082 to the perfusion reduced the monocyte adhesion and TEM by 87.3% and 89.9% (p<0.05), respectively (Figure 6B).
Figure 6.
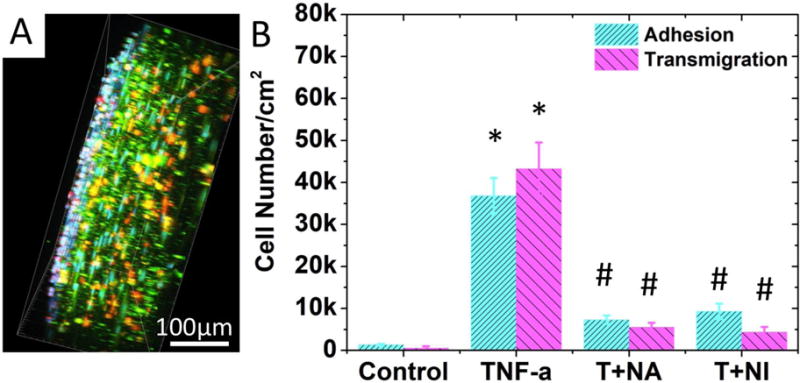
Effect of inflammatory cytokine and anti-inflammatory drugs on leukocyte-endothelium interactions. (A) A side view of the 3D-reconstructed two-photon confocal images in which monocytes attached to or transmigrated into activated TEBV endothelium in a TNF-α activated TEBV (perfused with medium containing TNF-α, 200U/mL, 4 hrs). B) Quantification of cell attachment and transmigration in TEBV with different treatments. TEBV was treated with i) Null, ii) 200U/mL TNF-α, iii) 200U/mL TNF-α + 20ng/mL TNF-α neutralizing antibody, and iv) 200U/mL TNF-α + 1μM Bay117082. N=4 for each group. Data are shown as mean ± SEM. Significance was determined by one-way ANOVA and Tukey’s post hoc test; * p<0.05 vs. number of cells adhered or transmigrated in control group, respectively; # p<0.05 vs. number of cells adhered or transmigrated in TNF-α treated group.
Discussion
The real-time observation of leukocyte behaviour in human blood vessel, which would be valuable for drug screening and disease modelling, has not been reported in the literature due to the difficulties of imaging such interactions. Although many different bioreactors for TEBV have been developed in the past, few of them are suitable for imaging. They are mostly made of Plexiglas with a thickness in millimetres, thus does not meet the working distance of most advanced microscopy objective.12–13 The opaqueness of TEBV is another challenge; the thick TEBV wall blocks the light penetration and prevents the cells deep in the wall of the TEBV from being illuminated and distinguished. In this work, we specially designed a PIC system to combine with two-photon microscopy to render the study of the TEBV lumen at the single cell level.
On one hand, this PIC imaging system can monitor the interactions between leukocytes and blood vessels under more biomimetic conditions than those in existing flow chamber-based leukocyte-adhesion assays. Flow chambers usually have endothelial cells cultured on glass or polystyrene, with a stiffness six orders of magnitude larger than that of physiological blood vessels. This difference in substrate stiffness could affect endothelial cell functions, leading to corresponding changes in leukocyte behaviour. Moreover, once transmigration occurs, the leukocytes will be trapped between the ECs and the solid chamber substrate and became flat (Figure 4), whereas leukocytes in real physiological conditions would infiltrate into tissue (Figure 6). 2D-flow chamber studies also lack 3D structured ECM, and the possible interactions among ECs, SMCs, and other cells. As a result, our model provides a more biomimetic microphysiological environment. These biomimetic features of the TEBV-PIC may be valuable for future use of TEBV as disease models, such as an inflammation model, or atherosclerosis model, which involves crosstalk among SMCs, ECs, leukocytes, and foam cells.2,19
On the other hand, the possibility of monitoring leukocyte perfusion (Figure 5A), adhesion, migration along the lumen, and transmigration (Figure 5B, 5C, Figure 6) in an TEBV offers researchers a tool to quantitatively measure and compare cell number in different inflammation conditions and/or with different drug treatment (Figure 6). This quantitative analysis of leukocyte number and behaviour has many important applications. Firstly, it could serve as a measure of biological signals that could not previously be easily detected. For instance, endothelial activation can be classified into different stages with different phenotypes at each stage.16–18 The adhesion and transmigration of leukocytes on ECs indicate Stage-II EC activation, which involves EC hypertrophy as well as expression and release of leukocyte adhesion proteins such as E-selectin, ICAM-1 and VCAM-1. The leukocyte number could serve as a marker to indicate the level of adhesive protein expression on EC. Secondly, the quantitative analysis of leukocyte number and behaviour could serve as an indicator/marker for drug efficacy. Anti-inflammatory drugs play an important role in treatment for immune system-related diseases such as arthritis, systemic lupus erythematous, and atherosclerosis.18 These drug treatment efficacies can now be evaluated quantitatively in vitro, as we demonstrated in Figure 6, demonstrated as reducing the monocytes adhesion and transmigration of leukocyte. The further study on the measurement of the number of attached and transmigrated leukocytes over time may provide important information on the pharmacodynamics of a drug (or a drug candidate) – when it starts to take effect as well as when it reaches maximum effect in blood vessels.
Conclusions
We have developed a TEBV perfusion and imaging system to monitor real-time the interactions of leukocytes with the vessel wall. This study paves the way for using TEBV as an important platform for modelling immune system-related vascular diseases and for screening drugs that can regulate the inflammation cascade in the vascular system.
Supplementary Material
Acknowledgments
This research was supported by NIH UH3TR000505 (NCATS and the NIH Common Fund for the Microphysiological Systems Initiative) and UG3TR002142 (NCATS and NIAMS).
Footnotes
Electronic Supplementary Information (ESI) available: [details of any supplementary information available should be included here]. See DOI: 10.1039/x0xx00000x
Conflicts of interest
There are no conflicts to declare
References
- 1.Vestweber D, Wessel F, Nottebaum AF. Semin Immunopathol. 2014;36:177. doi: 10.1007/s00281-014-0419-7. [DOI] [PubMed] [Google Scholar]
- 2.Tabas I, García-Cardeña G, Owens GK. J Cell Biol. 2015;209:13. doi: 10.1083/jcb.201412052. [DOI] [PMC free article] [PubMed] [Google Scholar]
- 3.Steyers CM, Miller FJ. Int J Mol Sci. 2014;15:11324. doi: 10.3390/ijms150711324. [DOI] [PMC free article] [PubMed] [Google Scholar]
- 4.Cedervall J, Dimberg A, Olsson AK. Mediators Inflamm. 2015:418290. doi: 10.1155/2015/418290. [DOI] [PMC free article] [PubMed] [Google Scholar]
- 5.Machida H, Tanaka I, Fukui R, Shen Y, Ishikawa T, Tate E, Ueno E. RadioGraphics. 2015;35:991. doi: 10.1148/rg.2015140181. [DOI] [PubMed] [Google Scholar]
- 6.Stucht D, Danishad KA, Schulze P, Godenschweger F, Zaitsev M, Speck O. PLOS ONE. 2015;10:e0133921. doi: 10.1371/journal.pone.0133921. [DOI] [PMC free article] [PubMed] [Google Scholar]
- 7.Zhang WJ, Liu W, Cui L, Cao Y. J Cell Mol Med. 2007;11:945. doi: 10.1111/j.1582-4934.2007.00099.x. [DOI] [PMC free article] [PubMed] [Google Scholar]
- 8.Fernandez CE, Achneck HE, Reichert WM, Truskey GA. Curr Opin Chem Eng. 2014;3:83. doi: 10.1016/j.coche.2013.12.001. [DOI] [PMC free article] [PubMed] [Google Scholar]
- 9.Seifu DG, Purnama A, Mequanint K, Mantovani D. Nat Rev Cardiol. 2013;10:410. doi: 10.1038/nrcardio.2013.77. [DOI] [PubMed] [Google Scholar]
- 10.L’Heureux N, Pâquet S, Labbé R, Germain L, Auger FA. FASEB J Off Publ Fed Am Soc Exp Biol. 1998;12:47. doi: 10.1096/fasebj.12.1.47. [DOI] [PubMed] [Google Scholar]
- 11.Gui L, Dash BC, Luo J, Qin L, Zhao L, Yamamoto K, Hashimoto T, Wu H, Dardik A, Tellides G, Niklason LE, Qyang Y. Biomaterials. 2016;102:120. doi: 10.1016/j.biomaterials.2016.06.010. [DOI] [PMC free article] [PubMed] [Google Scholar]
- 12.Ji H, Atchison L, Chen Z, Chakraborty S, Jung Y, Truskey GA, Christoforou N, Leong KW. Biomaterials. 2016;85:180. doi: 10.1016/j.biomaterials.2016.01.066. [DOI] [PMC free article] [PubMed] [Google Scholar]
- 13.Jung Y, Ji H, Chen Z, Chan H Fai, Atchison L, Klitzman B, Truskey G, Leong KW. Sci Rep. 2015;5:15116. doi: 10.1038/srep15116. [DOI] [PMC free article] [PubMed] [Google Scholar]
- 14.Robert J, Weber B, Frese L, Emmert MY, Schmidt D, von Eckardstein A, Rohrer L, Hoerstrup SP. PloS One. 2013;8:e79821. doi: 10.1371/journal.pone.0079821. [DOI] [PMC free article] [PubMed] [Google Scholar]
- 15.Zhang J, DeFelice AF, Hanig JP, Colatsky T. Toxicol Pathol. 2010;38:856. doi: 10.1177/0192623310378866. [DOI] [PubMed] [Google Scholar]
- 16.Bach FH, Hancock WW, Ferran C. Immunol Today. 1997;18:483. doi: 10.1016/s0167-5699(97)01129-8. [DOI] [PubMed] [Google Scholar]
- 17.Mestas J, Ley K. Trends Cardiovasc Med. 2008;18:228. doi: 10.1016/j.tcm.2008.11.004. [DOI] [PMC free article] [PubMed] [Google Scholar]
- 18.Nakazawa G, Yazdani SK, Finn AV, Vorpahl M, Kolodgie FD, Virmani R. J Am Coll Cardiol. 2010;55:1679. doi: 10.1016/j.jacc.2010.01.021. [DOI] [PubMed] [Google Scholar]
- 19.Micol LA, Ananta M, Engelhardt EM, Mudera VC, Brown RA, Hubbell JA, Frey P. Biomaterials. 2011;32:1543. doi: 10.1016/j.biomaterials.2010.10.028. [DOI] [PubMed] [Google Scholar]
Associated Data
This section collects any data citations, data availability statements, or supplementary materials included in this article.


