Abstract
Background
The spliceosomal transfer of a short spliced leader (SL) RNA to an independent pre-mRNA molecule is called SL trans-splicing and is widespread in the nematode Caenorhabditis elegans. While RNA-sequencing (RNA-seq) data contain information on such events, properly documented methods to extract them are lacking.
Findings
To address this, we developed SL-quant, a fast and flexible pipeline that adapts to paired-end and single-end RNA-seq data and accurately quantifies SL trans-splicing events. It is designed to work downstream of read mapping and uses the reads left unmapped as primary input. Briefly, the SL sequences are identified with high specificity and are trimmed from the input reads, which are then remapped on the reference genome and quantified at the nucleotide position level (SL trans-splice sites) or at the gene level.
Conclusions
SL-quant completes within 10 minutes on a basic desktop computer for typical C. elegans RNA-seq datasets and can be applied to other species as well. Validating the method, the SL trans-splice sites identified display the expected consensus sequence, and the results of the gene-level quantification are predictive of the gene position within operons. We also compared SL-quant to a recently published SL-containing read identification strategy that was found to be more sensitive but less specific than SL-quant. Both methods are implemented as a bash script available under the MIT license [1]. Full instructions for its installation, usage, and adaptation to other organisms are provided.
Keywords: NGS, RNA-seq, maturation, trans-splicing, sequence analysis
Background
The capping, splicing, and polyadenylation of eukaryotic pre-mRNAs are well-studied maturation processes that are essential for proper gene expression in eukaryotes [2]. Much less is known about spliced leader (SL) trans-splicing, a process by which a capped small nuclear RNA called spliced leader is spliced onto the 5’ end of a pre-mRNA molecule, substituting for canonical capping [3] (Fig. 1A). SL trans-splicing has a patchy phylogenetic distribution ranging from protists [4] to bilaterian metazoans, including nematodes, rotifers [5], and even chordates [6]. It appears not conserved in mammals, although “non-SL” trans-splicing events—when exons from two different RNA transcripts are spliced together—have been detected at low frequency [7]. In contrast, SL trans-splicing is widespread in the Caenorhabditis elegans nematode where there are two classes of SL, SL1 and SL2, which trans-splice about 70% of the mRNA transcripts. Strikingly, the SL2 trans-splicing is highly specific for genes in position two and over within operons that range from two to eight genes expressed from a single promoter [8].
Figure 1:
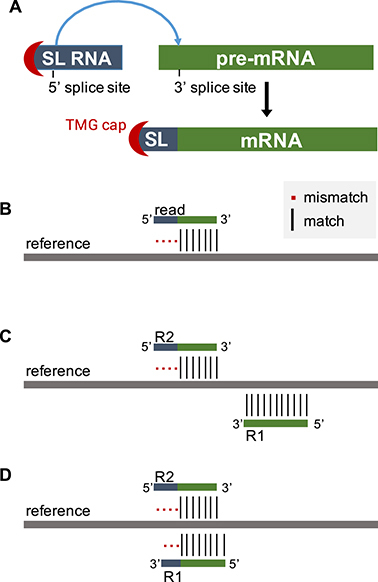
Trans-splicing and RNA-seq. (A) The trans-splicing process. Splice leader RNA precursors (SL RNA) are small nuclear RNAs capped with a trimethyl-guanosine (TMG). The 5’-region of the SL RNA, including the TMG cap, is spliced on the first exon of the pre-mRNAs. (B) Reads originating from trans-spliced RNA fragments do not map end-to-end to the reference genome. (C) The left-most read (R2) of a read pair does not map end-to-end to the reference. (D) Special case when the paired-end reads “dovetail” and both reads do not map end-to-end to the reference due to the SL sequence.
While the function of SL trans-splicing begins to be elucidated [9], its regulation remains unclear. To study this question, two main strategies have been proposed to exploit RNA-sequencing (RNA-seq) data in order to quantify SL trans-splicing. The first one involves the mapping of the reads to a complex database containing all the possible trans-spliced gene models [10, 11]. The creation of such a database requires the in silico trans-splicing of every SL sequence isoform (12 in C. elegans) to all the putative trans-splice sites predicted for a gene. In contrast, the second strategy does not rely on trans-splice site annotation or prediction. Instead, the SL sequences are directly identified in reads partially mapped to the genome or transcriptome [12-14]. However, no implementation of these methods is directly available, which prompted us to develop, test, and optimize SL-quant, a ready-to-use pipeline that applies the second strategy to rapidly quantify SL trans-splicing events from RNA-seq data.
Pipeline overview
In order to search for SL sequences in a limited number of reads, only unmapped reads are used as input for SL-quant, assuming that reads containing the SL sequence (or the 3’ end of it) would not map on the reference genome or transcriptome (Fig. 1B). This implies that a first round of mapping must precede the use of SL-quant. It must be performed end-to-end in order to guarantee that reads originating from trans-spliced RNA fragments do not map. In addition to this specification, any bam file containing unmapped reads can be fed into SL-quant, making it particularly well suited for subsequent analyses of previously generated data.
In the case paired-end reads are available, only the unmapped reads originating from the left-most ends of the fragments are considered. In addition, we developed an optimized paired-end mode (-p –paired option) that further limits the search for SL-containing reads by filtering out the unmapped reads whose mates are also unmapped. This assumes that only the left-most read of a pair originating from a trans-spliced fragment would not map due to the SL sequence while the other one would map (Fig. 1C). This is generally true unless the fragment is so small that the mates significantly overlap with each other (Fig. 1D).
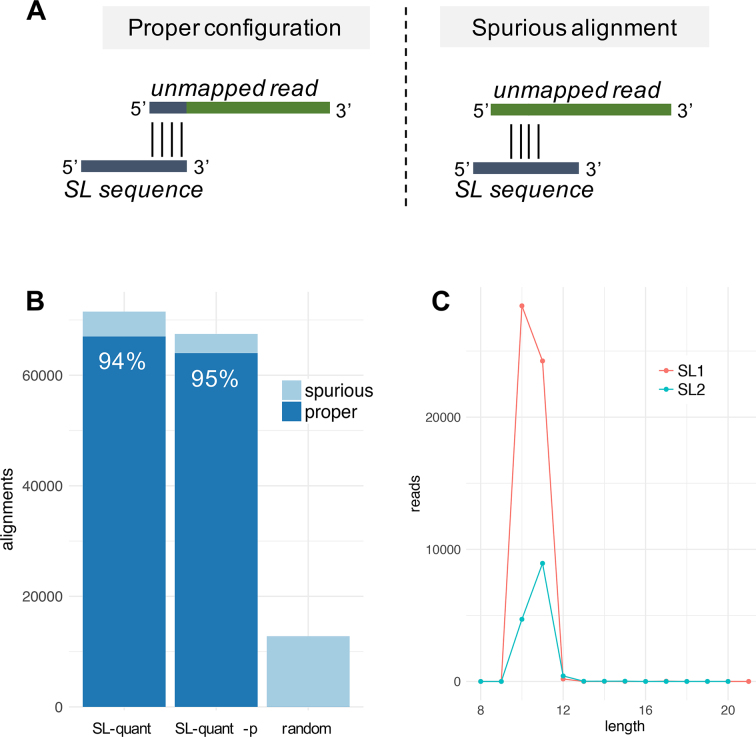
To identify SL trans-splicing events, the input reads are aligned locally to the SL sequences with Basic Local Alignment Search Tool (BLAST) [15]. Reads whose 5’ end belongs to a significant alignment (e-value <5%) that covers the 3΄ end of the SL sequence (Fig. 2A, left panel) are considered SL-containing reads. Then, the SL-containing reads are trimmed of the SL sequence (based on the length of the BLAST alignment) and mapped back on the C. elegans genome with HISAT2 [16]. Finally, the remapped reads are counted at the gene level with featureCounts [17] to obtain a quantification of the SL1 and SL2 trans-splicing events per genes.
Figure 2:
Configuration of the BLAST alignments. (A) InSL-quant, the BLAST alignments are considered as properly configured if starting from the 5’ end of the unmapped read and ending at the 3’ end of the SL sequence. (B) Proportion of properly configured alignments out of the significant alignment identified by SL-quant in single and paired-end (-p) mode on the SRR1585277 dataset, or on 106 random reads in single-end mode. (C) Number of properly configured significant alignments found by SL-quant on the SRR1585277 dataset (single-end mode) by alignment length on the SL1 or SL2 sequences.
SL-containing reads identification
We tested SL-quant on the single-end modENCODE_4594 [18] dataset (2.5 × 10⁶ unmapped reads) and the paired-end SRR1585277 [19] dataset (1.3 × 10⁶ unmapped left reads) using a desktop computer with basic specifications. Every run was completed within 10 minutes using four threads, with a processing rate of about 106 unmapped reads by 5 minutes.
In order to assess the specificity of the BLAST alignments, we reasoned that reads originating from a trans-spliced RNA would align to the 3’ end of the SL sequence from their 5’ end, while random alignment would start anywhere (Fig. 2A). The fact that 94% of significant alignments were in that specific configuration indicates good specificity (Table 1 and Fig. 2B). In contrast, we obtained less than 0.3% with randomly generated reads. In paired-end mode, fewer alignments were found, but a slightly higher proportion of them (95%) were in proper configuration and considered SL-containing reads. This was expected given the more stringent prefiltering implemented in that mode. When considering only the nonsignificant alignments, we obtained intermediate proportions of proper configuration (15%–20%), suggesting that most, but not all, of those nonsignificant alignments were spurious.
Table 1:
Identification of SL-containing reads by SL-quant
| Significant alignments | Nonsignificant alignments | ||||||
|---|---|---|---|---|---|---|---|
| Dataset | Method | Total reads | Input reads | Total | Properly configured | Total | Properly configured |
| SRR1585277 | SL-quant | 40 × 106 | 1.3 × 10⁶ | 71, 512 | 67,021 (94%) | 70 211 | 10,359 (15%) |
| SL-quant -p | 40 × 106 | 0.9 × 10⁶ | 67, 463 | 64,010 (95%) | 47 596 | 9,849 (21%) | |
| modENCODE_4594 | SL-quant | 30 × 106 | 2.5 × 10⁶ | 168, 351 | 158,529 (94%) | 100 139 | 20,417 (20%) |
| random | SL-quant | 1 × 10⁶ | 1.0 × 10⁶ | 12, 788 | 36 (0.3%) | 43 501 | 83 (0.2%) |
SL-containing reads are defined as reads with significant and properly configured alignment to the SL sequences (sixth column).
Despite the C. elegans SL sequences being 22 nucleotides (nt) long, most alignments cover them on only 10–11 nt (Fig. 2C), with a preference for 10 nt alignment for SL1-containing reads and 11 nt alignments for SL2-containing reads. This could be caused by reverse transcriptase drop-off during the library preparation due to secondary structure and the proximity of the hypermethylated cap at the 5’ end of the SL. Moreover, in classic RNA-seq library preparation protocols, the second-strand synthesis is primed by RNA oligonucleotides generated by the digestion of the RNA-DNA duplex obtained after the first strand synthesis. This results in truncated dsDNA fragments that do not preserve the 5’ end of the original RNA fragments [20].
SL trans-splice sites identification
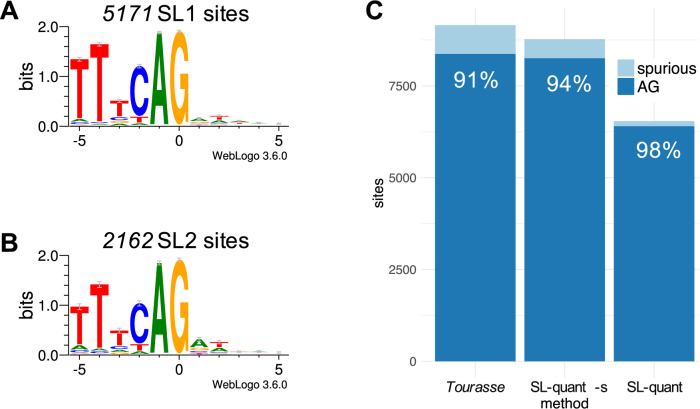
While we designed SL-quant with the idea of quantifying SL trans-splicing events by gene, it is also possible to use it to identify the 3’ trans-splice sites at single-nucleotide resolution. SL trans-splice sites are known to display the same UUUCAG consensus as cis-splice sites [21], which could be verified with our method (Fig. 3A, 3B). Previous work described a significant switch from A to G after consensus sequence (position +1) for the SL1 trans-splice sites compared to SL2 trans-splice sites [21]. At that position, we observed a decreased preference for A for the SL1 trans-splice sites, but no significant enrichment in G. This discrepancy could be due to the fact that we identified (and included in the consensus) about 20 times more SL1 trans-splice sites than previously reported.
Figure 3:
SL-sites consensus sequence. (A) Sequence logo of the sequence environment surrounding SL1 or (B) SL2 trans-splice sites determined by SL-quant on the SRR1585277 dataset in single-end mode. (C) Proportion of AG sequences in SL trans-splice sites identified by SL-quant on the SRR1585277 dataset with the method used in Tourasse et al. 2017 [14] and with SL-quant in single-end mode with or without the sensitive option (-s).
As SL trans-splice sites (and splice sites in general) contain an almost invariant AG sequence, we reasoned that non-AG splice sites were potential “spurious” trans-splice sites. In order to assess the performances of our method, we considered identified sites bearing the “AG” consensus as true positives (TPs). Reciprocally, we considered any other sites identified as false positives (FPs), although we cannot completely exclude the existence of nonconsensus splice sites. These reasonable approximations allow us to characterize our method despite not knowing the ground truth. Indicating excellent specificity (ability to exclude FP), 98% of the sites identified by SL-quant display the AG consensus, regardless of the mode used (single or paired) and the dataset studied (Table 2).
Table 2:
Performances of SL-quant with various parameters.
| Dataset | Method | Run time | Mapped SL-containing reads | Trans-splice sites | Site is “AG” consensus (%) |
|---|---|---|---|---|---|
| SRR1585277 | SL-quant | 4 minutes 02 seconds | 65,126 | 6,301 | 6,149 (98) |
| SL-quant -p | 5 minutes 14 seconds | 61,451 | 6,539 | 6,402 (98) | |
| SL-quant -s | 2 minutes 45 seconds | 120,542 | 8,770 | 8,254 (94) | |
| SL-quant -s -p | 6 minutes 58 seconds | 114,948 | 8,436 | 7,957 (94) | |
| Tourasse | 4 minutes 45 seconds | 120,710 | 8,932 | 8,260 (92) | |
| modENCODE_4594 | SL-quant | 9 minutes 51 seconds | 146,358 | 8,247 | 8,081 (98) |
| SL-quant -s | 3 minutes 10 seconds | 258,706 | 10,735 | 9,948 (93) | |
| Tourasse | 5 minutes 08 seconds | 259,284 | 11,155 | 9,953 (89) | |
| random | SL-quant | 3 minutes 20 seconds | 53 | 52 | 34 (65) |
| SL-quant -s | 1m23s | 5,757 | 5,692 | 5,612 (99 a) | |
| Tourasse | 2m24s | 8,890 | 8,777 | 5,612 (64) |
The very high proportion of “AG” sites for the random dataset is an artifact caused by the fact that the reads were generated from randomly sampling the genome and that all the C. elegans SL sequences end by AG. -p: paired-end mode; -s: sensitive mode.
Comparison with a previous method
We also compared our method with a re-implementation of the SL-containing read identification strategy previously reported [14]. Briefly, the unmapped reads whose 5’ end align to the SL sequences (or their reverse complement) on at least 5 nt with at most 10% mismatch are considered SL-containing reads. The alignment is realized with cutadapt [22] that directly trims the SL sequences from the unmapped reads so they can be remapped to the genome.
Compared to SL-quant, this conceptually similar method was faster and identified almost twice the number of SL-containing reads from the real datasets and 150 times the number of SL-containing reads from random reads (Table 2). More splice-sites were identified, but the proportion of spurious (nonconsensus) trans-splice sites increased almost 5-fold (Fig. 3C).
The method developed in [14] has a higher detection power but appears less specific than SL-quant. Nevertheless, we consider it an interesting option for applications requiring more sensitivity (ability to detect TP) than specificity. Therefore, we decided to re-implement it within SL-quant as an [-s –sensitive] option with the following enhancement:
The input reads, if strand specific, are aligned to the SL sequences only (not their reverse complement).
With paired-end data in single-end mode, only the left-most unmapped reads are considered as input.
With paired-end data in paired-end mode, only the left-most unmapped reads whose mates are mapped are considered as input.
These modifications significantly improved the specificity of the method (although not to the level of SL-quant), with almost no compromise on sensitivity regarding SL trans-splice site detection (Fig. 3C) or SL-containing read identification (Table 2).
Gene-level quantification
Finally, we tested SL-quant for its ability to predict gene position within operons as SL2-trans-splicing is the best predictor of transcription initiated upstream of another gene [11] (Fig. 4A). Using the ratio of SL2/(SL1 + SL2) from the SL-quant output as a predictor of gene positions in operons, receiver operating characteristic curve analysis reveals a high TP rate (>90%) at a 5% false discovery rate threshold, regardless of SL-quant options (Fig. 4B). However, when tolerating more FPs, SL-quant in sensitive mode is a superior predictor.
Figure 4:
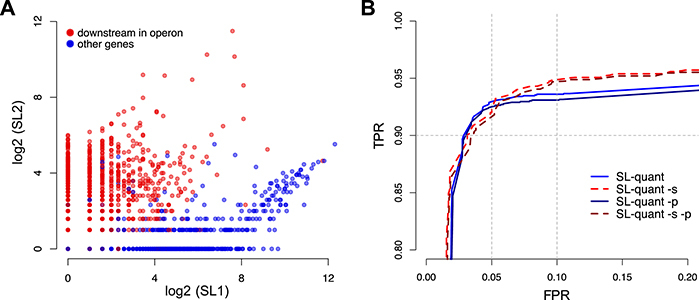
Prediction of gene position in operons. (A) Number of SL1 and SL2 trans-splicing events by genes as calculated using SL-quant. Genes annotated as downstream in the operons are represented as red dots. (B) Receiver operating characteristic curve analysis using the SL2/(SL1 + SL2) ratio as a predictor of downstream position in operons for the 5,521 genes with at least one trans-splicing event detected. The number of SL1 and SL2 trans-splicing events by genes was calculated using SL-quant in single or paired (-p) mode, with or without the sensitive (-s) option. TPR: true-positive rate, FPR: false-positive rate.
Conclusion
In summary, SL-quant is able to rapidly and accurately quantify trans-splicing events from RNA-seq data. It comes as a well-documented and ready-to-use pipeline in which two main options were implemented to fit the type of input data and the intended usage of the quantification (Fig. 5). Importantly, this work provides a way to test and validate SL trans-splicing quantification methods that might serve as a baseline for future development of such methods.
Figure 5:
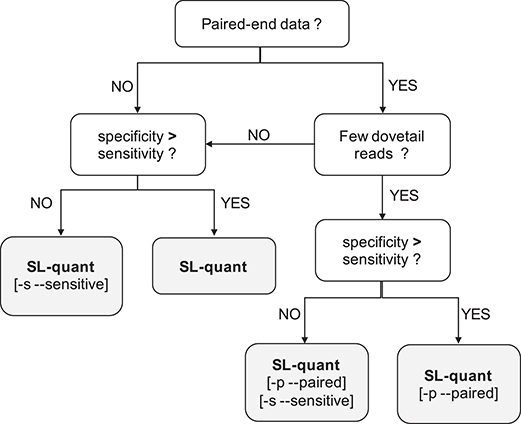
Recommendations on SL-quant usage. [-s –sensitive]: it provides increased detection power at the cost of some specificity and it is significantly faster. It is not recommended for applications that are very sensitive to FPs (e.g., trans-splice sites detection) but is an interesting option otherwise (e.g., gene-level quantification of SL trans-splicing events). [-p –paired]: a more stringent prefiltering reduces the number of reads aligned to the SL sequences. It can only be used with paired-end reads. It is not recommended when the average fragment size is small (many “dovetail” reads). It can be used in combination with the [-s –sensitive] option.
Recently, the hypothesis that the SL trans-splicing mechanism originates from the last eukaryotic common ancestor has been proposed to explain its broad phylogenetic distribution [23]. Given the number of applicable species, the continuously decreasing cost of RNA-seq experiments, and the thinner line between model and nonmodel organisms, it is likely that the SL trans-splicing will be studied in a growing number of species. Therefore, a procedure to adapt SL-quant to species other than C. elegans, requiring only a few steps, is detailed online. As a proof of concept, we successfully applied SL-quant to six additional RNA-seq libraries from five species (Table 3). In the near future, we anticipate that the application of SL-quant to various datasets might become instrumental in unveiling trans-splicing regulation in the model organism C. elegans and other organisms.
Table 3:
SL-quant can be applied to a wide range of datasets from various species, with varying read length and made with various library preparation protocols.
| Organism | Dataset | Read length (nt) | Total reads | Input reads | Mapped SL-containing reads | Trans-splice sites (% AG) |
|---|---|---|---|---|---|---|
| Caenorhabditis elegans | SRR1585277 | 76 | 40 × 106 | 1.3 × 10⁶ | 120,542 | 8,770 (94) |
| modENCODE_4594 | 76 | 30 × 106 | 2.5 × 10⁶ | 258,706 | 10,735 (93) | |
| SRR2832497 (*) | 41 | 4 × 10⁶ | 1.8 × 10⁶ | 16,307 | 4,882 (87) | |
| Caenorhabditis briggsae | SRR440441 | 42 | 11 × 106 | 5.7 × 10⁶ | 117,738 | 8,382 (93) |
| SRR440557 | 42 | 12 × 106 | 4.8 × 10⁶ | 176,205 | 11,495 (92) | |
| Caenorhabditis brenneri | modENCODE_4705 | 76 | 4 × 10⁶ | 0.4 × 10⁶ | 74,689 | 8,891 (97) |
| Caenorhabditis remanei | modENCODE_4206 | 76 | 9 × 10⁶ | 1.8 × 10⁶ | 248,335 | 11,223 (92) |
| Trypanosoma brucei | SRR038724 | 35 | 8 × 10⁶ | 2.2 × 10⁶ | 40,320 | 6,703 (89) |
The datasets modENCODE_4594, SRR2832497, and SRR038724 are single end, the others are paired. The asterisk (*) for the SRR2832497 denotes that the second-strand synthesis was made using a ligation-based protocol instead of the classic random priming protocol. All datasets were analyzed with the same SL-quant parameters: single-end mode with the -s –sensitive option
Methods
We ran SL-quant with four threads (default) on the modENCODE_4594, modENCODE_4705, modENCODE_4206 [18], SRR2832497 [24], SRR440441, SRR440557 [25], SRR038724 [26], and SRR1585277 [19] poly-A + datasets using a desktop computer with a 2.8-GHz processor and 8 GB random access memory. The C. elegans, C. briggsae, C. brenneri, and C. remanei reference genome and annotation (WS262) were downloaded from wormbase [27]. The T. brucei reference genome and annotation (Apr_2005 version) were downloaded from Ensembl [28]. The read mapping steps prior to using SL-quant and at the end of the pipeline were performed using HISAT2 [16] (v 2.0.5) with parameters –no-softclip –no-discordant –min-intronlen 20 –max-intronlen 5000. As we noticed adaptor contamination in the modENCODE_4594 dataset, trimmomatic [29] (v 0.36) was used to trim them off prior to the mapping. Samtools [30] (v 1.5), picard [31] (v 2.9), and bedtools [32] (v 2.26) were used to convert and/or filter the reads at various stages of the pipeline. BLAST+ (v 2.6) [15] was used to align the reads locally to the relevant SL sequences [33, 34] with parameter -task blastn -word_size 8 max_target_seqs 1. Alternatively, cutadapt (v 1.14) [22] was used to directly trim the SL sequences from the reads with parameters -O 5 -m 15 –discard-untrimmed. FeatureCounts [17] was used to summarize re-mapped SL-containing reads at the gene level. Bedtools [32] was used to summarize mapped SL-containing reads at the genomic position level and to generate random reads by randomly sampling the C. elegans genome for 50-nt segments. Sequence logo were made with weblogo [35]. Finally, R [36] (v 3.4) was used for analyzing and visualizing the data.
Availability of source code and requirements
Project name: SL-quant
Project home page: https://github.com/cyaguesa/SL-quant
Operating system(s): UNIX-based systems (tested on macOS 10.12.6, macOS 10.11.6, Ubuntu 14.04)
Programming language: Shell, R
Other requirements: The BLAST+ suite (2.6.0 or higher), samtools (1.5 or higher), picard-tools (2.9.0 or higher), featureCounts from the subread package. (1.5.0 or higher), bedtools (2.26.0 or higher), cutadapt (1.14 or higher), hisat2 (2.0.5 or higher). Installation instruction for those requirements is provided online.
License: MIT
Supplementary Material
5/20/2018 Reviewed
6/8/2018 Reviewed
05/22/2018 Reviewed
6/16/2018 Reviewed
22 May 2018 Reviewed
6/12/2018 Reviewed
ACKNOWLEDGEMENTS
We thank Olivier Finet and Fanélie Bauer for critical reading of the manuscript.
Availability of supporting data
The datasets supporting the results presented here are available in the modMine or the European Nucleotide Archive (ebi-ENA) repositories, under the identifiers modENCODE_4594, modENCODE_4705, modENCODE_4206, SRR1585277, SRR2832497, SRR440441, SRR440557, SRR038724. Snapshots of the code and other supporting data are available in the GigaScience repository, GigaDB [1].
Additional file
Figure S1. (A) Number of properly oriented significant alignments found by SL-quant on the SRR2832497 dataset (single-end mode) by alignment length on the SL1 or SL2 sequences. (B) Number of properly oriented significant alignments found by with the method used in Tourasse et al, 2017 on the SRR1585277 dataset by alignment length on the SL1 or SL2 sequences.
Abbreviations
BLAST: Basic Local Alignment Search Tool; FP: false positive; nt: nucleotide; RNA-seq: RNA sequencing; SL: spliced leader; TP: true positive.
Competing interests
The authors declare that they have no competing interests.
Funding
This work was supported by the Fond National pour la Recherche Scientifique - Fond pour la formation à la Recherche dans l'Industrie et dans l'Agriculture (FNRS-FRIA).
Author contributions
C.Y. designed, implemented, and tested the pipeline. D.H. and C.Y. wrote the manuscript. D.H. supervised the project.
References
- 1. Yague-Sanz C, Hermand D. Supporting data for “SL-quant: a fast and flexible pipeline to quantify spliced leader trans-splicing events from RNA-seq data.” GigaScience Database. 2018. 10.5524/100477. [DOI] [PMC free article] [PubMed]
- 2. Bentley DL. Coupling mRNA processing with transcription in time and space. Nat Rev Genet. 2014;15(3):163–75. [DOI] [PMC free article] [PubMed] [Google Scholar]
- 3. Blumenthal T. Trans-splicing and operons in C. elegans. WormBook. 2012:1–11.. doi:10.1895/wormbook.1.5.2. [DOI] [PMC free article] [PubMed] [Google Scholar]
- 4. Michaeli S. Trans-splicing in trypanosomes: machinery and its impact on the parasite transcriptome. Future Microbiol. 2011;6(4):459–74. [DOI] [PubMed] [Google Scholar]
- 5. Pouchkina-Stantcheva NN, Tunnacliffe A. Spliced leader RNA-mediated trans-splicing in phylum Rotifera. Mol Biol Evol. 2005;22(6):1482–9. [DOI] [PubMed] [Google Scholar]
- 6. Vandenberghe AE, Meedel TH, Hastings KE. mRNA 5'-leader trans-splicing in the chordates. Genes & Development. 2001;15(3):294–303. [DOI] [PMC free article] [PubMed] [Google Scholar]
- 7. Mangul S, Yang HT, Strauli N, et al. . ROP: dumpster diving in RNA-sequencing to find the source of 1 trillion reads across diverse adult human tissues. Genome Biol. 2018;19(1):36. [DOI] [PMC free article] [PubMed] [Google Scholar]
- 8. Blumenthal T, Evans D, Link CD, et al. . A global analysis of Caenorhabditis elegans operons. Nature. 2002;417(6891):851–4. [DOI] [PubMed] [Google Scholar]
- 9. Yang YF, Zhang X, Ma X, et al. . Trans-splicing enhances translational efficiency in C. elegans. Genome Res. 2017;27(9):1525–35. [DOI] [PMC free article] [PubMed] [Google Scholar]
- 10. Hillier LW, Reinke V, Green P et al. . Massively parallel sequencing of the polyadenylated transcriptome of C. elegans. Genome Res. 2009;19(4):657–66. [DOI] [PMC free article] [PubMed] [Google Scholar]
- 11. Allen MA, Hillier LW, Waterston RH, et al. . A global analysis of C. elegans trans-splicing. Genome Res. 2011;21(2):255–64. [DOI] [PMC free article] [PubMed] [Google Scholar]
- 12. Maxwell CS, Antoshechkin I, Kurhanewicz N, et al. . Nutritional control of mRNA isoform expression during developmental arrest and recovery in C. elegans. Genome Res. 2012;22(10):1920–9. [DOI] [PMC free article] [PubMed] [Google Scholar]
- 13. Boeck ME, Huynh C, Gevirtzman L, et al. . The time-resolved transcriptome of C. elegans. Genome Res. 2016;26(10):1441–50. [DOI] [PMC free article] [PubMed] [Google Scholar]
- 14. Tourasse NJ, Millet JRM, Dupuy D. Quantitative RNA-seq meta-analysis of alternative exon usage in C. elegans. Genome Res. 2017;27(12):2120–8. [DOI] [PMC free article] [PubMed] [Google Scholar]
- 15. Camacho C, Coulouris G, Avagyan V et al. . BLAST+: architecture and applications. BMC Bioinformatics. 2009;10:421. [DOI] [PMC free article] [PubMed] [Google Scholar]
- 16. Kim D, Langmead B, Salzberg SL. HISAT: a fast spliced aligner with low memory requirements. Nat Methods. 2015;12(4):357–60. [DOI] [PMC free article] [PubMed] [Google Scholar]
- 17. Liao Y, Smyth GK, Shi W. featureCounts: an efficient general purpose program for assigning sequence reads to genomic features. Bioinformatics. 2014;30(7):923–30. [DOI] [PubMed] [Google Scholar]
- 18. Gerstein MB, Lu ZJ, Van Nostrand EL, et al. . Integrative analysis of the Caenorhabditis elegans genome by the modENCODE project. Science. 2010;330(6012):1775–87. [DOI] [PMC free article] [PubMed] [Google Scholar]
- 19. Kosmaczewski SG, Edwards TJ, Han SM et al. . The RtcB RNA ligase is an essential component of the metazoan unfolded protein response. EMBO Rep. 2014;15(12):1278–85. [DOI] [PMC free article] [PubMed] [Google Scholar]
- 20. Agarwal S, Macfarlan TS, Sartor MA, et al. . Sequencing of first-strand cDNA library reveals full-length transcriptomes. Nat Commun. 2015;6:6002. [DOI] [PMC free article] [PubMed] [Google Scholar]
- 21. Graber JH, Salisbury J, Hutchins LN, et al. . C. elegans sequences that control trans-splicing and operon pre-mRNA processing. RNA. 2007;13(9):1409–26. [DOI] [PMC free article] [PubMed] [Google Scholar]
- 22. Martin M. Cutadapt removes adapter sequences from high-throughput sequencing reads. EMBnet journal. 2011;17(1):10–12. [Google Scholar]
- 23. Krchnakova Z, Krajcovic J, Vesteg M. On the possibility of an early evolutionary origin for the spliced leader Trans-Splicing. J Mol Evol. 2017;85(1–2):37–45. [DOI] [PubMed] [Google Scholar]
- 24. Ni JZ, Kalinava N, Chen E, et al. . A transgenerational role of the germline nuclear RNAi pathway in repressing heat stress-induced transcriptional activation in C. elegans. Epigenetics Chromatin. 2016;9:3. [DOI] [PMC free article] [PubMed] [Google Scholar]
- 25. Uyar B, Chu JS, Vergara IA, et al. . RNA-seq analysis of the C. briggsae transcriptome. Genome Res. 2012;22(8):1567–80. [DOI] [PMC free article] [PubMed] [Google Scholar]
- 26. Kolev NG, Franklin JB, Carmi S et al. . The transcriptome of the human pathogen Trypanosoma bruceiat single-nucleotide resolution. PLoS Pathog. 2010;6(9):e1001090. [DOI] [PMC free article] [PubMed] [Google Scholar]
- 27. Stein L, Sternberg P, Durbin R, et al. . WormBase: network access to the genome and biology of Caenorhabditis elegans. Nucleic Acids Res. 2001;29(1):82–6. [DOI] [PMC free article] [PubMed] [Google Scholar]
- 28. Kersey PJ, Allen JE, Allot A et al. . Ensembl Genomes 2018: an integrated omics infrastructure for non-vertebrate species. Nucleic Acids Res. 2018;46(D1):D802–D8. [DOI] [PMC free article] [PubMed] [Google Scholar]
- 29. Bolger AM, Lohse M, Usadel B. Trimmomatic: a flexible trimmer for Illumina sequence data. Bioinformatics. 2014;30(15):2114–20. [DOI] [PMC free article] [PubMed] [Google Scholar]
- 30. Li H, Handsaker B, Wysoker A et al. . The Sequence Alignment/Map format and SAMtools. Bioinformatics. 2009;25(16):2078–9. [DOI] [PMC free article] [PubMed] [Google Scholar]
- 31. Picard: A set of command line tools for manipulating high-troughput sequencing data. http://broadinstitute.github.io/picard. Accessed on 13 Jul 2018.
- 32. Quinlan AR. BEDTools: The Swiss-Army tool for genome feature analysis. Curr Protoc Bioinformatics. 2014;47:11.12.1–34. [DOI] [PMC free article] [PubMed] [Google Scholar]
- 33. Guiliano DB, Blaxter ML. Operon conservation and the evolution of trans-splicing in the phylum Nematoda. PLos Genet. 2006;2(11):e198. [DOI] [PMC free article] [PubMed] [Google Scholar]
- 34. Bitar M, Boroni M, Macedo AM et al. . The spliced leader trans-splicing mechanism in different organisms: molecular details and possible biological roles. Front Genet. 2013;4:199. [DOI] [PMC free article] [PubMed] [Google Scholar]
- 35. Crooks GE, Hon G, Chandonia JM, et al. . WebLogo: a sequence logo generator. Genome Res. 2004;14(6):1188–90. [DOI] [PMC free article] [PubMed] [Google Scholar]
- 36. R Core Team. R: A Language and Environment for Statistical Computing. Vienna, Austria: R Foundation for Statistical Computing, 2017. [Google Scholar]
Associated Data
This section collects any data citations, data availability statements, or supplementary materials included in this article.
Supplementary Materials
5/20/2018 Reviewed
6/8/2018 Reviewed
05/22/2018 Reviewed
6/16/2018 Reviewed
22 May 2018 Reviewed
6/12/2018 Reviewed


