

Abstract
Background
Treatment for depressive disorders often requires subsequent interventions. Patients who do not respond to antidepressants have treatment‐resistant depression (TRD). Predicting who will develop TRD may help healthcare providers make more effective treatment decisions. We sought to identify factors that predict TRD in a real‐world setting using claims databases.
Methods
A retrospective cohort study was conducted in a US claims database of adult subjects with newly diagnosed and treated depression with no mania, dementia, and psychosis. The index date was the date of antidepressant dispensing. The outcome was TRD, defined as having at least three distinct antidepressants or one antidepressant and one antipsychotic within 1 year after the index date. Predictors were age, gender, medical conditions, medications, and procedures 1 year before the index date.
Results
Of 230,801 included patients, 10.4% developed TRD within 1 year. TRD patients at baseline were younger; 10.87% were between 18 and 19 years old versus 7.64% in the no‐TRD group, risk ratio (RR) = 1.42 (95% confidence interval [CI] 1.37–1.48). TRD patients were more likely to have an anxiety disorder at baseline than non‐TRD patients, RR = 1.38 (95% CI 1.35–1.14). At 3.68, fatigue had the highest RR (95% CI 3.18–4.25). TRD patients had substance use disorders, psychiatric conditions, insomnia, and pain more often at baseline than non‐TRD patients.
Conclusion
Ten percent of subjects newly diagnosed and treated for depression developed TRD within a year. They were younger and suffered more frequently from fatigue, substance use disorders, anxiety, psychiatric conditions, insomnia, and pain than non‐TRD patients.
Keywords: epidemiology, observational studies, prediction, real world evidence, risk factors
1. INTRODUCTION
Major depressive disorder has been associated with substantial morbidity, healthcare costs, mortality, and family burden (Rush et al., 2006). The National Comorbidity Survey and the National Health and Nutrition Examination Survey estimated that 5–8% of the adult U.S. population has major depression (Blazer, Kessler, McGonagle, & Swartz, 1994; Cepeda, Stang, & Makadia, 2016; Pratt & Brody, 2008).
No single treatment for depression is uniformly effective, and subsequent interventions are often needed (Rush et al., 2006). When more treatments are needed, higher relapse rates are expected (Rush et al., 2006), and when a patient does not respond to antidepressant medications the patient is diagnosed as having treatment‐resistant depression (TRD). If one could predict whether a patient who is being diagnosed with depression for the first time would develop TRD, healthcare providers could monitor these patients more closely or implement treatments in different ways (Gaynes, 2016).
Many clinical definitions of TRD exist (Berlim & Turecki, 2007; Russell et al., 2004). The definitions range from not responding to a single treatment to not responding to sequential treatments. Based on the National Institute of Mental Health funded Sequenced Treatment Alternatives to Relieve Depression (STAR*D) trial, resistance to treatment increases markedly after the failure of two adequate dose–duration treatments (Conway, George, & Sackeim, 2017). Implementing a definition of TRD in claims databases is difficult because it requires the assessment of treatment response that is not explicit in the database. In claims databases, changes in medications can occur because of adverse events, lack of effectiveness, or disease remission (Fife et al., 2017; Kubitz, Mehra, Potluri, Garg, & Cossrow, 2013).
Claims databases allow researchers to study hundreds of thousands of subjects, a sample size many times larger than the traditional studies (De Carlo, Calati, & Serretti, 2016; Kautzky et al., 2017; Souery et al., 2007), and assess a much larger number of potential predictors compared with the traditional studies (Simon & Perlis, 2010). A definition of TRD to be used in claims databases has been created that avoids the subjective decisions often involved in operationalizing it. This data‐driven definition was built using a decision tree approach and used as a proxy for TRD in the presence of procedures such as electroconvulsive therapy. This definition states that a subject with pharmaceutically treated depression who has had ≥3 distinct antidepressants or ≥1 antipsychotic with an antidepressant in a year has TRD (Cepeda et al., 2013). This rule discriminates well between subjects with and without proxies for TRD, transports very well to other claims databases even with different patient characteristics, and is superior (discriminates better) to more complex expert‐based heuristic definitions created to discern if an antidepressant is changed because of lack of efficacy, lack of tolerability, inadequate dose, or duration (Cepeda et al., 2013).
The aim of this study was to identify factors that predict who develops TRD in a real‐world setting.
2. MATERIALS AND METHODS
We designed a retrospective cohort study using the Truven Health MarketScan® Commercial Claims and Encounters Database (CCAE) and we used the Optum Clinformatics® Extended Data Mart (Optum) (OptumInsight, Eden Prairie, MN) database for validation.
CCAE is an administrative health claims database reflecting an employed population and their dependents. It captures person‐specific clinical utilization, expenditures, and enrollment across inpatient, outpatient, and prescription drugs for 127 million subjects.
The Optum database (OptumInsight's de‐identified ClinformaticsTM Datamart, extended) is an administrative health claims database for members who are fully insured in commercial plans or in administrative services only and commercial medicare. It includes data captured from administrative claims processed from inpatient and outpatient medical services and prescriptions as dispensed.
The databases were converted to the Observational Medical Outcomes Partnership (OMOP) common data model (CDM) (Stang et al., 2010) One advantage of a standardized format and content is that the same analytic code can be applied to any database in the CDM format (Voss et al., 2015). The standardization of the content is achieved through the implementation of a standard vocabulary with source code mapping. In the OMOP vocabulary, drugs and conditions are referred to by concepts. The OMOP vocabulary provides relationships and ancestry relationships between concepts and extensive mapping to a variety of classification systems (Reich, Ryan, Stang, & Rocca, 2012), so that drugs and conditions can be grouped at specific levels of a hierarchy in a specific classification system. A series of standardized analytic tools have been developed against the OMOP CDM as part of the Observational Health Data Sciences and Informatics (OHDSI) collaborative (Hripcsak et al., 2015).
All medical conditions assessed in this study were defined using SNOMED (Systematized Nomenclature of Medicine‐Clinical Terms). SNOMED is a standardized, multilingual vocabulary of clinical terminology that is used by physicians and other healthcare providers for the electronic exchange of clinical health information (Reich et al., 2012)
2.1. Target population
We included subjects who had pharmaceutically treated depression from 2000 to 2016. Subjects were required to (1) have a dispensing for an antidepressant for the first time in the database, (2) have their presence in the database for at least a year before the index date, which is the date of dispensing of the first antidepressant, (3) have received a diagnosis for depression for the first time within 60 days of the index date, and (4) be 18 years or older at the index date.
We excluded subjects with mania, dementia, and psychosis before the index date. Supporting Information Appendix 1 has the SNOMED concepts used to define depression, dementia, mania, and psychosis.
2.2. Analysis
The outcome of interest was a diagnosis of TRD within a year after the index date. TRD was identified as the earliest date at which a subject had dispensing for one antidepressant and one antipsychotic or at least three distinct antidepressants. This definition discriminates better between subjects with and without TRD than definitions implemented in claims databases that include dose and duration (Cepeda et al., 2013). It is likely that the subjectivity involved in all the assumptions that need to be made in attempts to replicate the clinical definitions in a claims database introduce noise, and just counting the number of antidepressants during a specific time period may be a more accurate measure. The list of antidepressants and antipsychotics is described in Supporting Information Appendix 2.
As predictors, we included age, gender, all medical conditions (e.g., codes for essential hypertension), condition eras (e.g., conditions that are repeated within 30 days of one another), all medications dispensed (e.g., codes for specific diuretics), medication eras (e.g., drugs at the ingredient level that are repeated within 30 days of one another), all procedures (e.g., codes such as evaluation of cardiovascular function with tilt table evaluation), measures (e.g., codes such as systolic blood pressure at first encounter), and observations (e.g., normal blood pressure reading documented) present 1 year before the index date. Figure 1 illustrates how the study was conducted.
Figure 1.
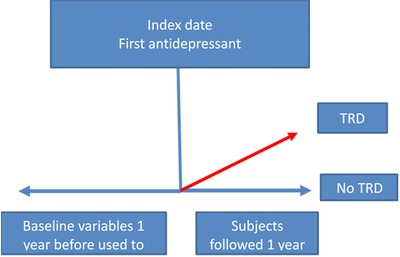
Predicting treatment‐resistant depression in subjects newly diagnosed and treated for depression
To create and validate the model, the CCAE database was randomly split into a developing set (75%) used to determine the model coefficients or “learn”, and an internal validation set (25%) used to evaluate how well the model performs on previously unseen data.
Because of the large number of variables considered, we used lasso regularized logistic regression models (Steyerberg, Eijkemans, Harrell, & Habbema, 2000; Suchard, Simpson, Zorych, Ryan, & Madigan, 2013; Tibshirani, 1996). Lasso regularized logistic regression limits the number of variables included into the trained model by adding a Laplace prior to the maximum likelihood that centers the coefficients toward zero. The consequence is that the trained model only includes variables that are highly predictive of the outcome. The lasso regression was trained using three‐fold cross validation and an automated search toward the optimal lambda (regularization) hyperparameter.
We calculated area under the curve (AUC) to assess the performance of the predicting model. The AUC is a measure that quantifies the ability of the model to discriminate between subjects with and without the outcome (Hajian‐Tilaki, 2013). The higher the AUC the better the model discriminates between the subject with and without TRD; an AUC of 0.50 means the predictive model is no better than random chance, while an AUC of 1.0 means the model can perfectly discriminate cases from noncases.
To investigate whether interactions between variables could improve performance, we also used tree‐based methods (gradient boosting machine and random forest).
We used the OHDSI patient level prediction R package for the analysis. This enables the prediction model to be shared with anyone who has data in the OMOP CDM format (Reps, Schuemie, Suchard, Ryan, & Rijnbeek, 2017).
Since the model's ability to discriminate between subjects with and without TRD was only modest, we reported only medical conditions that were more commonly observed in one group than in the other.
2.3. Risk factors for TRD
To determine which baseline covariates were more common in the TRD group compared with the no‐TRD group, we calculated risk ratios (RRs) for variables selected by the regularized regression. The RRs were calculated by dividing the proportion of subjects with a specific medical condition in the TRD group divided by the proportion of subjects with that condition in the no‐TRD group. Ratios larger than 1 mean that the condition is more common in the TRD group. We report 95% confidence intervals (CIs).
2.4. External validation
For external validation of the model, we applied the model developed in the CCAE database to another database, Optum.
3. RESULTS
Out of 127 million people, 370,322 had a dispensing of an antidepressant with a year of prior observation in the database and 230,801 met all the inclusion criteria and were analyzed.
The mean age of the subjects was 36.97 and the majority (63%) were women.
Ten percent (10.4%) of the subjects (24,037) developed TRD within 1 year after being newly diagnosed and treated for depression.
The model to predict TRD within 1 year after being newly diagnosed for depression included 69,755 variables. The final model selected 344 predictors (Supporting Information Appendix 3). It had a modest discriminatory ability. The AUC in the training set (developing sample) was 0.68 and dropped to 0.66 in the test set (internal validation sample).
The decision tree models did not lead to any improvement in discriminative performance. The AUC in the test set was 0.68 for the gradient boosting machine and 0.67 for the random forest.
3.1. Risk factors for TRD
In the TRD group, patients at baseline were younger. For example, 10.87% of subjects in the TRD group were between 18 to 19 years old compared with 7.64% in the no‐TRD group, RR = 1.42 (95% CI 1.37–1.48). The proportion of men was slightly higher in the TRD group than in the no‐TRD group, RR = 1.12 (95% CI 1.1–1.14) (Table 1).
Table 1.
Background characteristic in subjects with and without treatment‐resistant depression
| General conditions | Specific condition | Prevalence in subjects with TRDN = 24,037 | Prevalence in subjects withno TRDN = 206,764 | Risk ratio | 95% Confidence interval |
|---|---|---|---|---|---|
| Demographics* | Age group: 18–19 years | 10.87% | 7.64% | 1.42 | 1.37–1.48 |
| Age group: 20–24 years | 18.55% | 14.14% | 1.31 | 1.28–1.35 | |
| Age group: 25–29 years | 12.05% | 9.85% | 1.22 | 1.18–1.27 | |
| Age group: 30–34 years | 13.18% | 12.74% | 1.03 | 1.0–1.07 | |
| Male | 41.00% | 36.53% | 1.12 | 1.10–1.14 | |
| Fatigue | Fatigue | 1.07% | 0.29% | 3.68 | 3.18–4.25 |
| Substance use disorders | Opioid dependence | 0.93% | 0.29% | 3.23 | 2.77–3.77 |
| Drug abuse | 0.97% | 0.36% | 2.66 | 2.30–3.09 | |
| Poisoning by CNS drug | 0.58% | 0.23% | 2.54 | 2.11–3.07 | |
| Tobacco dependence syndrome | 5.25% | 4.24% | 1.24 | 1.17–1.31 | |
| Anxiety | Obsessive‐compulsive disorders and symptoms | 0.96% | 0.42% | 2.30 | 1.99–2.66 |
| Social phobia | 0.87% | 0.35% | 2.53 | 2.17–2.94 | |
| Posttraumatic stress disorder | 1.60% | 0.75% | 2.14 | 1.92–2.40 | |
| Panic disorder | 2.74% | 1.44% | 1.91 | 1.76–2.08 | |
| Anxiety disorders and symptoms | 30.70% | 22.20% | 1.38 | 1.35–1.41 | |
| Psychiatric disorders | Eating disorders | 0.73% | 0.40% | 1.81 | 1.54–2.13 |
| Insomnia | 9.32% | 5.71% | 1.63 | 1.57–1.71 | |
| Attention deficit disorder | 2.55% | 1.96% | 1.30 | 1.20–1.42 | |
| Pain | Pain of head and neck | 14.03% | 11.61% | 1.21 | 1.17–1.25 |
| Abdominal pain | 13.07% | 11.01% | 1.19 | 1.15–1.23 | |
| Musculoskeletal pain | 18.01% | 15.58% | 1.16 | 1.12–1.19 |
CNS, central nervous system; TRD, treatment‐resistant depression.
*Only age groups associated with treatment‐resistant depression are presented.
Anxiety disorders at baseline were the most common comorbidity observed, and these disorders were present more frequently in patients with TRD, with an RR of 1.38 (95% CI 1.35–1.14) (Table 1).
Fatigue, although not as common as anxiety, was more frequently observed at baseline in the TRD group than in the no‐TRD group, and had the highest RR among the identified risk factors, RR = 3.68 (95% CI 3.18–4.25) (Table 1).
Patients with TRD had diagnoses of substance use disorders, psychiatric conditions, insomnia, and pain more often at baseline than patients who did not develop TRD (Table 1).
3.2. External validation
In the Optum database, 229,447 subjects met all the inclusion criteria and were analyzed. The results were similar to CCAE. The AUC was 0.68 and 11.06% of the subjects (20,743) developed TRD within 1 year after being newly diagnosed and treated for depression.
4. DISCUSSION
Ten percent of the subjects newly diagnosed and treated for depression developed TRD within a year. To predict TRD, we built a model that included a large number of subjects and variables that included medical conditions, medications, measurements, and procedures that were present a year before the first diagnosis and first treatment for depression. The model's ability to discriminate between subjects with and without TRD was only modest. Therefore, we concentrated on assessing medical conditions that were more commonly observed in one group than in the other. We found that subjects who developed TRD were younger and more likely to suffer from fatigue, substance use disorders, anxiety, other psychiatric conditions, insomnia, and pain than subjects with no TRD.
History of fatigue in patients newly diagnosed with depression, although uncommon, was the most discriminative factor; it was 3.6 times more common in subjects with TRD. This is a new finding, but the relevance of fatigue in depression is not new. Fatigue is not only frequently reported in patients with depression (Targum & Fava, 2011), but is also one of the most common residual symptoms in patients with partially resolved depression (Marin & Menza, 2004). Fatigue is also strongly associated with future depression (Addington, Gallo, Ford, & Eaton, 2001; Marin & Menza, 2004).
Early onset of depression has been consistently identified as a risk factor for TRD (Bennabi et al., 2015). In this study, we included newly diagnosed subjects with depression and found that indeed subjects who developed TRD were younger than those who did not develop TRD within the year of observation.
Anxiety disorders are common in subjects with depression (Wu, Erickson, Piette, & Balkrishnan, 2012), and have been identified as a risk factor for not responding well to treatment (Al‐Harbi, 2012; Bennabi et al., 2015; Souery et al., 2007; van Loo et al., 2014). We found that subjects who developed TRD were more likely to have anxiety as a symptom or a diagnosed anxiety disorder.
The STAR*D trial (Rush et al., 2009) found that subjects who required more treatments, and therefore had higher levels of treatment resistance, not only had more anxiety, but also were more likely to have obsessive compulsive disorder than those without TRD. In addition to those factors predicting TRD, we found that the TRD group had more eating and attention deficit disorders at baseline than the no‐TRD group.
We also found that compared to the no‐TRD group, subjects who developed TRD had more pain diagnoses and insomnia at baseline or within 1 year before the diagnosis and treatment of depression.
Population‐based studies have shown that depression and insomnia are strongly correlated and that subjects with depression have a shorter duration of sleep at night compared to those who are not depressed (Cepeda, Stang, Blacketer, Kent, & Wittenberg, 2018; van Mill, Vogelzangs, van Someren, Hoogendijk, & Penninx, 2014). The findings of the present study suggest that subjects who developed TRD were more symptomatic at baseline than those who did not develop TRD; they had more anxiety and pain and could not sleep.
This study is based on an administrative claims database, which contains data intended to facilitate the healthcare financial reimbursement process and is not meant for research purposes. Therefore, the reliability of the diagnosis of medical conditions could be lower than that in a prospective study, and the capture of symptoms or lifestyle behaviors is limited because this information is not needed for reimbursement. The impact of these shortcomings is that the prevalence of the medical conditions we are reporting is underestimated in both groups. For example, we know that opioid use disorders are markedly underreported in claims databases (Cepeda, Fife, Kihm, Mastrogiovanni, & Yuan, 2016).
We aimed at predicting which patients would develop TRD when they were diagnosed and treated for the first time, in order for healthcare providers to be able to act accordingly; however, the model had limited ability to discriminate. One potential explanation is that we predicted TRD in subjects newly diagnosed and treated with depression. Published prediction models for TRD with better performance include subjects with prevalent depression (Kautzky et al., 2017). Predicting TRD in prevalent cases of depression is less challenging because these patients will have more depressive episodes and more comorbidities, which are risk factors for TRD. The downside of focusing on subjects newly diagnosed and treated with depression is that the identified predictors are generalizable only to that type of patient. Other reasons that could explain the limited ability of the model to discriminate between subjects with and without TRD are the inconsistent capture of key variables and the lack of capture of variables that could be very predictive, such as biological markers or genetic risk factors (Simon & Perlis, 2010). For example, while healthcare databases, such as CCAE, have claims for laboratory tests for inflammatory markers such C reactive protein, which is higher in patients with depression (Cepeda et al., 2016), only a subset of subjects have laboratory results. Elevated inflammatory markers such as C reactive protein seem to be associated with a lower response to antidepressant treatment (Lanquillon, Krieg, Bening‐Abu‐Shach, & Vedder, 2000). Socioeconomic factors have also been identified as important risk factors for poor response to antidepressants (Jakubovski & Bloch, 2014), and CCAE does not capture income.
The lack of consistency in data capture can lead to misclassification, making the subjects with and without TRD artificially similar, and precluding the model from discriminating between subjects with and without TRD. It is believed that TRD represents a conglomerate of depressive subtypes (Simon & Perlis, 2010); the coarse coding of depression diagnoses in claims databases precludes the detection of such subtypes, limiting the ability of a model to predict TRD. Nonetheless, this analysis allowed us to detect potential factors that predict TRD, independent of any assessment of causality.
5. CONCLUSION
In this large population‐based study, we found that 10% of the subjects newly diagnosed and treated for depression developed TRD within a year. We found that subjects who developed TRD were younger and suffered more frequently from fatigue, substance use disorders, anxiety, psychiatric conditions, insomnia, and pain than subjects with no TRD. When a healthcare provider sees a patient, who is being diagnosed with depression for the first time, the presence of these characteristics could alert her/him to the possibility that the patient could develop TRD.
CONFLICT OF INTEREST
All authors are employees of Janssen Research & Development, LLC. Janssen Research & Development, LLC, has an interest in depression and treatment‐resistant depression.
Supporting information
Supporting Information
Supporting Information
Supporting Information
Cepeda MS, Reps J, Ryan P. Finding factors that predict treatment‐resistant depression: Results of a cohort study. Depress Anxiety. 2018;35:668–673. 10.1002/da.22774
REFERENCES
- Addington, A. M. , Gallo, J. J. , Ford, D. E. , & Eaton, W. W. (2001). Epidemiology of unexplained fatigue and major depression in the community: The Baltimore ECA follow‐up, 1981–1994. Psychological Medicine, 31(6), 1037–1044. [DOI] [PubMed] [Google Scholar]
- Al‐Harbi, K. S. (2012). Treatment‐resistant depression: Therapeutic trends, challenges, and future directions. Patient Preference and Adherence, 6, 369–388. 10.2147/PPA.S29716 [DOI] [PMC free article] [PubMed] [Google Scholar]
- Bennabi, D. , Aouizerate, B. , El‐Hage, W. , Doumy, O. , Moliere, F. , Courtet, P. , … Haffen, E. (2015). Risk factors for treatment resistance in unipolar depression: A systematic review. Journal of Affective Disorders, 171, 137–141. 10.1016/j.jad.2014.09.020 [DOI] [PubMed] [Google Scholar]
- Berlim, M. T. , & Turecki, G. (2007). What is the meaning of treatment resistant/refractory major depression (TRD)? A systematic review of current randomized trials. European Neuropsychopharmacology, 17(11), 696–707. 10.1016/j.euroneuro.2007.03.009 [DOI] [PubMed] [Google Scholar]
- Blazer, D. G. , Kessler, R. C. , McGonagle, K. A. , & Swartz, M. S. (1994). The prevalence and distribution of major depression in a national community sample: The National Comorbidity Survey. The American Journal of Psychiatry, 151(7), 979–986. [DOI] [PubMed] [Google Scholar]
- Cepeda, M. S. , Fife, D. , Kihm, M. A. , Mastrogiovanni, G. , & Yuan, Y. (2013). Comparison of the risks of shopping behavior and opioid abuse between tapentadol and oxycodone and association of shopping behavior and opioid abuse. The Clinical Journal of Pain, 30(12):1051–1056. 10.1097/AJP.0000000000000067 [DOI] [PMC free article] [PubMed] [Google Scholar]
- Cepeda, M. S. , Reps, J. , Fife, D. , Blacketer, C. , Stang, P. , & Ryan, P. (2018). Finding treatment‐resistant depression in real‐world data: How a data‐driven approach compares with expert‐based heuristics. Depression and Anxiety, 35(3), 220–228. 10.1002/da.22705 [DOI] [PMC free article] [PubMed] [Google Scholar]
- Cepeda, M. S. , Stang, P. , Blacketer, C. , Kent, J. M. , & Wittenberg, G. M. (2016). Clinical relevance of sleep duration: Results from a cross‐sectional analysis using NHANES. Journal of Clinical Sleep Medicine, 12(6):813–819. [DOI] [PMC free article] [PubMed] [Google Scholar]
- Cepeda, M. S. , Stang, P. , & Makadia, R. (2016). Depression is associated with high levels of C reactive protein and low levels of exhaled nitric oxide: Results of a large population based study on NHANES. The Journal of Clinical Psychiatry, 77(12):1666–1671. [DOI] [PubMed] [Google Scholar]
- Conway, C. R. , George, M. S. , & Sackeim, H. A. (2017). Toward an evidence‐based, operational definition of treatment‐resistant depression: When enough is enough. JAMA Psychiatry, 74(1), 9–10. 10.1001/jamapsychiatry.2016.2586 [DOI] [PubMed] [Google Scholar]
- De Carlo, V. , Calati, R. , & Serretti, A. (2016). Socio‐demographic and clinical predictors of non‐response/non‐remission in treatment resistant depressed patients: A systematic review. Psychiatry Research, 240, 421–430. 10.1016/j.psychres.2016.04.034 [DOI] [PubMed] [Google Scholar]
- Fife, D. , Reps, J. , Cepeda, M. S. , Stang, P. E. , Blacketer, M. , & Singh, J. (2017). Treatment resistant depression incidence estimates from studies of health insurance databases depend strongly on the details of the operating definition. submitted for publication. [DOI] [PMC free article] [PubMed]
- Gaynes, B. (2016). Recognizing and assessing risk factors for difficult‐to‐treat depression and treatment‐resistant depression. Journal of Clinical Psychiatry, 77(9), e1154 10.4088/JCP.14077cc2c [DOI] [PubMed] [Google Scholar]
- Hajian‐Tilaki, K. (2013). Receiver operating characteristic (ROC) curve analysis for medical diagnostic test evaluation. Caspian Journal of Internal Medicine, 4(2), 627–635. [PMC free article] [PubMed] [Google Scholar]
- Hripcsak, G. , Duke, J. D. , Shah, N. H. , Reich, C. G. , Huser, V. , Schuemie, M. J. , … Ryan, P. B. (2015). Observational Health Data Sciences and Informatics (OHDSI): opportunities for observational researchers. Studies in Health Technology and Informatics, 216, 574–578. [PMC free article] [PubMed] [Google Scholar]
- Jakubovski, E. , & Bloch, M. H. (2014). Prognostic subgroups for citalopram response in the STAR*D trial. Journal of Clinical Psychiatry, 75(7), 738–747. 10.4088/JCP.13m08727 [DOI] [PMC free article] [PubMed] [Google Scholar]
- Kautzky, A. , Baldinger‐Melich, P. , Kranz, G. S. , Vanicek, T. , Souery, D. , Montgomery, S. , … Kasper, S. (2017). A new prediction model for evaluating treatment‐resistant depression. Journal of Clinical Psychiatry, 78(2), 215–222. 10.4088/JCP.15m10381 [DOI] [PubMed] [Google Scholar]
- Kubitz, N. , Mehra, M. , Potluri, R. C. , Garg, N. , & Cossrow, N. (2013). Characterization of treatment resistant depression episodes in a cohort of patients from a US commercial claims database. PLoS One, 8(10), e76882 10.1371/journal.pone.0076882 [DOI] [PMC free article] [PubMed] [Google Scholar]
- Lanquillon, S. , Krieg, J. C. , Bening‐Abu‐Shach, U. , & Vedder, H. (2000). Cytokine production and treatment response in major depressive disorder. Neuropsychopharmacology, 22(4), 370–379. 10.1016/s0893-133x(99)00134-7 [DOI] [PubMed] [Google Scholar]
- Marin, H. , & Menza, M. A. (2004). Specific treatment of residual fatigue in depressed patients. Psychiatry (Edgmont), 1(2), 12–18. [PMC free article] [PubMed] [Google Scholar]
- Pratt, L. A. , & Brody, D. J. (2008). Depression in the United States household population, 2005–2006. NCHS Data Brief (7), 1–8. [PubMed]
- Reich, C. , Ryan, P. B. , Stang, P. E. , & Rocca, M. (2012). Evaluation of alternative standardized terminologies for medical conditions within a network of observational healthcare databases. Journal of Biomedical Informatics, 45(4), 689–696. 10.1016/j.jbi.2012.05.002 [DOI] [PubMed] [Google Scholar]
- Reps, J. , Schuemie, M. , Suchard, M. A. , Ryan, P. B. , & Rijnbeek, P. (2017). Patient Level Prediction: Package for patient level prediction using data in the OMOP Common Data Model.
- Rush, A. J. , Trivedi, M. H. , Wisniewski, S. R. , Nierenberg, A. A. , Stewart, J. W. , Warden, D. , … Fava, M. (2006). Acute and longer‐term outcomes in depressed outpatients requiring one or several treatment steps: A STAR*D report. American Journal of Psychiatry, 163(11), 1905–1917. 10.1176/ajp.2006.163.11.1905 [DOI] [PubMed] [Google Scholar]
- Rush, A. J. , Trivedi, M. H. , Wisniewski, S. R. , Stewart, J. W. , Nierenberg, A. A. , Thase, M. E. , … Star D. Study Team (2006). Bupropion‐SR, sertraline, or venlafaxine‐XR after failure of SSRIs for depression. The New England Journal of Medicine, 354(12), 1231–1242. 10.1056/NEJMoa052963 [DOI] [PubMed] [Google Scholar]
- Rush, A. J. , Warden, D. , Wisniewski, S. R. , Fava, M. , Trivedi, M. H. , Gaynes, B. N. , & Nierenberg, A. A. (2009). STAR*D: Revising conventional wisdom. CNS Drugs, 23(8), 627–647. 10.2165/00023210-200923080-00001 [DOI] [PubMed] [Google Scholar]
- Russell, J. M. , Hawkins, K. , Ozminkowski, R. J. , Orsini, L. , Crown, W. H. , Kennedy, S. , … Rush, A. J. (2004). The cost consequences of treatment‐resistant depression. Journal of Clinical Psychiatry, 65(3), 341–347. [DOI] [PubMed] [Google Scholar]
- Simon, G. E. , & Perlis, R. H. (2010). Personalized medicine for depression: Can we match patients with treatments? The American Journal of Psychiatry, 167(12), 1445–1455. 10.1176/appi.ajp.2010.09111680 [DOI] [PMC free article] [PubMed] [Google Scholar]
- Souery, D. , Oswald, P. , Massat, I. , Bailer, U. , Bollen, J. , Demyttenaere, K. , … Mendlewicz, J. (2007). Clinical factors associated with treatment resistance in major depressive disorder: Results from a European multicenter study. Journal of Clinical Psychiatry, 68(7), 1062–1070. [DOI] [PubMed] [Google Scholar]
- Stang, P. E. , Ryan, P. B. , Racoosin, J. A. , Overhage, J. M. , Hartzema, A. G. , Reich, C. , … Woodcock, J. (2010). Advancing the science for active surveillance: Rationale and design for the observational medical outcomes partnership. Annals of Internal Medicine, 153(9), 600–606. 10.7326/0003-4819-153-9-201011020-00010 [DOI] [PubMed] [Google Scholar]
- Steyerberg, E. W. , Eijkemans, M. J. , Harrell, F. E., Jr. , & Habbema, J. D. (2000). Prognostic modelling with logistic regression analysis: A comparison of selection and estimation methods in small data sets. Statistics in Medicine, 19(8), 1059–1079. [DOI] [PubMed] [Google Scholar]
- Suchard, M. A. , Simpson, S. E. , Zorych, I. , Ryan, P. , & Madigan, D. (2013). Massive parallelization of serial inference algorithms for a complex generalized linear model. ACM Transactions on Modeling and Computer Simulation, 23(1), 1–17. 10.1145/2414416.2414791 [DOI] [PMC free article] [PubMed] [Google Scholar]
- Targum, S. D. , & Fava, M. (2011). Fatigue as a residual symptom of depression. Innovations in Clinical Neuroscience, 8(10), 40–43. [PMC free article] [PubMed] [Google Scholar]
- Tibshirani, R. (1996). Regression shrinkage and selection via the lasso. Journal of the Royal Statistical Society. Series B (Methodological), 58(1), 267–288. [Google Scholar]
- van Loo, H. M. , Cai, T. , Gruber, M. J. , Li, J. , de Jonge, P. , Petukhova, M. , … Kessler, R. C. (2014). Major depressive disorder subtypes to predict long‐term course. Depression and Anxiety, 31(9), 765–777. 10.1002/da.22233 [DOI] [PMC free article] [PubMed] [Google Scholar]
- van Mill, J. G. , Vogelzangs, N. , van Someren, E. J. , Hoogendijk, W. J. , & Penninx, B. W. (2014). Sleep duration, but not insomnia, predicts the 2‐year course of depressive and anxiety disorders. Journal of Clinical Psychiatry, 75(2), 119–126. 10.4088/JCP.12m08047 [DOI] [PubMed] [Google Scholar]
- Voss, E. A. , Makadia, R. , Matcho, A. , Ma, Q. , Knoll, C. , Schuemie, M. , … Ryan, P. B. (2015). Feasibility and utility of applications of the common data model to multiple, disparate observational health databases. Journal of the American Medical Informatics Association, 22(3), 553–564. 10.1093/jamia/ocu023 [DOI] [PMC free article] [PubMed] [Google Scholar]
- Wu, C. H. , Erickson, S. R. , Piette, J. D. , & Balkrishnan, R. (2012). The association of race, comorbid anxiety, and antidepressant adherence among Medicaid enrollees with major depressive disorder. Research in Social and Administrative Pharmacy, 8(3), 193–205. 10.1016/j.sapharm.2011.04.002 [DOI] [PubMed] [Google Scholar]
Associated Data
This section collects any data citations, data availability statements, or supplementary materials included in this article.
Supplementary Materials
Supporting Information
Supporting Information
Supporting Information