Abstract
Bile acids stimulate a bicarbonate‐rich choleresis, in part, through effects on cholangiocytes. Because Cl− channels in the apical membrane of cholangiocytes provide the driving force for secretion and transmembrane member 16A (TMEM16A) has been identified as the Ca2+‐activated Cl− channel in the apical membrane of cholangiocytes, the aim of the present study was to determine whether TMEM16A is the target of bile‐acid–stimulated Cl− secretion and to identify the regulatory pathway involved. In these studies of mouse, rat, and human biliary epithelium exposure to ursodeoxycholic acid (UDCA) or tauroursodeoxycholic acid (TUDCA) rapidly increased the rate of exocytosis, ATP release, [Ca2+]i, membrane Cl− permeability, and transepithelial secretion. Bile‐acid–stimulated Cl− currents demonstrated biophysical properties consistent with TMEM16A and were inhibited by pharmacological or molecular (small‐interfering RNA; siRNA) inhibition of TMEM16A. Bile acid–stimulated Cl− currents were not observed in the presence of apyrase, suramin, or 2‐aminoethoxydiphenyl borate (2‐APB), demonstrating that current activation requires extracellular ATP, P2Y, and inositol 1,4,5‐trisphosphate (IP3) receptors. TUDCA did not activate Cl− currents during pharmacologic inhibition of the apical Na+‐dependent bile acid transporter (ASBT), but direct intracellular delivery of TUDCA rapidly activated Cl− currents. Conclusion: Bile acids stimulate Cl− secretion in mouse and human biliary cells through activation of membrane TMEM16A channels in a process regulated by extracellular ATP and [Ca2+]i. These studies suggest that TMEM16A channels may be targets to increase bile flow during cholestasis. (Hepatology 2018;68:187‐199).
Abbreviations
- 2‐APB
2‐aminoethoxydiphenyl borate
- APL
apical surface liquid
- ASBT
apical sodium‐dependent bile acid transporter
- CA
cholic acid
- CFTR
cystic fibrosis transmembrane conductance regulator
- EGTA
ethylene glycol tetraacetic acid
- GSK
glycogen synthase kinase
- IP3
inositol 1,4,5‐trisphosphate
- MLCs
mouse large cholangiocytes
- NEM
N‐ethylmaleimide
- NRCs
normal rat cholangiocytes
- siRNA
small‐interfering RNA
- TCA
taurocholic acid
- TMEM16A
transmembrane member 16A
- TUDCA
tauroursodeoxycholic acid
- UDCA
ursodeoxycholic acid
Bile formation is initiated by the vectorial transport of bile acids from the hepatocyte canalicular membrane into the canalicular space. This active transport process concentrates bile acids by 100‐fold or greater in the canalicular space and provides an osmotic gradient favoring influx of water and electrolytes through paracellular junctions. Interestingly, some bile acids, such as UDCA, increase bile flow to a greater extent than can be explained by osmotic effects alone. This hypercholeresis is associated with alkalinization and dilution of bile11 and is attributed, in part, to increases in ductular secretion by biliary epithelial cells known as cholangiocytes.1 Despite the comparatively small number of cholangiocytes, the network of intrahepatic ducts is extensive, and ductular secretion is thought to account for up to 40% of bile volume in humans.2, 3 Moreover, cholangiocytes have been shown to take up bile acids at the apical membrane and transport them across the basolateral membrane where they return to the hepatocyte in a process known as cholehepatic shunting.4, 5, 6 The local recycling of bile acids leads to an increase in Cl− and HCO3 − efflux into the duct lumen. This is important because studies from our laboratory as well as others have demonstrated that Cl− channels in the apical membrane of cholangiocytes provide the driving force for biliary secretion.7, 8
Two Cl− channels have been identified on a molecular basis in cholangiocytes, (1) the cystic fibrosis transmembrane conductance regulator (CFTR), a cAMP‐activated Cl− channel,9 and (2) TMEM16A, also known as anoctamin or Ano‐1, a Ca2+‐activated Cl− channel.10 Importantly, in isolated cells and intact biliary epithelial monolayers, increases in [Ca2+]i increase Cl− current density and transepithelial secretion, respectively, to values 3‐ to 5‐fold greater than cAMP.7, 12 Thus, these findings indicate that TMEM16A, not CFTR, may represent the dominant Cl− channel regulating anion efflux, and Ca2+‐dependent signaling may represent the dominant pathway for modulating the anion permeability of the apical cholangiocyte membrane.
Over 20 years ago, Shimokura et al. demonstrated that UDCA directly stimulates Ca2+‐activated Cl− channels in duct cells13; however, the molecular identification and regulatory mechanism(s) have remained unknown. Herein, we identify TMEM16A as the target of bile acid–induced cholangiocyte Cl− secretion, utilizing mouse, rat, and human models, and describe the regulatory pathways involved.
Materials and Methods
CELL MODELS
Studies were performed in (1) mouse cholangiocytes isolated from medium‐ to large‐sized intrahepatic ducts of C57BL/6 mice as described14, 15; (2) mouse large cholangiocytes (MLCs) isolated from normal mice (BALB/c) and immortalized by transfection with the SV40 large‐T antigen gene as described16; (3) normal rat cholangiocyte (NRC) monolayers17; and (4) human Mz‐Cha‐1 cells derived from a human biliary adenocarcinoma of the gallbladder.18 For studies of apical surface liquid (ASL) and ATP release, MLC or NRC cells were cultured on collagen‐coated semipermeable transwell supports for 7‐10 days, permitting the development of highly polarized cells with a high transepithelial resistance (Rt > 1,000 Ω.cm2). Animal work described in this article has been approved and conducted under the oversight of the UT Southwestern Institutional Animal Care and Use Committee.
TMEM16A EXPRESSION
TMEM16A protein was detected by western blotting utilizing mouse monoclonal (C‐5: sc‐377115) or rabbit polyclonal TMEM16A antibody (H‐41: sc‐135235; Santa Cruz Biotechnology, Santa Cruz, CA). Signals were visualized using enhanced chemiluminescence detection (Pierce Biotechnology, Inc., Rockford, IL); specific signals were captured by x‐ray and band‐intensity quantified using ImageJ software (NIH, Bethesda, MD).
TMEM16A SILENCING
TMEM16A expression was inhibited using specific TMEM16A siRNA (TMEM16A‐HSS123904). In brief, 25‐nucleotide siRNAs were designed and synthesized (http://onlinelibrary.wiley.com/doi/10.1002/hep.29804/suppinfo) and transfected using Lipofectamine 2000 or Lipofectamine RNAi Max. Noncoding Stealth RNAi (medium guanine cytosine duplex; Invitrogen) was utilized in control (mock) transfections. Block‐it Fluorescent Oligo (Invitrogen) was used to optimize transfection conditions and for selection of transfected cells for whole‐cell patch‐clamp current recording. Experiments were performed 48‐72 hours after transfection, and degree of TMEM16A silencing was evaluated by western blotting analysis.10
MEASUREMENT OF [Ca2+]i
MLCs were cultured for 2 days in glass coverslips, loaded with 2.5 μg/mL of Fura‐2 AM (TEF Laboratories, Austin, TX) in isotonic buffer, and imaged on the stage of an inverted fluorescence microscope (Nikon TE2000). Changes of [Ca2+]i were measured at an excitation wavelength of 340 nm for calcium‐bound Fura‐2 and 380 nm for calcium‐free Fura‐2 and an emission wavelength of 510 nm as described.7
MEASUREMENT OF EXOCYTOSIS
Exocytosis was assessed by real‐time imaging using the fluorescent dye, FM1‐43 (Molecular Probes, Inc., Eugene, OR), as described.19 FM1‐43 is weakly fluorescent in aqueous solution, but its fluorescence increases >300‐fold when it binds plasma membrane; thus, it is a useful dye for the measurement of increases in plasma membrane attributed to fusion of vesicle membrane with the plasma membrane during exocytosis. Changes of FM1‐43 fluorescence were measured at excitation wavelength 480 nm and emission wavelength at 535 nm and reported as % change in fluorescence.
MEASUREMENT OF ATP RELEASE
Bulk ATP release was studied from confluent cells using the luciferin‐luciferase assay as described.15, 20 Bioluminescence, reflecting ATP release, was quantified as arbitrary light units.
MEASUREMENT of Cl− CURRENTS
Membrane currents were measured by whole‐cell patch‐clamp techniques with a standard extracellular and intracellular (pipette) solution (http://onlinelibrary.wiley.com/doi/10.1002/hep.29804/suppinfo). Recordings were made with an Axopatch ID amplifier (Axon Instruments, Foster City, CA) and digitized and analyzed using pCLAMP version 10 as described.10 Three voltage protocols were utilized: (1) holding potential of –40 mV, with 100‐ms steps to 0 mV and –80 mV at 10‐second intervals; (2) holding potential –40 mV, with 100‐ms steps to 0 mV and +60 mV at 10‐second intervals; and (3) holding potential –40 mV, with 450‐ms steps from –100 mV to +100 mV in 20‐mV increments. Protocols 1 and 2 were utilized for real‐time tracings and protocol 3 for generation of current‐voltage (I‐V) plots. Results are reported as current density (pA/pF) to normalize for differences in cell size. Details of the buffer solutions, voltage protocols, and data acquisition are provided in the http://onlinelibrary.wiley.com/doi/10.1002/hep.29804/suppinfo.
MEASUREMENT OF ASL HEIGHT
The height of the fluid level at the apical membrane of confluent MLC or NRC monolayers was performed as described.21 Confluent cells on 24‐mm collagen‐coated transwell permeable membranes were labeled with Calcein‐AM and 80 μL of Dextran‐Red (Molecular Probes) in phosphate‐buffered saline was added to the apical chamber. Transwells were mounted on a Zeiss confocal microscope and images acquired using a Zeiss 40×/0.8 water immersion lens. All images were analyzed with ImageJ (NIH, Bethesda, MD), as described.21
STATISTICAL ANALYSIS
Detailed descriptions of the reagents, buffer solutions, experimental protocols, and statistical analysis are provided in http://onlinelibrary.wiley.com/doi/10.1002/hep.29804/suppinfo.
Results
BILE ACIDS INCREASE INTRACELLULAR CALCIUM AND STIMULATE OPENING OF MEMBRANE Ca2+‐ACTIVATED Cl− CHANNELS
Exposure of cholangiocytes to either UDCA or TUDCA rapidly increased [Ca2+]i (Fig. 1A,B). Two patterns were observed: a rapid peak with a short bile acid exposure and an oscillatory, but sustained peak with continued bile acid exposure (Fig. 1A and http://onlinelibrary.wiley.com/doi/10.1002/hep.29804/suppinfo). Of note, the bile acids, cholic acid (CA) and taurocholic acid (TCA), did not increase [Ca2+]i. In parallel studies, exposure to UDCA or TUDCA rapidly activated membrane Cl− currents. Under basal conditions with standard intra‐ and extracellular buffers, ICl– was small. Exposure to either UDCA or TUDCA resulted in activation of currents within 2 minutes (representative traces shown in Fig. 1B). Bile‐acid–stimulated Cl− currents exhibited characteristic biophysical features of Ca2+‐activated Cl− channels with reversal at 0 mV (ECl–), time‐dependent activation, and outward rectification; identical properties to those previously described for TMEM16A.10, 22 Currents were sustained for the duration of bile acid exposure, followed by gradual return to basal levels within 5‐10 minutes following removal of bile acids from the extracellular buffer. Currents were not observed when Cl− was removed from the recording solutions, when intracellular Ca2+ was chelated (10 mM of ethylene glycol tetraacetic acid [EGTA] in pipette), or with the bile acids, CA or TCA (Fig. 1D,E and http://onlinelibrary.wiley.com/doi/10.1002/hep.29804/suppinfo). The magnitude of Ca2+‐activated Cl− current density was proportional to the concentration of UDCA with a K1/2‐maximal concentration at 50 μM (Fig. 1D). Similar results were obtained in MLC cells and Mz‐Cha‐1 cells, and no differences in the biophysical properties of [Ca2+]i responses or Cl− currents were observed between species or cell types; however, Mz‐Cha‐1 cells and the cell line, MLC, were less sensitive to UDCA, requiring higher concentrations for maximal [Ca2+]i or current activation (http://onlinelibrary.wiley.com/doi/10.1002/hep.29804/suppinfo).
Figure 1.
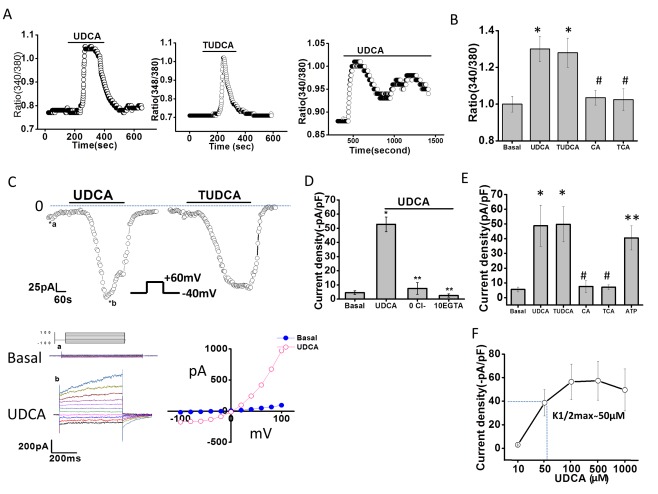
Bile acids increase intracellular Ca2+ and stimulate Ca2+‐activated Cl– currents in mouse cholangiocytes. (A) Representative studies of MLC cells demonstrating increases in [Ca2+]i, in response to TUDCA (2.5 mM, middle panel), or UDCA (2.5 mM) during an acute exposure (left panel) or prolonged exposure (right panel). (B) Cumulative data demonstrating maximum increase in Fura‐2 fluorescence with UDCA (n = 65), TUDCA (n = 58), CA (n = 46), and TCA (n = 42); * P < 0.05 versus basal; #not significant (n.s.) versus basal. (C) Representative whole‐cell currents of isolated mouse cholangiocytes measured during basal conditions and during exposure to UDCA (250 μM, left) or TUDCA (250 μM, right). Voltage protocol shown as inset. Top, currents measured at −40 mV (○), representing ICl – are shown. Bile acid exposure is indicated by the bar. Currents activated within 2 minutes of bile acid exposure and were reversible when bile acids were removed. Zero current levels are indicated by the dotted lines. Bottom, a voltage‐step protocol (inset), from a holding potential of –40 mV, with 450‐ms steps from –100 to +100 mV in 20‐mV increments, was obtained at (a*) and (b*) representing basal and maximal inward currents, respectively. Currents demonstrated time‐dependent activation at membrane potentials >+60 mV (left panel). The I‐V plot was generated from these protocols during basal (•) and UDCA‐stimulated (○) conditions (right panel). (D) Cumulative data demonstrating maximum current density (‐pA/pF) in response to UDCA and after removal of Cl– (n = 9; ** P ≤ 0.01) or chelation of Ca2+ (EGTA 10 mM, n = 8; ** P ≤ 0.01). (E) Cumulative data demonstrating maximum increase in current density (‐pA/pF) in response to bile acids (250 μM each) or ATP (100 μM); n = 4‐10 each, * P < 0.05 versus basal; ** P < 0.01 versus basal; #n.s. (F) Dose‐response curve demonstrating maximal current density (‐pA/pF, y‐axis) and UDCA concentration (μM, x‐axis); n = 8 for each concentration.
BILE‐ACID–STIMULATED Cl− CURRENTS ARE MEDIATED BY TMEM16A
To identify the molecular basis of the bile‐acid–stimulated Cl− currents in cholangiocytes, whole‐cell currents were measured in cells in the presence or absence of pharmacological inhibition of TMEM16A or after transfection with TMEM16A siRNA. First, compared to control cells, preincubation with the Ca2+‐activated Cl− channel inhibitor, niflumic acid, or the specific TMEM16A inhibitor, TMEM16Ainh‐A01, significantly inhibited Cl− currents in response to either UDCA or TUDCA (Fig. 2). In contrast, the CFTR channel inhibitor, CFTRinh‐172, had no effect on bile‐acid–stimulated currents. Second, in control or mock‐transfected MLC, exposure to UDCA resulted in characteristic Ca2+‐activated Cl− currents, whereas transfection of MLC with TMEM16A siRNA decreased TMEM16A protein by 56% ± 8% and was accompanied by a significant decrease in whole‐cell Cl− currents (Fig. 2). Similar results were observed in human Mz‐Cha‐1 cells (http://onlinelibrary.wiley.com/doi/10.1002/hep.29804/suppinfo), confirming that the previously observed UDCA‐stimulated Cl− currents in these cells13 are mediated by TMEM16A. Together, these studies demonstrate that the Ca2+‐activated Cl− currents stimulated by bile acids in mouse cholangiocytes and human biliary cells are mediated by TMEM16A.
Figure 2.
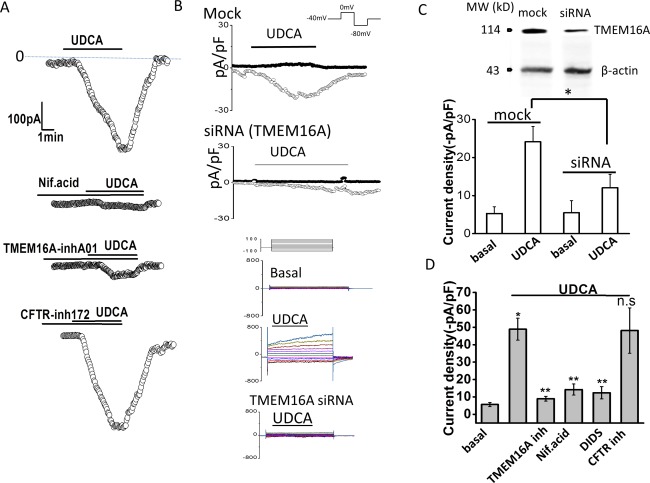
TMEM16A contributes to bile‐acid–stimulated Cl– currents. Representative whole‐cell UDCA‐stimulated Cl– currents in MLC cells in the presence or absence of pharmacological inhibitors of TMEM16A (A) or after transfection with TMEM16A siRNA (B). (A) UDCA‐stimulated currents measured at −40 mV (○) under control conditions (top trace) and in the presence of the Ca2+‐activated Cl– channel inhibitor, niflumic acid (NIf.acid; 100 μM, middle trace), the TMEM16A inhibitor, TMEM16A‐inh‐A01 (10 μM, middle trace), or the CFTR inhibitor, Cftr‐inh‐172 (10 μM, bottom trace), indicated by the bar. (B) Representative whole‐cell current traces in MLC cells transfected with nontargeting siRNA (Mock) or TMEM16A siRNA. UDCA‐stimulated currents measured at –80 mV (open circles), representing ICl–, and at 0 mV (closed circles), representing IK+, are shown. Voltage protocols shown in insets. Representative currents in response to the step protocol (see Materials and Methods) are shown below traces during basal conditions and after UDCA exposure in mock‐transfected cells or TMEM16A siRNA transfected cells. (C) Cumulative data demonstrating maximum current density (‐pA/pF) during basal conditions or UDCA exposure (100 μM) measured at –80 mV after either mock (n = 8) or TMEM16A siRNA transfection (n = 7). * P < 0.01 UDCA versus basal; ** P < 0.05 maximum UDCA currents in mock versus TMEM16A siRNA transfection. Inset (top), representative western blotting demonstrating change in TMEM16A protein levels in cells transfected with nontargeting siRNA (mock), and cells transfected with TMEM16A siRNA. β‐actin used as loading control. (D) Cumulative data demonstrating maximal current density (‐pA/pF) measured at –40 mV in response to UDCA under control conditions and in the presence of the Cl– channel inhibitors, TMEM16A‐inh‐A01 (10 μM), niflumic acid (100 μM), DIDS (4,40‐diisothiocyanato‐stilbene‐2,20‐disulfonic acid; 100 μM), or Cftr‐inh‐172 (10 μM). Values represent maximum current density measured at −40 mV (mean ± SEM). *UDCA significantly increased current density P < 0.05 (n = 12). **UDCA‐stimulated currents were significantly inhibited by niflumic acid, DIDS, or TMEM16A‐inh‐A01 (n = 6‐12 each; P < 0.05).
BILE‐ACID–STIMULATED TMEM16A CURRENTS ARE DEPENDENT ON EXTRACELLULAR ATP AND STIMULATION OF P2Y AND IP3 RECEPTORS
We have previously shown that cholangiocyte TMEM16A Cl− channels are activated by increases in [Ca2+]i in response to extracellular ATP and stimulation of P2Y and IP3 receptors.10, 19 To determine whether bile‐acid–stimulated TMEM16A currents are dependent on activation of a similar pathway, studies were performed, in the presence or absence of apyrase, to hydrolyze ATP, suramin, to inhibit P2Y receptors, or 2‐APB to inhibit IP3 receptors. In all cases, both the bile‐acid–stimulated increase in [Ca2+]i and Cl− currents were significantly inhibited compared to control conditions (Fig. 3). Together, these studies demonstrate that the TMEM16A‐mediated Cl− currents stimulated by bile acids are dependent on extracellular ATP and activation of P2Y, and IP3 receptors.
Figure 3.
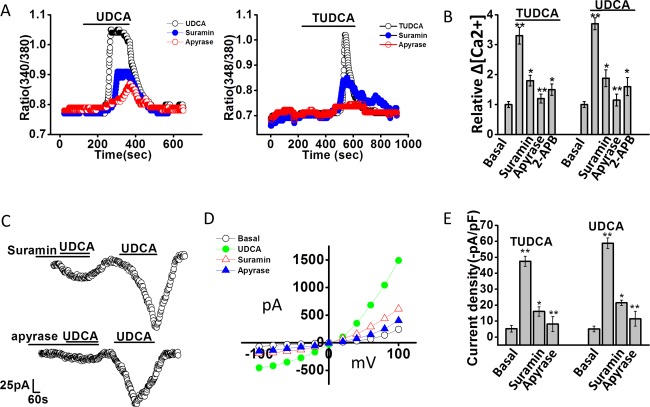
Bile‐acid–stimulated increases in [Ca2+]i and Cl– currents are dependent on extracellular ATP‐mediated P2 receptor stimulation. (A) Representative studies of MLC cells demonstrating increases in [Ca2+]i, in response to UDCA (2.5 mM, left panel) and TUDCA (2.5 mM, right panel) in the absence or presence of the P2 receptor antagonist, suramin (‐•‐,10 μM, closed blue circle), or the ATP hydrolyzing enzyme, apyrase (‐ο‐, 5 U/mL, open red circle). (B) Cumulative data demonstrating the change in [Ca2+]i in response to bile acids in control cells (n = 178) and in the presence of suramin (n = 62), apyrase (n = 52), or the IP3 receptor inhibitor, 2‐APB (n = 35). Values represent relative change in fluorescence ratio 340/380. **Maximal increase versus basal P ≤ 0.01; *inhibitor versus control P ≤ 0.05; **apyrase versus control P ≤ 0.01. (C). Representative whole‐cell patch‐clamp recordings in response to UDCA in the presence of suramin (10 μM, left panel) or apyrase (5 U/mL, right panel) as indicated by the bars. In each case, currents activated after the inhibitor was removed from the bath solution. (D) I‐V plots, generated from step protocol, showing Cl– currents under basal (ο), UDCA (•, closed green circle), UDCA with suramin (Δ, open red triangle), or UDCA with apyrase (▴, closed blue triangle) conditions. (E) Cumulative data representing maximum current density (‐pA/pF) measured at –40 mV in response to TUDCA or UDCA. ** P ≤ 0.01 maximum current density versus basal. *Suramin (n = 6; P ≤ 0.05) and **apyrase (n = 9; P ≤ 0.01) significantly inhibited bile‐acid–stimulated currents.
BILE ACIDS STIMULATE EXOCYTOSIS AND ATP RELEASE
We have previously shown that release of endogenous ATP from cholangiocytes stimulates Cl− secretion7 and that ATP release in response to mechanical stimulation or increases in cell volume occurs through a mechanism involving exocytosis of ATP‐containing vesicles.23 To determine whether bile acids work through a similar pathway, studies were performed to assess their effect on exocytosis and ATP release. First, exposure of cholangiocytes to either UDCA or TUDCA rapidly increased exocytosis. The increase in exocytosis was greatest with TUDCA (Fig. 4) and was inhibited by the SNARE complex inhibitor, N‐ethylmaleimide (NEM), which blocks exocytosis by preventing vesicle fusion24 In parallel studies, exposure to either UDCA or TUDCA stimulated ATP release from polarized MLC monolayers, which was blocked by NEM (Fig. 4C). In contrast, CA or TCA failed to increase ATP release. Together, the findings demonstrate that UDCA and TUDCA increase both the rate of exocytosis and ATP release from mouse cholangiocytes and that intact vesicle fusion pathways are required for bile‐acid–stimulated ATP release.
Figure 4.
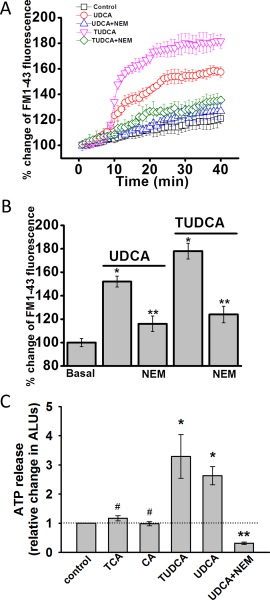
Bile acid increase exocytosis and ATP release in MLC cells. (A) MLC cells on coverglass were loaded with FM1‐43 and exposed to extracellular buffer (□, control) UDCA (250 μM, ‐ο‐, open red circle), TUDCA (250 μM, ‐∇‐, open pink triangle), UDCA with NEM (100 μM, ‐Δ‐, open blue triangle), or TUDCA with NEM (100 μM, ‐⋄‐, open green diamond). The values on the y‐axis represent % increase in membrane fluorescence. (B) Cumulative data demonstrating maximum % increase in exocytosis (measured as membrane fluorescence) in response to UDCA (250 μM), TUDCA (250 μM), or UDCA or TUDCA after incubation with NEM (100 μM). * P < 0.05 bile acid versus basal, n = 30; ** P < 0.05 control versus NEM, n = 25. (C) Bile‐acid–stimulated ATP release. ATP in the extracellular media was detected using the luciferin‐luciferase assay and quantified as arbitrary light units (ALU). Values represent maximum ATP concentration within 15 minutes of bile acid exposure (TCA, n = 6; CA, n = 6; TUDCA, n = 12, UDCA, n = 12), mean ± SEM; * P < 0.05 versus basal; ** P < 0.01 UDCA with NEM versus UDCA alone (n = 6); #not significant.
BILE ACIDS INCREASE FLUID SECRETION FROM POLARIZED CHOLANGIOCYTE MONOLAYERS
To determine the role of TMEM16A in modulating fluid volume, studies were performed in an integrated model utilizing confluent MLC or NRC monolayers. Addition of either UDCA or TUDCA to the apical membrane significantly increased the height of ASL (Fig. 5). However, the bile‐acid–stimulated increase in ASL was not observed in the presence of the specific channel antagonist, TMEM16Ainh‐A01, or with the bile acids, CA or TCA (Fig. 5). The increase in ASL by UDCA and TUDCA was similar to that observed previously when ATP was applied apically21 and was inhibited in the presence of apyrase to hydrolyze ATP. In the presence of the CFTR inhibitor, CFTR‐inh172, UDCA failed to increase ASL. However, the inhibition was overcome by exogenous addition of ATP, suggesting that CFTR plays a role in facilitating ATP release. Together, these studies in confluent monolayers demonstrate that bile acids stimulate an integrated secretory response, increasing fluid volume at the apical membrane. Bile‐acid–mediated secretion requires CFTR‐dependent ATP release and activation of TMEM16A Cl− channels.
Figure 5.
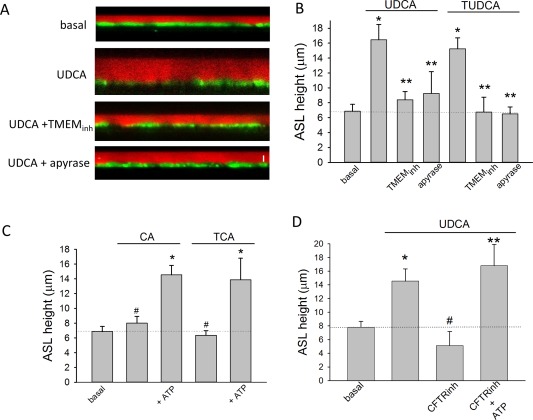
ASL height in mouse cholangiocyte monolayers. (A) Representative X‐Z confocal images of confluent polarized mouse cholangiocyte monolayers (green) after apical addition of Dextran‐Red (red) to the apical compartment. Representative monolayers shown during basal conditions (top), after addition of UDCA (100 μM, middle), UDCA + TMEM16A‐inhA01 (10 μM, middle), and UDCA + apyrase (5 U/mL, bottom). Bar shown in bottom panel represents 10 μm. (B) Cumulative data demonstrating effect of UDCA (n = 8) or TUDCA (n = 6) on ASL in presence or absence of TMEM16Ainh‐A01 (n = 6) or apyrase (n = 4; * P < 0.05 vs. basal; ** P < 0.05 vs. maximal bile‐acid–stimulated ASL). (C) Cumulative data demonstrating effect of CA (100 μM) or TCA (100 μM) on ASL in the presence or absence of ATP (100 M); n = 6‐8 each; * P < 0.05 ATP versus bile acid alone; #n.s. (not significant). (D) Cumulative data demonstrating effect of UDCA (100 μM, n = 10) on ASL in presence or absence of CFTR‐inh172 (10 μM, n = 6) or CFTR‐inh172 + ATP (100 μM, n = 5); * P < 0.05 versus basal; ** P < 0.05 CFTR‐inh + ATP versus CFTR‐inh alone; #n.s. versus basal.
BILE ACIDS ACTIVATE MEMBRANE Cl− CURRENTS BY AN INTRACELLULAR MECHANISM
It has previously been shown that UDCA works intracellularly to activate Ca2+‐activated Cl− currents.13 To determine whether the observed activation of membrane Cl− channels by TUDCA also occurs intracellularly, additional whole‐cell patch‐clamp studies were performed utilizing intracellular dialysis. This technique allows delivery of individual bile acids to the cell interior by inclusion in the patch pipette and permits simultaneous measurement of whole‐cell currents.25 For these studies, Na+ and K+ ions were replaced by Tris+ to minimize potential effects of bile acids on cation conductance. Intracellular delivery of TUDCA significantly increased whole‐cell Cl− currents. With high calcium buffering capacity (10 mM of EGTA in pipette), the same concentration of TUDCA had no effect on Cl− currents (Fig. 6). Additionally, when TUDCA was delivered intracellularly in the presence of apyrase in the bath solution, currents were significantly inhibited. Together, these studies indicate that TUDCA activates Cl− currents through an intracellular mechanism that requires extracellular ATP and intracellular Ca2+.
Figure 6.
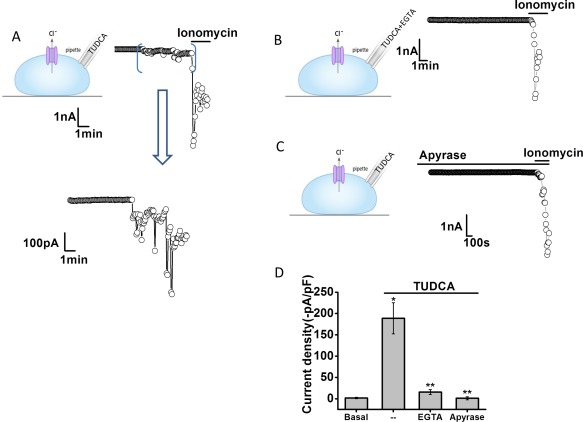
Intracellular dialysis with TUDCA activates Cl– currents. Representative whole‐cell currents recorded during intracellular dialysis with TUDCA (100 μM) by inclusion in the patch pipette (A). Currents measured at –40 mV (○), representing ICl– are shown. Horizontal bar above the trace indicates application of the Ca2+ ionophore, ionomycin (1 μM). Area between brackets is shown in expanded view (bottom). Representative traces with inclusion of EGTA (10 mM/L) in pipette (B) and in the presence of the ATP hydrolyzing enzyme apyrase (5 U/mL) in the bath solution (C). (D) Cumulative data showing the magnitude of TUDCA‐stimulated currents, reported as current density (‐pA/pF) under control conditions and with intracellular Ca2+ chelation (EGTA in pipette) or apyrase in the bath solution. **Intracellular delivery of TUDCA significantly increases currents (n = 13; P < 0.05). *Currents were inhibited by EGTA (n = 9, P < 0.01) or apyrase (n = 10, P < 0.01).
TUDCA‐STIMULATED INCREASES IN [Ca2+]i, Cl− CURRENTS, AND FLUID SECRETION REQUIRE ACTIVITY OF THE APICAL ASBT
Because uptake of TUDCA at the apical cholangiocyte membrane requires transport by ASBT,26 the role of ASBT in bile‐acid–stimulated [Ca2+]i, Cl− currents, and ASL were assessed in separate studies. To determine whether TUDCA‐stimulated TMEM16A Cl− currents are dependent on ASBT, [Ca2+]i, and whole‐cell Cl− currents were measured in the presence or absence of the ASBT inhibitor, GSK2330672.27 Both the TUDCA‐stimulated increase in [Ca2+]i and whole‐cell Cl− currents were inhibited in the presence of GSK2330672 (Fig. 7A,B). Likewise, in polarized MLC or NRC monolayers, inhibition of ASBT by glycogen synthase kinase (GSK) prevented the normal bile‐acidstimulated increase in ASL (Fig. 7C). Together, these studies demonstrate that functional ASBT protein in the cholangiocyte membrane is required for TUDCA‐stimulated increases in [Ca2+]i, Cl− currents, and transepithelial fluid secretion.
Figure 7.
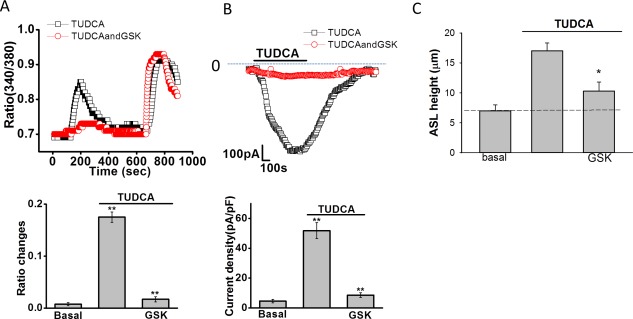
Inhibition of ASBT inhibits TUDCA‐stimulated increases in [Ca2+]i, Cl– currents, and ASL. (A) Top panel, Fura‐2–loaded Mz‐Cha‐1 cells were exposed to TUDCA (1 mM) under control conditions (‐□‐) or after incubation with the ASBT inhibitor, GSK2330670 (1 μM, ‐ο‐). Maximal [Ca2+]i was obtained by exposure to ionomycin (1 μM) as indicated by the bar. Bottom panel, cumulative data demonstrating the effect of GSK2330670 on TUDCA‐stimulated [Ca2+]i. Values represent the change in 340/380 ratio (n = 36 each). *TUDCA significantly increases [Ca2+]i in control cells (P < 0.05); **GSK2330670 significantly inhibits TUDCA‐stimulated Fura‐2 fluorescence (P < 0.01). (B) Top panel, representative whole‐cell patch clamp recording of TUDCA (250 μM) stimulated currents (indicated by the bar) under control conditions (‐□‐) and after incubation with GSK2330670 (100 nM, ‐ο‐) for 10 minutes. Currents measured at –40 mV (open circles) representing ICl– are shown. Bottom panel, cumulative data. *TUDCA significantly increased whole‐cell Cl– currents (n = 12; P < 0.01). **GSK2330670 significantly inhibited TUDCA‐stimulated currents (n = 11 each; P < 0.01). Values represent maximum current density (‐pA/pF), mean ± SEM, measured at –40 mV. (C) Cumulative data demonstrating effect of GSK2330670 (1 μM) on the height of the apical surface liquid of normal rat cholangiocyte monolayers. The TUDCA (100 μM, n = 6, * P < 0.05) increase in ASL was inhibited by GSK (n = 5, * P < 0.05).
Discussion
In these studies of human, rat, and mouse biliary epithelium, we have identified TMEM16A as the Ca2+‐activated Cl− channel that is activated by the uptake of bile acids at the apical cholangiocyte membrane and which contributes to ductular secretion. This is based on the following findings: (1) both UDCA and TUDCA increase exocytosis, ATP release, and [Ca2+]i through a pathway involving P2Y and IP3 receptors, the same operative pathway involved in TMEM16A activation7, 10; (2) bile‐acid–stimulated Cl− currents have biophysical properties consistent with TMEM16A channels,22 are inhibited by both TMEM16A siRNA and pharmacological antagonists of TMEM16A, and are unaffected by antagonists of CFTR; and (3) in polarized cholangiocyte monolayers, the increase in ASL volume observed with apical application of bile acids is abolished by TMEM16A inhibition. Additionally, we demonstrated that activation of TMEM16A by the conjugated bile acid, TUDCA, requires bile acid uptake because (1) Cl− currents were not observed when the uptake of TUDCA was prevented by specific pharmacological inhibition of ASBT, and (2) Cl− currents were activated when bile acids were delivered solely intracellularly by intracellular dialysis. Thus, TMEM16A represents a link between bile‐acid–dependent and ductular bile formation and thus may contribute to biliary secretion and hypercholeresis associated with the cholehepatic shunting of bile acids.
It should be highlighted that activation of TMEM16A by bile acids occurs through a process involving the purinergic signaling complex in which ATP is released, binds P2Y receptors, and increases [Ca2+]i through IP3 receptor‐dependent release from intracellular stores. Our previous studies in polarized normal rat cholangiocyte (NRC) and MLC monolayers demonstrate that this signaling pathway occurs at the apical membrane.7 This is in contrast to the activation of the cAMP‐regulated Cl− channel, CFTR, which is regulated by binding of the hormone secretin to receptors on the basolateral membrane.28 Thus, bile acid activation of TMEM16A represents an example of hepatobiliary coupling, in which bile acids released into bile by hepatocytes can signal to downstream cholangiocytes and modulate ductular Cl− transport. Together with our findings, as well as previous findings, demonstrating that bile acids are potent stimulators of ATP release into bile,15, 29 a model is demonstrated in which increases in the concentration of bile acids in the intrahepatic bile duct lumen is transmitted to ATP release, autocrine/paracrine P2 receptor binding, and TMEM16A‐mediated increases in cholangiocyte membrane Cl− permeability (Fig. 8).
Figure 8.
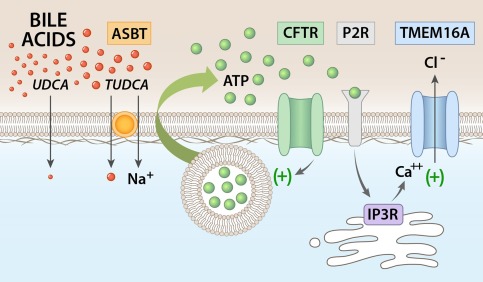
Proposed model of bile‐acid–stimulated TMEM16A Cl– channel activation in biliary epithelium. Uptake of bile acids at the apical cholangiocyte membrane results in ATP release. TUDCA uptake requires ASBT. Uptake of bile acids stimulates ATP release, which may involve exocytosis of ATP‐enriched vesicles and is facilitated by CFTR. Released ATP binds P2Y receptors in an autocrine or paracrine manner, resulting in an increase in intracellular Ca2+ through IP3 receptor‐mediated release from intracellular stores. The increase in [Ca2+]i activates TMEM16A Cl– channels, which provide the driving force for ductular secretion.
In describing the regulation of TMEM16A‐mediated Cl− channel activity by bile acids, several points are in order. First, although these studies demonstrate a predominant role of TMEM16A in bile‐acid–stimulated Cl− secretion, we cannot exclude contributions from other Cl− channels or TMEM16 isoforms. TMEM16A/ANO‐1 is a 114‐kDa membrane protein with 960 amino acids and eight transmembrane domains and is one of the ten members of TMEM16/ANO family of proteins.22 Cholangiocytes express several isoforms, including a, f, j, and k,10 but of these, only TMEM16A (ANO1) is associated with Ca2+‐activated Cl− currents.22 Additionally, CFTR does not appear to play a direct role in mediating the Cl− efflux in response to bile acids given that the biophysical properties of the bile‐acid–stimulated Cl− currents are distinct from CFTR, which exhibits a linear current‐voltage relation and no time dependence.30 Furthermore, pharmacological inhibition of CFTR neither affected the activation nor the magnitude of bile‐acid–stimulated currents and it has been previously shown that UDCA does not increase cAMP (the second messenger required for CFTR activation) levels in cholangiocytes.15 Interestingly, whereas the majority of bile‐acid–stimulated Cl− currents demonstrated outward rectification and time‐dependent activation at depolarizing potentials above +60 mV, in some cells the bile‐acid–stimulated Cl− currents demonstrated slightly different biophysical properties (time‐dependent inactivation), and which were unaffected by TMEM16A silencing (http://onlinelibrary.wiley.com/doi/10.1002/hep.29804/suppinfo). These biophysical properties are consistent with volume‐activated Cl− currents described in biliary epithelial cells,31 the molecular identity of which have not been determined.
Second, these studies evaluated UDCA, TUDCA, CA, and TCA, finding that only UDCA and TUDCA increased TMEM16A activity. It is acknowledged that other bile acids may have distinct effects on the TMEM16A‐mediated secretory pathway described here. In all our studies, ATP release and P2 receptor binding was required for bile‐acid–stimulated TMEM16A activation. Previously, it has been shown that different bile acids have variable effects on ATP release into bile, with UDCA and TUDCA having the greatest effect.29 Interestingly, the effects on ATP release parallel the known choleretic effects of these bile acids,2 suggesting that bile‐acid–stimulated ATP release and activation of TMEM16A Cl− channels may be the final common pathway responsible for bile‐acid–stimulated ductular secretion.
Third, the mechanism by which bile acids interact with cholangiocytes to release ATP and initiate purinergic signaling and TMEM16A activation requires further study. It has previously been shown that UDCA‐stimulated release of ATP into bile requires CFTR15 and that cAMP‐activation of CFTR can stimulate ATP release.32 Thus, whereas our studies demonstrate that TMEM16A is the “downstream” Cl− channel responsible for ATP‐stimulated Cl− efflux, CFTR appears to be the “upstream” target involved in bile‐acid–stimulated ATP release. The mechanism by which CFTR facilitates cellular ATP release is unknown, but perhaps plays a role in tethering regulatory proteins at the apical membrane33, 34 or in the maturation, trafficking, or fusion of ATP‐enriched vesicles, known to be involved in cholangiocyte ATP release.23
Fourth, although our studies demonstrate that bile acids work intracellularly and uptake of bile acids by cholangiocytes is necessary for TMEM16A activation, the intracellular targets for bile acids in the secretory process are unknown. Interestingly, we have previously shown that TMEM16A is positively regulated by protein kinase C alpha,25 which is known to translocate to the plasma membrane in response to UDCA.15 Thus, bile acids may have important effects on secondary messengers or other signaling molecules involved in TMEM16A regulation. The intracellular target(s) of bile acids that are responsible for initiating the TMEM16A‐mediated secretory pathway will be an important area for future investigations.
In summary, these studies have identified TMEM16A as the Ca2+‐activated Cl− channel responsible for bile‐acid–stimulated Cl− secretion in biliary epithelium. Furthermore, these studies provide a molecular mechanism by which bile acids may stimulate hypercholeresis during cholehepatic shunting by directly activating the P2Y‐IP3R‐TMEM16A secretory complex. The identification of TMEM16A as the Cl− channel responsible for cholangiocyte Cl− efflux in response to bile acids may provide a target to modulate bile flow for the management of cholestatic liver diseases.
Author names in bold designate shared co‐first authorship.
Supporting information
Additional Supporting Information may be found at http://onlinelibrary.wiley.com/doi/10.1002/hep.29804/suppinfo.
Supporting Information 1
Supporting Information 2
Potential conflict of interest: Nothing to report.
Supported by the National Institute of Diabetes and Digestive and Kidney Diseases (NIDDK) of the National Institutes of Health under award number R01DK078587, The Children's Health Foundation, and the Willis C. Maddrey, M.D. endowment, (to A.P.F.).
REFERENCES
- 1. Renner ER, Lake JR, Cragoe EJ, Jr. , Van Dyke RW, Scharschmidt BF. Ursodeoxycholic acid choleresis: relationship to biliary HCO3 and effects of Na+/H+ exchange inhibitors. Am J Physiol 1988;254:G232‐G241. [DOI] [PubMed] [Google Scholar]
- 2. Preisig R, Cooper HL, Wheeler HO. The relationship between taurocholate secretion rate and bile production in the unanesthetized dog during cholinergic blockade and during secretin administration. J Clin Invest 1962;41:1152‐1162. [DOI] [PMC free article] [PubMed] [Google Scholar]
- 3. Boyer JL. Bile formation and secretion. Compr Physiol 2013;3:1035‐1078. [DOI] [PMC free article] [PubMed] [Google Scholar]
- 4. Levine RA, Hall RC. Cyclic AMP in secretin choleresis. Evidence for a regulatory role in man and baboons but not in dogs. Gastroenterology 1976;70:537‐544. [PubMed] [Google Scholar]
- 5. Glaser SS, Alpini G. Activation of the cholehepatic shunt as a potential therapy for primary sclerosing cholangitis. Hepatology 2009;49:1795‐1797. [DOI] [PubMed] [Google Scholar]
- 6. Hofmann AF. Current concepts of biliary secretion. Dig Dis Sci 1989;34(12 Suppl):16S‐20S. [DOI] [PubMed] [Google Scholar]
- 7. Yoon YB, Hagey LR, Hofmann AF, Gurantz D, Michelotti EL, Steinbach JH. Effect of side chain shortening on the physiologic properties of bile acids: hepatic transport and effect on biliary secretion of 23‐Nor‐ursodeoxycholate in rodents. Gastroenterology 1986;90:837‐852. [DOI] [PubMed] [Google Scholar]
- 8. Dutta AK, Woo K, Doctor RB, Fitz JG, Feranchak AP. Extracellular nucleotides stimulate Cl‐ currents in biliary epithelia through receptor‐mediated IP3 and Ca2+ release. Am J Physiol Gastrointest Liver Physiol 2008;295:G1004‐G1015. [DOI] [PMC free article] [PubMed] [Google Scholar]
- 9. Fitz JG, Basavappa S, McGill J, Melhus O, Cohn JA. Regulation of membrane chloride currents in rat bile duct epithelial cells. J Clin Invest 1993;91:319‐328. [DOI] [PMC free article] [PubMed] [Google Scholar]
- 10. Cohn JA, Strong TA, Picciotto MA, Nairn AC, Collins FS, Francis S, et al. Localization of CFTR in human bile duct epithelial cells. Gastroenterology 1993;105:1857‐1864. [DOI] [PubMed] [Google Scholar]
- 11. Dutta AK, Khimji AK, Kresge C, Bugde A, Dougherty M, Esser V, et al. Identification and functional characterization of TMEM16A, a Ca2+‐activated Cl‐ channel activated by extracellular nucleotides, in biliary epithelium. J Biol Chem 2011;286:766‐776. [DOI] [PMC free article] [PubMed] [Google Scholar]
- 12. Schlenker T, Romac JM, Sharara A, Roman RM, Kim S, LaRusso N, et al. Regulation of biliary secretion through apical purinergic receptors in cultured rat cholangiocytes. Am J Physiol 1997;273:G1108‐G1117. [DOI] [PubMed] [Google Scholar]
- 13. Shimokura GH, McGill J, Schlenker T, Fitz JG. Ursodeoxycholate increases cytosolic calcium concentration and activates Cl‐ currents in a biliary cell line. Gastroenterology 1995;109:965‐972. [DOI] [PubMed] [Google Scholar]
- 14. Fabris L, Cadamuro M, Fiorotto R, Roskams T, Spirli C, Melero S, et al. Effects of angiogenic factor overexpression by human and rodent cholangiocytes in polycystic liver diseases. Hepatology 2006;43:1001‐1012. [DOI] [PubMed] [Google Scholar]
- 15. Fiorotto R, Spirli C, Fabris L, Cadamuro M, Okolicsanyi L, Strazzabosco M. Ursodeoxycholic acid stimulates cholangiocyte fluid secretion in mice via CFTR‐dependent ATP secretion. Gastroenterology 2007;133:1603‐1613. [DOI] [PubMed] [Google Scholar]
- 16. Ueno Y, Alpini G, Yahagi K, Kanno N, Moritoki Y, Fukushima K, et al. Evaluation of differential gene expression by microarray analysis in small and large cholangiocytes isolated from normal mice. Liver Int 2003;23:449‐459. [DOI] [PubMed] [Google Scholar]
- 17. Vroman B, LaRusso N. Development and characterization of polarized primary cultures of rat intrahepatic bile duct epithelial cells. Lab Invest 1996;74:303‐313. [PubMed] [Google Scholar]
- 18. Knuth A, Gabbert H, Dippold W, Klein O, Sachsse W, Bitter‐Suermann D, et al. Biliary adenocarcinoma. Characterization of three new human tumor cell lines. J Hepatol 1985;1:579‐596. [DOI] [PubMed] [Google Scholar]
- 19. Woo K, Sathe M, Kresge C, Esser V, Ueno Y, Venter J, et al. Adenosine triphosphate release and purinergic (P2) receptor‐mediated secretion in small and large mouse cholangiocytes. Hepatology 2010;52:1819‐1828. [DOI] [PMC free article] [PubMed] [Google Scholar]
- 20. Taylor AL, Kudlow BA, Marrs KL, Gruenert D, Guggino WB, Schwiebert EM. Bioluminescence detection of ATP release mechanisms in epithelia. Am J Physiol 1998;275:C1391‐C1406. [DOI] [PubMed] [Google Scholar]
- 21. Li Q, Kresge C, Bugde A, Lamphere M, Park JY, Feranchak AP. Regulation of mechanosensitive biliary epithelial transport by the epithelial Na(+) channel. Hepatology 2016;63:538‐549. [DOI] [PMC free article] [PubMed] [Google Scholar]
- 22. Caputo A, Caci E, Ferrera L, Pedemonte N, Barsanti C, Sondo E, et al. TMEM16A, a membrane protein associated with calcium‐dependent chloride channel activity. Science 2008;322:590‐594. [DOI] [PubMed] [Google Scholar]
- 23. Sathe MN, Woo K, Kresge C, Bugde A, Luby‐Phelps K, Lewis MA, et al. Regulation of purinergic signaling in biliary epithelial cells by exocytosis of SLC17A9‐dependent ATP‐enriched vesicles. J Biol Chem 2011;286:25363‐25376. [DOI] [PMC free article] [PubMed] [Google Scholar]
- 24. Malhotra V, Orci L, Glick BS, Block MR, Rothman JE. Role of an N‐ethylmaleimide‐sensitive transport component in promoting fusion of transport vesicles with cisternae of the Golgi stack. Cell 1988;54:221‐227. [DOI] [PubMed] [Google Scholar]
- 25. Dutta AK, Khimji AK, Liu S, Karamysheva Z, Fujita A, Kresge C, et al. PKCalpha regulates TMEM16A‐mediated Cl(‐) secretion in human biliary cells. Am J Physiol Gastrointest Liver Physiol 2016;310:G34‐G42. [DOI] [PMC free article] [PubMed] [Google Scholar]
- 26. Lazaridis KN, Pham L, Tietz PS, Degroen PC, Levine S, Dawson PA, et al. Rat cholangiocytes absorb bile acids at their apical domain via the ileal sodium‐dependent bile acid transporter. J Clin Invest 1997;100:2714‐2721. [DOI] [PMC free article] [PubMed] [Google Scholar]
- 27. Wu Y, Aquino CJ, Cowan DJ, Anderson DL, Ambroso JL, Bishop MJ, et al. Discovery of a highly potent, nonabsorbable apical sodium‐dependent bile acid transporter inhibitor (GSK2330672) for treatment of type 2 diabetes. J Med Chem 2013;56:5094‐5114. [DOI] [PubMed] [Google Scholar]
- 28. McGill J, Gettys TW, Basavappa S, Fitz JG. Secretin activates Cl channels in bile duct epithelial cells through a cAMP‐dependent mechanism. Am J Physiol 1994;266:G731‐G736. [DOI] [PubMed] [Google Scholar]
- 29. Nathanson MH, Burgstahler AD, Masyuk A, LaRusso NF. Stimulation of ATP secretion in the liver by therapeutic bile acids. Biochem J 2001;358(Pt 1):1‐5. [DOI] [PMC free article] [PubMed] [Google Scholar]
- 30. Jentsch TJ, Stein V, Weinreich F, Zdebik AA. Molecular structure and physiological function of chloride channels. Physiol Rev 2002;82:503‐568. [DOI] [PubMed] [Google Scholar]
- 31. Roman RM, Wang Y, Fitz JG. Regulation of cell volume in a human biliary cell line: Calcium‐dependent activation of K+ and Cl‐ currents. Am J Physiol 1996;271:G239‐G248. [DOI] [PubMed] [Google Scholar]
- 32. Minagawa N, Nagata J, Shibao K, Masyuk AI, Gomes DA, Rodrigues MA, et al. Cyclic AMP regulates bicarbonate secretion in cholangiocytes through release of ATP into bile. Gastroenterology 2007;133:1592‐1602. [DOI] [PMC free article] [PubMed] [Google Scholar]
- 33. Fiorotto R, Amenduni M, Mariotti V, Fabris L, Spirli C, Strazzabosco M. Src kinase inhibition reduces inflammatory and cytoskeletal changes in ΔF508 human cholangiocytes and improves CFTR correctors efficacy. Hepatology 2018;67:972‐988. [DOI] [PMC free article] [PubMed] [Google Scholar]
- 34. Feranchak AP. CFTR: Actin(g) as a master regulator of cholangiocyte function. Hepatology 2017. Oct 10. doi: 10.1002/hep.29583. [Epub ahead of print] [DOI] [PubMed] [Google Scholar]
Associated Data
This section collects any data citations, data availability statements, or supplementary materials included in this article.
Supplementary Materials
Additional Supporting Information may be found at http://onlinelibrary.wiley.com/doi/10.1002/hep.29804/suppinfo.
Supporting Information 1
Supporting Information 2


