

ABSTRACT
Hepatocellular carcinoma (HCC) is a metabolically heterogeneous cancer and the use of glucose by HCC cells could impact their tumorigenicity. Dt81Hepa1-6 cells display enhanced tumorigenicity compared to parental Hepa1-6 cells. This increased tumorigenicity could be explained by a metabolic adaptation to more restrictive microenvironments. When cultured at high glucose concentrations, Dt81Hepa1-6 displayed an increased ability to uptake glucose (P<0.001), increased expression of 9 glycolytic genes, greater GTP and ATP (P<0.001), increased expression of 7 fatty acid synthesis-related genes (P<0.01) and higher levels of Acetyl-CoA, Citrate and Malonyl-CoA (P<0.05). Under glucose-restricted conditions, Dt81Hepa1-6 used their stored fatty acids with increased expression of fatty acid oxidation-related genes (P<0.01), decreased triglyceride content (P<0.05) and higher levels of GTP and ATP (P<0.01) leading to improved proliferation (P<0.05). Inhibition of lactate dehydrogenase and aerobic glycolysis with sodium oxamate led to decreased expression of glycolytic genes, reduced lactate, GTP and ATP levels (P<0.01), increased cell doubling time (P<0.001) and reduced fatty acid synthesis. When combined with cisplatin, this inhibition led to lower cell viability and proliferation (P<0.05). This metabolic-induced tumorigenicity was also reflected in human Huh7 cells by a higher glucose uptake and proliferative capacity compared to HepG2 cells (P<0.05). In HCC patients, increased tumoral expression of Glut-1, Hexokinase II and Lactate dehydrogenase correlated with poor survival (P = 2.47E−5, P = 0.016 and P = 6.58E−5). In conclusion, HCC tumorigenicity can stem from a metabolic plasticity allowing them to thrive in a broader range of glucose concentrations. In HCC, combining glycolytic inhibitors with conventional chemotherapy could lead to improved treatment efficacy.
KEYWORDS: Liver, hepatocellular carcinoma, glucose, metabolism, microenvironment
Introduction
The study of cancer cellular metabolism has led to several key findings on the impact of energy availability for cell proliferation and the importance of metabolic reprogramming in neoplastic cells [1,2]. In 1956, Otto Warburg reported for the first time aerobic glycolysis in cancer cells [3]. In contrast to normally differentiated cells that rely primarily on mitochondrial oxidative phosphorylation, cancer cells rely mainly on aerobic glycolysis to generate energy [4]. Furthermore, cancer cells can show a selective growth advantage over normal cells through their increased ability to efficiently uptake glucose, sometimes resulting in an extremely aggressive phenotype. This metabolic feature has been observed in several types of cancer including breast [5], colorectal [6] and hepatocellular carcinoma (HCC) [7].
HCC is the fifth leading cause of cancer in the world and the third leading cause of death by cancer [8]. Primary liver cancer develops in the vast majority of cases on a cirrhotic background [9]. Its most frequent causes are hepatitis B and C virus infections, alcohol-induced cirrhosis and nonalcoholic steatohepatitis [10,11]. Liver cirrhosis is characterized by extensive modifications of hepatic lobular structures with abundant accumulation of extracellular matrix [12]. This altered liver structure is thought to have a significant impact on normal hepatocytes but also on HCC tumor microenvironment and cancer cell metabolism.
Recent evidences have shown that solid tumors are exposed to various stresses such as low nutrient availability, energy depletion, hypoxia and oxidative stress during excessive growth and proliferation [1,13]. Therefore, owing to the heterogeneous distribution of oxygen, glucose and other nutrients within the tumor, neoplastic cells have to adapt to a nutritionally-restricted microenvironment. This capacity is likely to confer cancer cells a metabolic advantage over normal cells. The mechanisms that enable cancer cells to cope with this environment and sustain growth and proliferation remain poorly understood. Given the heterogeneous nature of a tumor microenvironment, especially in HCC that develops within a cirrhotic liver, adaptation mechanisms must exist in order to maintain energy and metabolic homeostasis [14,15].
Herein, we found that HCC Dt81Hepa1-6 cells, a highly tumorigenic derivative of Hepa1-6 cells [16], displayed higher metabolic plasticity than their less tumorigenic parental cell line. This metabolic versatility manifested itself through a higher rate of aerobic glycolysis in presence of glucose, but also by their ability to degrade and use fatty acids for energy in glucose-deficient microenvironments. Inhibiting Lactate dehydrogenase (Ldh) and the Warburg effect via sodium oxamate confirmed this metabolic advantage, with a drastic decrease in high-energy metabolite production and increased cell doubling time. Furthermore, the combination of sodium oxamate and cisplatin had an additive effect on reducing the viability and proliferation of Dt81Hepa1-6 cells. This metabolic-induced tumorigenicity was also noticed in human tumorigenic HCC cells, where we not only found that increased glucose uptake capacity of Huh7 was intrinsically associated with their degree of tumorigenicity but also that increased expression of glycolytic genes (Glut-1, Hexokinase II (Hk II) and Ldh) by tumor cells from HCC patients correlated with poor survival. Therefore, the tumorigenicity of HCC cells can stem from their ability to metabolically adapt to a nutrient-poor microenvironment. Given that increased expression of glycolytic enzymes also correlates with poor prognosis in HCC patients, new drugs that target these metabolic enzymes could be used to improve or potentiate current treatment regimen.
Materials and methods
Reagents
Dulbecco's Modified Eagle Medium (DMEM), Fetal Bovine Serum (FBS), Penicillin/Streptomycin, fluorescent glucose analog 2-[N-(7-nitrobenz-2-oxa-1,3-diaxol-4-yl)amino]-2- deoxyglucose (2-NBDG), TRIZOL® reagent, MitoTracker® Red CMXRos and MitoTracker® Red CM-H2XRos were purchased from Invitrogen (Burlington, On, Canada). QuantiTect reverse transcription kit and QuantiTect SYBR Green PCR Kit were purchased from QIAGEN (Toronto, On, Canada). Unless stated otherwise, all other products were from Sigma-Aldrich (Oakville, On, Canada).
Cell lines and culture conditions
Authenticated Hepa1-6 murine, Huh7 and HepG2 human hepatoma cell lines were bought from the American Type Culture Collection (Manassas, Virginia, USA). Dt81Hepa1-6 cell line was derived from Hepa1-6 cells through in vivo passage in C57BL/6 mice [16]. All cultures were maintained at 37°C and 5% CO2. Cell lines were cultured in 0, 5.5 and 25 mM glucose DMEM supplemented with 10% FBS. All culture medium contained penicillin [100units/ml] and streptomycin [100µg/ml]. If not stated otherwise, cells were seeded at 0.125M cells/cm2 for Hepa1-6, 0.25M cells/cm2 for Dt81Hepa1-6, 0.0625M cells/cm2 for Huh7 and 0.185M cells/cm2 for HepG2 to achieve 70% of cell confluence [16]. Etomoxir [40 μM] and sodium oxamate [100 mM] were used to inhibit fatty acid oxidation and glycolysis respectively [17,18].
Glucose uptake assay
Following 30 minutes of glucose starvation, Hepa1-6, Dt81Hepa1-6, Huh7 and HepG2 cells were incubated for 45 minutes in presence of a fluorescent glucose analog, 2-NBDG, at increasing concentrations [0 to 100 μM]. All subsequent steps were performed in the dark. The 2-NBDG reaction was stopped by washing cells with ice-cold phosphate-buffered saline (PBS). Glucose uptake was then quantified by measuring the fluorescent intensity of cells on a FACS BD LSRII flow cytometer (BD Biosciences, Mississauga, On, Canada). Data analysis was performed using FlowJo v10 (Tree Star, Ashland, Or, USA). Acquisition of fluorescent images was performed using a Leica Epifluorescence Microscope SP5 platform (Leica Microsystems, Richmond Hill, On, Canada). Quantitative analysis of 2-NBDG-labeled Hepa1-6 and Dt81Hepa1-6 cells was done using Fiji software (ImageJ, NIH, USA).
qPCR gene expression analysis
mRNA was isolated with TRIZOL (Invitrogen Burlington, On, Canada) according to the manufacturer instructions. 250ng of mRNA was subjected to reverse transcription using the QuantiTect Reverse Transcription Kit. Quantitative PCR amplifications were performed using the QuantiTect SYBR Green PCR Kit in a Rotor-Gene 3000 Real-Time Thermal Cycler (Corbett Research, Sydney, Australia). For each gene tested, 35 amplification cycles at 59°C (annealing) were used. The primer sequences are summarized in supplementary Table 1. Relative gene expression was evaluated using 3 reference genes: HPRT1, Ppia and H2afz [19]. Relative gene expression was calculated using the delta delta CT method [20].
HPLC analysis
All metabolites described in this study were assessed using HPLC (Agilent 1200 HPLC system, Agilent Technologies Canada Inc., Mississauga, On, Canada) by the Metabolomic Core Facility of CRCHUM. Metabolic measurements were done on Hepa1-6 and Dt81Hepa1-6 cells after a 48 hours incubation in each indicated culture conditions. Culture cells (after removal of cell culture medium) were snap frozen in liquid nitrogen and kept at -80°C until HPLC analysis. HPLC peak areas were used for quantification of identified metabolites. Total protein content (Bradford protein assay [21]), was used to normalize the metabolite quantification.
Triglyceride assay
Cellular triglyceride (TG) content was measured on Hepa1-6 and Dt81Hepa1-6 cells after 48 hours of incubation in each indicated culture conditions. Cells were harvested on ice by scraping and washed with ice cold PBS. Samples were frozen over carbonated ice and kept at -80°C. Lipids were extracted overnight from cell pellets (4°C) with chloroform:methanol (2:1) (Folch extraction) [22]. Organic phases (chloroform) were transferred into new glass tubes and dried under nitrogen (N-Evap). Lipids were resuspended in isopropanol and TG were measured enzymatically with the GPO-Trinder kit. Triolein, dissolved in chloroform-methanol and processed similarly to samples, was used as standard. To normalize the TG content, total protein content of all samples was measured using the Bradford method.
Cell doubling time
Cells were seeded at 0.09M cells/cm2 for Hepa1-6, 0.175M cells/cm2 for Dt81Hepa1-6, 0.045M cells/cm2 for Huh7 and 0.132M cells/ cm2 for HepG2 in DMEM supplemented with 10% FBS. Once cells became adherent, the medium was changed for serum-free DMEM for overnight culture. Media was finally changed with fresh DMEM supplemented with 10% FBS (time 0) and cell concentration was evaluated every 24 hours for 72 hours for each indicated culture condition. At each time point, cells were fixed, stained with crystal violet [0.05% w/v in 200mM MOPS buffer, pH6.0] and read through a Synergy HT plate reader at 570nm wavelength. Cell doubling time was evaluated using the least square fitting exponential method (Roth V. 2006, http://www.doubling-time.com/compute.php).
MTT (3-(4.5-Dimethylthiazol-2-yl)-2,5-diphenyltetrazolium bromide) proliferation and viability assay
Cells were seeded and cultured overnight. Media was then replaced with fresh DMEM (0 or 25 mM glucose) supplemented with 10% FBS. According to the experiments and the culture conditions, Etomoxir [40μM], cisplatin [25μg/mL], sodium oxamate [100 mM] or sodium oxamate+cisplatin were added for periods ranging from 0 to 72 hours. For each time point, media was removed and cells were incubated for 3 hours with 1mL of MTT solution [2mg/mL] in DMEM. Media was removed and dimethylsulfoxide (1mL) was added and plates gently shaken at room temperature for one hour. Plates were then read through a Synergy HT-spectrofluorometer plate reader at 495nm wavelength.
Mitochondrial staining
Mitochondrial membrane potential was assessed using MitoTracker® Red CMXRos fluorescent dye which accumulates in mitochondria depending on membrane potential [23]. Mitochondrial reactive oxygen species production was determined using MitoTracker® Red CM-H2XRos for which fluorescence reflects the oxidative state of live cells [24]. Sodium oxamate-treated Dt81Hepa1-6 cells were seeded in a 12-well plate and left at 37°C for 48 hours. Control cells (unstained and unstained+sodium oxamate) were processed in parallel. After 48 hours, cells were incubated with prewarmed MitoTracker® staining solution (diluted in medium to a final concentration of 200 nM for MitoTracker® Red CMXRos and 1 μM for MitoTracker® Red CM-H2XRos) for 30 minutes at 37°C. All subsequent steps were performed in the dark. The MitoTracker® reaction was stopped by washing cells with ice-cold PBS. Mitochondrial staining was then quantified by measuring the fluorescent intensity of cells in a FACS BD LSRII flow cytometer (BD Biosciences, Mississauga, On, Canada). Data analyses were performed using FlowJo v10.
HCC patient survival analysis
Survival analysis was performed using the PROGgene V2 Prognostic Database (http://watson.compbio.iupui.edu/chirayu/proggene/database/?url=proggene) as described [25,26]. Each analysis used “liver cancer” as cancer type and “death” as survival outcome. The gene expression data was extracted from The Cancer Genome Atlas (TCGA) database. The data were not adjusted for clinical status. The survival status was analyzed for expression levels of Glut-1, Hexokinase II (Hk II) and Lactate Dehydrogenase (Ldh). To analyze the prognostic value of these genes, the Kaplan-Meier method was used to estimate survival curves and the log-rank test was used to compare survival curves between high and low Glut-1, Hk II and Ldh expression level groups.
Statistical analysis
All data represent the values of at least three independent experiments. Data are expressed as means ± standard error of the mean (SEM) and analyzed with GraphPad Prism7 software. Differences between groups were analyzed using the analysis of variance (ANOVA) test, student t-test and Tukey post-test for multiple comparisons. A P value below 0.05 was considered significant (* = P<0.05, ** = P<0.01, *** = P<0.001). All statistical tests were two sided.
Results
Tumorigenic HCC cells meet their energy requirements through increased aerobic glycolysis
To assess if the enhanced tumorigenicity displayed by Dt81Hepa1-6 cells could be explained by an increased glucose-related metabolic activity [16], the rate of glucose cell uptake (a prerequisite for increased glucose utilization) was evaluated using the 2-NBDG fluorescent glucose analog. At all doses of 2-NBDG tested [0 to 100 μM], Dt81Hepa1-6 showed increased capacity to uptake glucose compared to Hepa1-6 (P<0.0001) (Fig. 1A). At a fixed 2-NBDG concentration [50 µM], Dt81Hepa1-6 cells maintained the ability to uptake larger amounts of glucose irrespective of the extracellular glucose concentrations in comparison to Hepa1-6 (P = 0.004) (Fig. 1B). Similarly, fluorescent labelling of Dt81Hepa1-6 exposed to a fixed dose of 2-NBDG revealed a greater avidity for glucose (P<0.01) (Fig. 1C). This observation was supported by a significantly higher level of expression of mRNA for glucose transporters Glut-1 and Glut-2 found in Dt81Hepa1-6 cells (Supplemental Fig. 1A, B). Next, in order to evaluate the activity of glycolytic enzymes, we quantified the mRNA expression level of several glycolytic enzymes. In presence of high glucose concentration, Dt81Hepa1-6 cells displayed increased mRNA expression levels of Hexokinase II (Hk II) (P<0.001), Glucose-6-phosphate isomerase (Gpi) (P<0.001), Phosphofructokinase liver (Pfkl) (P<0.001), Enolase (Eno) (P<0.001), Pyruvate kinase liver (Pkl) (P<0.001) and Lactate dehydrogenase (Ldh) (P<0.001) (Fig. 1D) compared to Hepa1-6. In addition, the expression level of Carbohydrate response element-binding protein (Chrebp), which is known to play a fundamental role in the induction of aerobic glycolysis in cancer cells, was also found to be elevated in Dt81Hepa1-6 cells in comparison to Hepa1-6 (P<0.01) (Supplemental Fig. 1C).
Figure 1.
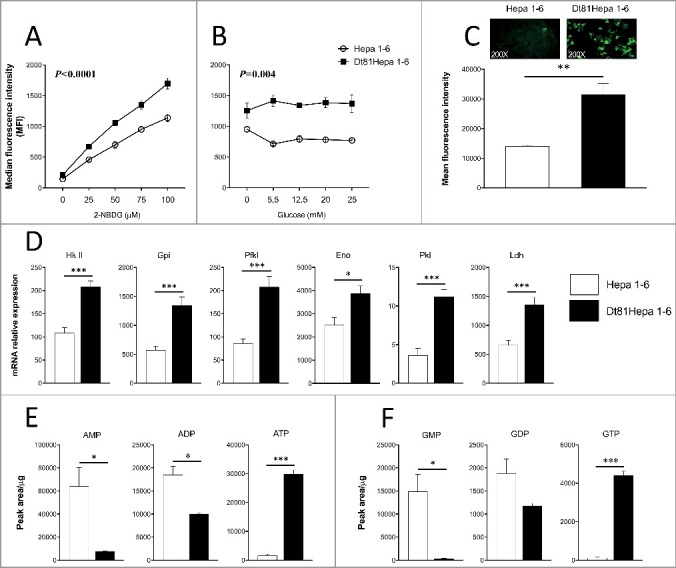
Dt81Hepa1-6 cells show an improved ability to uptake and use glucose through aerobic glycolysis. Evaluation of glucose uptake was performed using a fluorescent analog of glucose: 2-NBDG. Median fluorescence intensity analysis of glucose uptake with (A) increasing doses of 2-NBDG [0-100 μM] in glucose-free DMEM and: (B) fixed dose of 2-NBDG [50 μM] in 0 to 25 mM glucose DMEM. (C) Representative microphotographs of 2-NBDG-labeled Hepa1-6 and Dt81Hepa1-6 cells [50 μM of 2-NBDG]. (D) mRNA relative gene expression of Hexokinase II (Hk II), Glucose-6-phosphate isomerase (Gpi), Phosphofructokinase liver (Pfkl), Enolase (Eno), Pyruvate kinase liver (Pkl) and Lactate dehydrogenase (Ldh) by Hepa1-6 and Dt81Hepa1-6 cells after a 48 hours incubation in 25 mM glucose DMEM. (E-F) Quantification of total intracellular AMP, ADP, ATP and GMP, GDP, GTP in Dt81Hepa1-6 and Hepa1-6 cells after a 48 hours incubation in 25 mM glucose DMEM. Values are ±SEM of 3 independent experiments. (*P<0.05, **P<0.01, ***P<0.001).
The Warburg effect observed in tumorigenic HCC cells leads to a change in the energetic profile
In order to assess if the higher aerobic glycolysis rate displayed by tumorigenic Dt81Hepa1-6 cells led to a significant increase in the production of high energy phosphate substrates, quantification of AMP, ADP, ATP and GMP, GDP, GTP was performed under high glucose concentration. Dt81Hepa1-6 had lower contents of AMP and ADP while displaying greater ATP production than parental Hepa1-6 cells (respectively P<0.05, P<0.05, and P<0.001) (Fig. 1E). In parallel, GMP and GDP levels were also reduced (P<0.05) whereas GTP levels were approximately 40 times greater than in Hepa1-6 cells (P<0.001) (Fig. 1F). Therefore, the increased glucose uptake and aerobic glycolysis observed in Dt81Hepa1-6 cells was associated with higher levels of high-energy metabolites.
Metabolic plasticity of tumorigenic HCC cells enables them to modulate the synthesis and oxidation of fatty acids in response to changes in extracellular glucose concentrations
Fatty acids are essential for cancer cell growth and survival [27]. Since fatty acid biosynthesis could potentially impact the tumorigenic phenotype of Dt81Hepa1-6 cells, we evaluated the expression level of several enzymes involved in this process. In presence of 25 mM glucose DMEM, Dt81Hepa1-6 cells had increased mRNA expression levels of Citrate synthase (CS) (P<0.001), Citrate carrier (CiC) (P<0.001), ATP citrate lyase (Acly) (P<0.001), Acetyl-CoA carboxylase (Acc) (P<0.01), Fatty acid synthase (Fasn) (P<0.01), Glycerol phosphate acyltransferase (Gpat) (P<0.01) and Acylglycerol phosphate acyltransferase (Agpat) (P<0.01) in comparison to Hepa1-6 cells (Fig. 2A). Quantification of fatty acid biosynthesis-related metabolites also revealed significantly higher levels of Acetyl-CoA (P<0.01), Citrate (P<0.05) and Malonyl-CoA (P<0.01) in Dt81Hepa1-6 compared to parental Hepa1-6 cells (Fig. 2B). Therefore, Dt81Hepa1-6 cells have an increased ability to synthesize fatty acids in presence of high extracellular glucose concentrations. Since fatty acids can be assembled into triglycerides (TG), and that TG can release energy when broken down, we then investigated the ability of HCC cells to oxidize their stored fatty acids particularly in low extracellular glucose concentrations. To do so, 3 different concentrations of glucose were tested (0, 5.5 and 25 mM glucose DMEM), to reflect the fluctuating nutrient microenvironment found in vivo. mRNA analysis of genes involved in fatty acid oxidation revealed increased gene expression of Acyl-CoA dehydrogenase long-chain (AcadL) (P<0.001), Acyl-CoA dehydrogenase medium-chain (AcadM) (P<0.001) and Peroxisome proliferator-activated receptor gamma coactivator 1-alpha (Pgc-1α) (P<0.05) in Dt81Hepa1-6 cells cultured in low extracellular glucose concentrations (Fig. 3A-C). Parental Hepa1-6 cells that have reduced tumorigenicity did not induce the expression of fatty acid oxidation genes in any of the glucose concentrations tested (Fig. 3A-C). Furthermore, we observed significantly lower levels of intracellular TG concentrations in Dt81Hepa1-6 cells when cultured in low extracellular glucose in comparison to cells cultured in a glucose-enriched microenvironment (P<0.05) (Fig. 3D). No significant variation of TG content was found in Hepa1-6 cells which were at levels similar to the ones observed in Dt81Hepa1-6 cells at low glucose concentrations (Fig. 3D).
Figure 2.

Dt81Hepa1-6 cells showed a greater ability to synthesize fatty acids in presence of glucose. Hepa1-6 and Dt81Hepa1-6 cells were cultured in 25 mM glucose DMEM for 48 hours. (A) mRNA relative gene expression of Citrate synthase (CS), Citrate carrier (CiC), ATP citrate lyase (Acly), Acetyl-CoA carboxylase (Acc), Fatty acid synthase (Fasn), Glycerol phosphate acyltransferase (Gpat) and Acylglycerol phosphate acyltransferase (Agpat). (B) Evaluation of total intracellular Acetyl-CoA, Citrate and Malonyl-CoA. Values are ±SEM of at least 3 independent experiments. (*P<0.05, **P<0.01, ***P<0.001).
Figure 3.

In glucose-restricted condition, Dt81Hepa1-6 cells can oxidize their stored fatty acids. Hepa1-6 and Dt81Hepa1-6 cells were cultured in 0, 5.5 and 25 mM glucose DMEM for 48 hours. (A-C) mRNA relative gene expression of Acyl-CoA dehydrogenase long-chain (AcadL), Acyl-CoA dehydrogenase medium-chain (AcadM) and Peroxisome proliferator-activated receptor gamma coactivator 1-alpha (Pgc-1α). (D) Quantification of triglyceride content. Values are ±SEM of at least 8 independent experiments. (*P<0.05, **P<0.01, ***P<0.001).
Fatty acid oxidation under glucose restriction improves the viability and ability of HCC cells to proliferate
Functional tests were performed to assess if fatty acid oxidation under glucose-restricted conditions was important for the functional phenotype of HCC cells. The level of cell proliferation of tumorigenic Dt81Hepa1-6 cells was higher in low glucose concentrations in comparison to parental Hepa1-6 (cell doubling time 57.9±17.8 vs 135±28.7 hours; P<0.01) (Fig. 4A). Increasing the concentration of extracellular glucose significantly improved the ability of Hepa1-6 cells to proliferate whereas Dt81Hepa1-6 displayed similar rates of proliferation irrespective of glucose concentrations (Fig. 4A). This was associated with higher levels of GTP and ATP in Dt81Hepa1-6 cells in glucose-free DMEM compared to Hepa1-6 cells (Fig. 4B). Etomoxir, an inhibitor of fatty acid oxidation, was used to assess if the improved proliferative capacity of Dt81Hepa1-6 cells in reduced extracellular glucose conditions stemmed from their ability to metabolize fatty acids. Using the MTT proliferation and viability assay, etomoxir-treated and untreated Dt81Hepa1-6 cells displayed similar viability and proliferation at baseline (Fig. 4C). However, as time progressed, inhibition of fatty acid oxidation prevented cell proliferation and, after 72 hours, the viability of etomoxir-treated cells was significantly reduced compared to baseline (P<0.05) (Fig. 4C). In contrast, untreated Dt81Hepa1-6 cells showed significantly increased proliferation and viability after 72 hours compared to baseline (P<0.001) (Fig. 4C). To ensure that the decreased proliferation and viability of Dt81Hepa1-6 in reduced glucose conditions was not due to an inherent toxicity of Etomoxir, assessment of etomoxir-treated Dt81Hepa1-6 cell viability and proliferation was performed under high glucose conditions. Both Etomoxir-treated and untreated cells showed similar viability and proliferation after 72 hours compared to baseline (Supplemental Fig. 2).
Figure 4.

Fatty acid oxidation in low glucose concentrations improves the viability and ability of Dt81Hepa1-6 cells to proliferate. (A) Cell doubling time of Hepa1-6 and Dt81Hepa1-6 cells cultured in 0, 5.5 and 25 mM glucose DMEM for 72 hours. (B) Quantification of total intracellular GTP and ATP in Hepa1-6 and Dt81Hepa1-6 cells after a 48 hours incubation in glucose-free DMEM. (C) Proliferation/viability of Dt81Hepa1-6 cells in glucose-free DMEM following in vitro exposure to Etomoxir (Eto) [40 μM] for 72 hours compared to untreated Dt81Hepa1-6 cells. Values are ±SEM of at least 3 independent experiments. (*P<0.05, **P<0.01, ***P<0.001).
Targeting the Warburg effect prevents metabolic reprogramming of tumorigenic HCC cells
To confirm the greater metabolic plasticity of Dt81Hepa1-6 cells, sodium oxamate, a known inhibitor of glycolysis, was used. Previous studies reported a dose-dependent response to sodium oxamate by tumor cell and found that maximal inhibition of glycolysis occurred at a concentration of 100 mM [18,28]. Preliminary experiments also found a significant decrease in Lactate dehydrogenase (LDH) activity after treatment with 100 mM sodium oxamate in Dt81Hepa1-6 cells cultured at the highest glucose level (data not shown). Thus, 100 mM sodium oxamate was used thereafter to inhibit glycolysis. First, quantification of expression levels of mRNA of genes coding for several glycolytic enzymes was performed in sodium oxamate-treated and untreated Dt81Hepa1-6 cells in presence of 25 mM glucose DMEM. Sodium oxamate-treated Dt81Hepa1-6 had reduced mRNA expression levels of Hk II (P<0.001), Gpi (P<0.001), Pfkl (P<0.01), Eno (P<0.001) and Ldh (P<0.01) (Fig. 5A) when compared to untreated Dt81Hepa1-6. No significant variation was found in the expression of Pkl (Fig. 5A). In parallel, the levels of Lactate, GTP and ATP were all lower in sodium oxamate-treated Dt81Hepa1-6 cells (P<0.01) (Fig. 5B). Since we found that fatty acid metabolism enabled Dt81Hepa1-6 cells to efficiently proliferate and survive in low glucose concentrations, we then assessed if exposure to sodium oxamate could affect the ability of Dt81Hepa1-6 to synthesize fatty acids. In sodium oxamate-treated Dt81Hepa1-6, the mRNA expression levels of 5 fatty acid-related genes CS, CiC, Acly, Acc and Fasn were significantly reduced (P<0.001) (Fig. 5C). Dt81Hepa1-6 cells also had lower contents of Malonyl-CoA following sodium oxamate treatment (P<0.05) (Fig. 5D). Measurement of intracellular TG concentrations confirmed the inhibitory effect of sodium oxamate on the capacity of these cells to switch to fatty acid biosynthesis at high extracellular glucose concentrations (25 mM) (0.18±0.02 vs 0.28±0.02 μg /μg protein; P<0.05) (Fig. 5E). Moreover, in sodium oxamate-treated Dt81Hepa1-6, decreased levels of several tricarboxylic acid (TCA) metabolites including Citrate (P<0.001), α-ketoglutarate (P<0.05), Succinate (P<0.001), Fumarate (P<0.01) and Malate (P<0.001) was observed (Supplemental Fig. 3) when compared to untreated Dt81Hepa1-6.
Figure 5.

Targeting the Warburg effect prevents aerobic glycolysis and fatty acid biosynthesis in Dt81Hepa1-6 cells. Dt81Hepa1-6 cells were cultured in 25 mM glucose DMEM after a 48 hours incubation. (A) mRNA relative gene expression of Hexokinase II (Hk II), Glucose-6-phosphate isomerase (Gpi), Phosphofructokinase liver (Pfkl), Enolase (Eno), Pyruvate kinase liver (Pkl) and Lactate dehydrogenase (Ldh) in Dt81Hepa1-6 and Oxa-treated Dt81Hepa1-6 cells [100 mM] after a 48 hours incubation. (B) Quantification of total intracellular Lactate, GTP and ATP in Dt81Hepa1-6 and Oxa-treated Dt81Hepa1-6 cells [100 mM]. (C) mRNA relative gene expression of Citrate synthase (CS), Citrate carrier (CiC), ATP citrate lyase (Acly), Acetyl-CoA carboxylase (Acc) and Fatty acid synthase (Fasn) in Dt81Hepa1-6 and sodium oxamate (Oxa)-treated Dt81Hepa1-6 cells [100 mM]. (D) Quantification of total intracellular Malonyl-CoA and (E) assessment of triglyceride (TG) content, in Dt81Hepa1-6 and Oxa-treated Dt81Hepa1-6 cells [100 mM]. Values are ±SEM of at least 3 independent experiments. (*P<0.05, **P<0.01, ***P<0.001).
Inhibition of aerobic glycolysis reduces the viability and proliferation of tumorigenic HCC cells and potentiates cisplatin effect
Since the inhibition of aerobic glycolysis by sodium oxamate has the capacity to modify the metabolic profile of Dt81Hepa1-6 cells, we then assessed if it could also alter the tumorigenicity of these cells. Inhibition of aerobic glycolysis afforded by sodium oxamate significantly increased the cell doubling time of Dt81Hepa1-6 cells (92.9±15.1 vs 32.1±2.1 hours; P<0.001) (Fig. 6A). We also assessed the mitochondrial function of these cells by measuring the mitochondrial membrane potential and production of reactive oxygen species (ROS) in sodium oxamate-treated conditions since a strong correlation has been observed between mitochondrial dysfunction and tumor development/progression [29–32]. Sodium oxamate treatment significantly increased the mitochondrial membrane potential and ROS levels (respectively 25530±967 vs 9702±661 MFI; P<0.001 and 12398±825 vs 4697±497 MFI; P<0.001) (Fig. 6B, C). Based on these findings, we postulated that the inhibition of aerobic glycolysis could potentiate the chemotherapeutic effect of cisplatin on these cells. The inhibition of aerobic glycolysis with sodium oxamate by itself resulted in a reduction of cell viability and proliferation by approximately 11% (Fig. 6D). Dt81Hepa1-6 cells are partially resistant to cisplatin (25 μg/mL) when used alone with approximately a 46% reduction in viability and proliferation (Fig. 6D). However, when cells were exposed to a combination of cisplatin and sodium oxamate, we observed an additive effect with a reduction in viability and proliferation of approximately 67% (Fig. 6D).
Figure 6.

Inhibition of aerobic glycolysis reduces the viability and proliferation of Dt81Hepa1-6 cells and potentiates cisplatin chemotherapy. Dt81Hepa1-6 cells were cultured in 25 mM glucose DMEM. (A) Cell doubling time of Dt81Hepa1-6 and sodium oxamate (Oxa)-treated Dt81Hepa1-6 cells [100 mM]. (B) Assessment of mitochondrial membrane potential of Dt81Hepa1-6 and Oxa-treated Dt81Hepa1-6 cells [100 mM] using MitoTracker® Red CMXRos [200 nM]. (C) Quantification of reactive oxygen species (ROS) in Dt81Hepa1-6 and Oxa-treated Dt81Hepa1-6 cells [100 mM] using MitoTracker® Red CM-H2XRos [1 μM]. (D) Proliferation/viability of Dt81Hepa1-6 cells following in vitro exposures to sodium oxamate (Oxa) [100 mM], cisplatin (Cp) [25 mg/mL] and both sodium oxamate and cisplatin (Oxa+Cp) for 48 hours. Values are ±SEM of at least 3 independent experiments. (*P<0.05, ***P<0.001).
Increased glucose uptake correlates with the enhanced tumorigenicity of human HCC Huh7 cells
To confirm if glucose metabolism is also a tumorigenic feature of human HCC cells, we evaluated the rate of glucose uptake of human HCC Huh7 and HepG2 cells using 2-NBDG. At all doses of 2-NBDG tested [0 to 100 μM], Huh7 displayed higher capacity to uptake glucose compared to HepG2 (P = 0.0381) (Fig. 7A). Moreover, cell doubling time analysis indicated that the time required for human Huh7 to divide was significantly reduced in comparison to that of HepG2 cells (28±2.07 vs 33.93±2.01 hours respectively for Huh7 and HepG2; P<0.05) (Fig. 7B).
Figure 7.

Functional characterization of human HCC Huh7 and HepG2 cells. Evaluation of glucose uptake was performed using 2-NBDG. (A) Median fluorescence intensity analysis of glucose uptake in Huh7 and HepG2 cells with increasing doses of 2-NBDG [0-100 μM] in glucose-free DMEM. (B) Cell doubling time of Huh7 and HepG2 cells cultured in 25 mM glucose DMEM for 72 hours. Values are ±SEM of at least 4 independent experiments. (*P<0.05).
High expression of Glut-1, Hexokinase II and Lactate dehydrogenase by tumors from patients with HCC correlates with poor survival
The increased glucose uptake displayed by tumorigenic human Huh7 cells correlates with an enhanced capacity of these cells to proliferate and, in Dt81Hepa1-6 cells, targeting glycolytic genes by sodium oxamate significantly reduced their tumorigenicity. Therefore, to assess if the overexpression of glycolytic genes could be associated with an increased tumorigenicity and mortality in patients with HCC, we examined the association between Glut-1, Hexokinase II (Hk II) and Lactate dehydrogenase (Ldh) mRNA expressions and patients’ survival using publicly-available expression data sets from 293 HCC patients [25,26]. HCC patients with high Glut-1, Hk II and Ldh tumoral gene expressions have significantly decreased survival when compared to patients with low Glut-1, Hk II and Ldh expressions (Fig. 8) ((n = 293) respectively P = 2.47E−5, P = 0.016 and P = 6.58E−5).
Figure 8.

Prognostic value of Glut-1, Hk II and Ldh expressions by Hepatocellular Carcinoma (HCC) patients for survival. (A-C) Kaplan-Meier (KM) plots of overall survival probability (plotted on Y-axis) of HCC cancer patients is shown (TCGA data). Patients have been stratified into high (red lines) or low (green lines) expression-based ‘risk-groups’ by their mean of median transcript-expressions of Glut-1, Hk II and Ldh, respectively. The patient follow-up is indicated in days on the X-axis. Respective Log-rank test p-values and Hazard Ratio (HR) are shown. The numbers of patients for each group are indicated below the respective KM plots.
Discussion
The first tumor cell-specific metabolic alteration was discovered by Otto Warburg who observed increased glycolysis and lactate production by these cells. This was true even if tumors were maintained in conditions of high oxygen tension [3]. Although the Warburg effect is not universally applicable to all cancers [33], enhanced glucose uptake in tumor cells has revolutionized medical imaging by the use of the glucose analog 2-(18F)-fluoro-2-deoxy-D-glucose (FDG) for positron emission tomography (PET). FDG-PET has a sensitivity and specificity of more than 90% for the detection of metastases for most forms of epithelial cancers [34]. However, in the case of HCC, the detection of tumor foci is rendered difficult by the intense intrinsic metabolic activity of normal hepatocytes under basal physiological conditions [35,36]. Therefore, understanding energy metabolism in HCC cells is of the outmost importance both to understand how these cells can survive and grow but also to identify HCC-specific metabolites that could be used to differentiate between healthy and tumor cell in imaging techniques. The first step is to understand why HCC cancer cells have an increased glucose consumption and aerobic glycolysis and how it is important for tumor growth.
Dt81Hepa1-6 HCC cells show enhanced tumorigenicity in vivo compared to parental Hepa1-6 cell line, with more frequent and rapid tumor development [16]. We hypothesized that the greater tumorigenicity observed with Dt81Hepa1-6 cells could originate from a modification in their glucose metabolism. Dt81Hepa1-6 HCC cells show a greater ability to uptake extracellular glucose compared to Hepa1-6. In addition, they show strong evidence of increased aerobic glycolysis as demonstrated by the increased mRNA expression of glycolytic genes and increased high-energy metabolite contents. Therefore, tumorigenicity appears to be closely associated with the glycolytic activity of these cells. There are several reasons why enhanced glucose uptake and glycolytic ATP generation would constitute an advantage for tumor growth: 1) this gives a survival advantage for cancer cells in conditions of fluctuating oxygen tension that would otherwise be lethal for cells that rely mainly on the electron transport chain to generate ATP [37]; 2) by generating lactic acid, tumor cells can promote tumor invasion via the monocarboxylate transporters MCT1 and MCT2 [38]; 3) tumors can metabolize glucose through the pentose phosphate pathway to help glycolytic cancer cells to meet their anabolic demands and combat oxidative stress [39,40]; and 4) these cells could also reorient intermediates from the glycolytic pathways toward anabolic reactions that are often overexpressed in cancer [27,41].
In recent years, a growing body of evidence points towards mitochondria as having a critical function in cancer cells that, combined with the Warburg effect, could lead to metabolic reprogramming [27,29]. In contrast to the original Warburg hypothesis, many cancers maintain active mitochondria and flux through the electron transport chain to provide sufficient levels of ATP [31,32]. Cancer cells can also rely on the activation of alternative metabolic pathways such as the use of glutamine or fatty acid oxidation to cope with the lack of available glucose [27,42].
We found no significant differences in levels of monocarboxylate transporters, antioxidant-related metabolites or glutaminolysis between Dt81Hepa1-6 and parental Hepa1-6 cells suggesting that these are not involved in the increased tumorigenicity displayed by Dt81Hepa1-6 cells (data not shown). However, Dt81Hepa1-6 cells were shown not only to have an increased ability to uptake surrounding glucose but also to have a greater capacity to synthesize fatty acids in presence of high extracellular glucose, as evidenced by significant higher levels of fatty acid-related genes, as well as Acetyl-CoA, Citrate and Malonyl-CoA. Moreover, fatty acids can be assembled into TG, which is a potential important source of energy in a glucose-restricted microenvironment.
HCC develops mostly on a cirrhotic background, an environment characterized by a profound alteration in the structure of the hepatic lobule that can greatly alter nutrient availability [12]. To reproduce this environment, Hepa1-6 and Dt81Hepa1-6 cells were tested under a range of glucose concentration from below (low) and above (high) physiological levels. Dt81Hepa1-6 cells were shown to be able to use stored fatty acids for energy and growth in 0 mM glucose DMEM. When fatty acid oxidation was inhibited using etomoxir, Dt81Hepa1-6 cells lost their ability to proliferate and survive in a glucose-restricted environment. This suggests that this metabolic plasticity is crucial to their survival within a nutrient-poor microenvironment.
Analysis of gene expressions and metabolites involved in glycolysis showed significantly lower expression levels of Hk II, Gpi, Pfkl, Eno, Ldh and of Lactate, GTP and ATP in sodium oxamate-treated Dt81Hepa1-6 cells, suggesting that the glycolytic activity of tumorigenic HCC Dt81Hepa1-6 cells is strongly affected following exposure to sodium oxamate. This confirms previous observations that sodium oxamate could act as an anti-cancer agent through its ability to target the Warburg effect [18,28,43].
Since we found that Dt81Hepa1-6 cells can modulate their use of glucose according to the surrounding microenvironment, their ability to synthesize fatty acids was assessed while glycolysis was inhibited using sodium oxamate. The capacity of sodium oxamate-treated Dt81Hepa1-6 cells to synthesize fatty acids was significantly lower than controls suggesting that targeting the Warburg effect in HCC cells does not only decrease aerobic glycolysis but also prevents fatty acid biosynthesis. Interestingly, a recent study reported that lactate can be used to synthesize a large percentage of lipids in neoplastic cell lines and that decreasing lactate production through sodium oxamate led to a decrease in the mitochondrial respiratory capacity [44]. In line with this observation, two studies recently demonstrated that lactate can feed the TCA cycle in lung and pancreatic tumors [45,46]. Therefore, this suggests that in tumors, lactate should now be considered a potential source of fuel for the TCA cycle. Therefore, since reduced levels of several TCA cycle metabolites were found in Dt81Hepa1-6 cells after sodium oxamate exposure, the decreased capacity of these cells to synthesize fatty acids could be explained by a reduced lactate production leading to decreased availability of TCA cycle intermediates involved in fatty acid biosynthesis.
Inhibition of sodium oxamate also affected the capacity of Dt81Hepa1-6 cells to proliferate and increased cellular stress as evidenced by the changes observed in mitochondrial membrane potential and ROS levels, two factors often involved in cell death processes [30,32].
Recent evidence suggests that gluconeogenesis (GNG) could influence HCC cell tumorigenicity [47,48]. By switching from aerobic glycolysis to GNG, the supply of newly synthesized high-energy metabolites would be decreased and the tumorigenicity displayed by HCC cells would be reduced as well. However, we found no expression of the GNG-related genes PEPCK and G6Pase when Dt81Hepa1-6 cells were cultured in glucose-free DMEM suggesting that the de novo synthesis of glucose does not occur in these cells (data not shown).
Tumorigenic HCC Dt81Hepa1-6 cells are relatively resistant to the antineoplastic effect of cisplatin in comparison to Hepa1-6 cells [16]. However, by combining the effect of cisplatin with that of the glycolytic inhibitor sodium oxamate, cell viability of Dt81Hepa1-6 cells was significantly reduced compared to cisplatin alone. In addition, functional characterization of human HCC Huh7 and HepG2 cells revealed that increased glucose uptake of Huh7 correlates with an enhanced capacity of these cells to proliferate. Therefore, the strong glucose avidity displayed by HCC Dt81Hepa1-6 is also in use in human tumorigenic HCC cells and constitutes an essential requirement to favor an aggressive phenotype. Taken together, these data indicate that targeting the metabolic processes used by highly tumorigenic HCC cells could potentiate the effectiveness of current chemotherapeutic drugs especially in light of the correlation observed between the expression of glycolytic genes Glut-1, Hk II and Ldh in HCC tissues and overall patient survival.
In conclusion, these results show that increased tumorigenicity of HCC cells can stem from an increased metabolic plasticity allowing them to thrive in a broader range of glucose concentrations. The metabolic reprogramming of these HCC cells relies mainly on the Warburg effect in presence of glucose, but also on their ability to use fatty acids in glucose-restricted conditions. These observations were confirmed by analyzing the expression of 3 glycolytic genes in HCC tumoral tissues and patient survival. Finally, these results suggest that by combining glycolytic inhibitors as a new class of anticancer agents with conventional chemotherapy, current treatments for HCC patients could be potentiated.
Supplementary Material
Funding Statement
This work was supported by the Novartis/Canadian Liver Foundation Hepatology Research Chair at the Université de Montréal.
Acknowledgements
The authors thank Erik Joly and Julien Lamontagne of the Metabolomic Core Facility of the CRCHUM for performing the metabolomic measurements by HPLC and TG quantification. The authors also thank the laboratory of Dr. Alexandre Prat specifically, Dr. Soufiane Ghannam and Dr. Marc-André Lécuyer, for their assistance during the FACS and microscopy experiments.
Financial disclosure
The authors have no financial interest or benefit to disclose.
Conflict of interest
The authors declare no potential conflicts of interest.
References
- [1].Kroemer G, Pouyssegur J. Tumor cell metabolism: cancer's Achilles' heel. Cancer Cell. 2008;13(6):472–482. doi: 10.1016/j.ccr.2008.05.005. PMID:18538731. [DOI] [PubMed] [Google Scholar]
- [2].DeBerardinis RJ, Lum JJ, Hatzivassiliou G, et al. The biology of cancer: metabolic reprogramming fuels cell growth and proliferation. Cell Metab. 2008;7(1):11–20. doi: 10.1016/j.cmet.2007.10.002. PMID:18177721. [DOI] [PubMed] [Google Scholar]
- [3].Warburg O. On the origin of cancer cells. Science. 1956;123(3191):309–314. doi: 10.1126/science.123.3191.309. PMID:13298683. [DOI] [PubMed] [Google Scholar]
- [4].Vander Heiden MG, Cantley LC, Thompson CB. Understanding the Warburg effect: the metabolic requirements of cell proliferation. Science. 2009;324(5930):1029–1033. doi: 10.1126/science.1160809. PMID:19460998; PMCID: PMCPMC2849637. [DOI] [PMC free article] [PubMed] [Google Scholar]
- [5].Robey IF, Stephen RM, Brown KS, et al. Regulation of the Warburg effect in early-passage breast cancer cells. Neoplasia. 2008;10(8):745–756. doi: 10.1593/neo.07724. PMID:18670636; PMCID: PMCPMC2481565. [DOI] [PMC free article] [PubMed] [Google Scholar]
- [6].Sun Y, Zhao X, Zhou Y, et al. miR-124, miR-137 and miR-340 regulate colorectal cancer growth via inhibition of the Warburg effect. Oncol Rep. 2012;28(4):1346–1352. doi: 10.3892/or.2012.1958. PMID:22895557. [DOI] [PubMed] [Google Scholar]
- [7].Iansante V, Choy PM, Fung SW, et al. PARP14 promotes the Warburg effect in hepatocellular carcinoma by inhibiting JNK1-dependent PKM2 phosphorylation and activation. Nat Commun. 2015;6:7882. doi: 10.1038/ncomms8882. PMID:26258887; PMCID: PMCPMC4918319. [DOI] [PMC free article] [PubMed] [Google Scholar]
- [8].El-Serag HB, Rudolph KL. Hepatocellular carcinoma: epidemiology and molecular carcinogenesis. Gastroenterology. 2007;132(7):2557–2576. doi: 10.1053/j.gastro.2007.04.061. PMID:17570226. [DOI] [PubMed] [Google Scholar]
- [9].Fattovich G, Stroffolini T, Zagni I, et al. Hepatocellular carcinoma in cirrhosis: incidence and risk factors. Gastroenterology. 2004;127(5 Suppl 1):S35–S50. doi: 10.1053/j.gastro.2004.09.014. PMID:15508101. [DOI] [PubMed] [Google Scholar]
- [10].El-Serag HB. Epidemiology of viral hepatitis and hepatocellular carcinoma. Gastroenterology. 2012;142(6):1264–1273 e1. doi: 10.1053/j.gastro.2011.12.061. PMID:22537432; PMCID: PMCPMC3338949. [DOI] [PMC free article] [PubMed] [Google Scholar]
- [11].Cassim S, Bilodeau M, Vincent C, et al. Novel Immunotherapies for Autoimmune Hepatitis. Front Pediatr. 2017;5:8. doi: 10.3389/fped.2017.00008. PMID:28184367; PMCID: PMCPMC5266689. [DOI] [PMC free article] [PubMed] [Google Scholar]
- [12].Schuppan D, Afdhal NH. Liver cirrhosis. Lancet. 2008;371(9615):838–851. doi: 10.1016/S0140-6736(08)60383-9. PMID:18328931; PMCID: PMCPMC2271178. [DOI] [PMC free article] [PubMed] [Google Scholar]
- [13].Chaube B, Malvi P, Singh SV, et al. AMPK maintains energy homeostasis and survival in cancer cells via regulating p38/PGC-1alpha-mediated mitochondrial biogenesis. Cell Death Discov. 2015;1:15063. doi: 10.1038/cddiscovery.2015.63. PMID:27551487; PMCID: PMCPMC4979508. [DOI] [PMC free article] [PubMed] [Google Scholar]
- [14].Huang Q, Tan Y, Yin P, et al. Metabolic characterization of hepatocellular carcinoma using nontargeted tissue metabolomics. Cancer Res. 2013;73(16):4992–5002. doi: 10.1158/0008-5472.CAN-13-0308. PMID:23824744. [DOI] [PubMed] [Google Scholar]
- [15].Koppenol WH, Bounds PL, Dang CV. Otto Warburg's contributions to current concepts of cancer metabolism. Nat Rev Cancer. 2011;11(5):325–337. doi: 10.1038/nrc3038. PMID:21508971. [DOI] [PubMed] [Google Scholar]
- [16].Lacoste B, Raymond VA, Cassim S, et al. Highly tumorigenic hepatocellular carcinoma cell line with cancer stem cell-like properties. PLoS One. 2017;12(2):e0171215. doi: 10.1371/journal.pone.0171215. PMID:28152020; PMCID:. [DOI] [PMC free article] [PubMed] [Google Scholar]
- [17].Schoors S, Bruning U, Missiaen R, et al. Fatty acid carbon is essential for dNTP synthesis in endothelial cells. Nature. 2015;520(7546):192–197. doi: 10.1038/nature14362. PMID:25830893; PMCID: PMCPMC4413024. [DOI] [PMC free article] [PubMed] [Google Scholar]
- [18].Yang Y, Su D, Zhao L, et al. Different effects of LDH-A inhibition by oxamate in non-small cell lung cancer cells. Oncotarget. 2014;5(23):11886–11896. doi: 10.18632/oncotarget.2620. PMID:25361010; PMCID: PMCPMC4323009. [DOI] [PMC free article] [PubMed] [Google Scholar]
- [19].Mamo S, Gal AB, Bodo S, et al. Quantitative evaluation and selection of reference genes in mouse oocytes and embryos cultured in vivo and in vitro. BMC Dev Biol. 2007;7:14. doi: 10.1186/1471-213X-7-14. PMID:17341302; PMCID: PMCPMC1832186. [DOI] [PMC free article] [PubMed] [Google Scholar]
- [20].Livak KJ, Schmittgen TD. Analysis of relative gene expression data using real-time quantitative PCR and the 2(-Delta Delta C(T)) Method. Methods. 2001;25(4):402–408. doi: 10.1006/meth.2001.1262. PMID:11846609. [DOI] [PubMed] [Google Scholar]
- [21].Bradford MM. A rapid and sensitive method for the quantitation of microgram quantities of protein utilizing the principle of protein-dye binding. Anal Biochem. 1976;72:248–254. doi: 10.1016/0003-2697(76)90527-3. PMID:942051. [DOI] [PubMed] [Google Scholar]
- [22].Folch J, Lees M, Sloane Stanley GH. A simple method for the isolation and purification of total lipides from animal tissues. J Biol Chem. 1957;226(1):497–509. PMID:13428781. [PubMed] [Google Scholar]
- [23].Maharjan S, Oku M, Tsuda M, et al. Mitochondrial impairment triggers cytosolic oxidative stress and cell death following proteasome inhibition. Sci Rep. 2014;4:5896. doi: 10.1038/srep05896. PMID:25077633; PMCID: PMCPMC4116626. [DOI] [PMC free article] [PubMed] [Google Scholar]
- [24].Voccoli V, Tonazzini I, Signore G, et al. Role of extracellular calcium and mitochondrial oxygen species in psychosine-induced oligodendrocyte cell death. Cell Death Dis. 2014;5:e1529. doi: 10.1038/cddis.2014.483. PMID:25412308; PMCID: PMCPMC4260741. [DOI] [PMC free article] [PubMed] [Google Scholar]
- [25].Goswami CP, Nakshatri H. PROGgene: gene expression based survival analysis web application for multiple cancers. J Clin Bioinforma. 2013;3(1):22. doi: 10.1186/2043-9113-3-22. PMID:24165311; PMCID: PMCPMC3875898. [DOI] [PMC free article] [PubMed] [Google Scholar]
- [26].Goswami CP, Nakshatri H. PROGgeneV2: enhancements on the existing database. BMC Cancer. 2014;14:970. doi: 10.1186/1471-2407-14-970. PMID:25518851; PMCID: PMCPMC4300843. [DOI] [PMC free article] [PubMed] [Google Scholar]
- [27].Rohrig F, Schulze A. The multifaceted roles of fatty acid synthesis in cancer. Nat Rev Cancer. 2016;16(11):732–749. doi: 10.1038/nrc.2016.89. PMID:27658529. [DOI] [PubMed] [Google Scholar]
- [28].Zhai X, Yang Y, Wan J, et al. Inhibition of LDH-A by oxamate induces G2/M arrest, apoptosis and increases radiosensitivity in nasopharyngeal carcinoma cells. Oncol Rep. 2013;30(6):2983–2991. doi: 10.3892/or.2013.2735. PMID:24064966. [DOI] [PubMed] [Google Scholar]
- [29].Wallace DC. Mitochondria and cancer. Nat Rev Cancer. 2012;12(10):685–698. doi: 10.1038/nrc3365. PMID:23001348; PMCID: PMCPMC4371788. [DOI] [PMC free article] [PubMed] [Google Scholar]
- [30].Fulda S, Galluzzi L, Kroemer G. Targeting mitochondria for cancer therapy. Nat Rev Drug Discov. 2010;9(6):447–464. doi: 10.1038/nrd3137. PMID:20467424. [DOI] [PubMed] [Google Scholar]
- [31].Gogvadze V, Orrenius S, Zhivotovsky B. Mitochondria in cancer cells: what is so special about them? Trends Cell Biol. 2008;18(4):165–173. doi: 10.1016/j.tcb.2008.01.006. PMID:18296052. [DOI] [PubMed] [Google Scholar]
- [32].Kroemer G. Mitochondria in cancer. Oncogene. 2006;25(34):4630–4632. doi: 10.1038/sj.onc.1209589. PMID:16892077. [DOI] [PubMed] [Google Scholar]
- [33].Funes JM, Quintero M, Henderson S, et al. Transformation of human mesenchymal stem cells increases their dependency on oxidative phosphorylation for energy production. Proc Natl Acad Sci USA. 2007;104(15):6223–6228. doi: 10.1073/pnas.0700690104. PMID:17384149; PMCID: PMCPMC1851087. [DOI] [PMC free article] [PubMed] [Google Scholar]
- [34].Mankoff DA, Eary JF, Link JM, et al. Tumor-specific positron emission tomography imaging in patients: [18F] fluorodeoxyglucose and beyond. Clin Cancer Res. 2007;13(12):3460–3469. doi: 10.1158/1078-0432.CCR-07-0074. PMID:17575208. [DOI] [PubMed] [Google Scholar]
- [35].Gharib AM, Thomasson D, Li KC. Molecular imaging of hepatocellular carcinoma. Gastroenterology. 2004;127(5 Suppl 1):S153–S158. doi: 10.1053/j.gastro.2004.09.029. PMID:15508079. [DOI] [PubMed] [Google Scholar]
- [36].Lee Z, Luo G. Issues pertaining to PET imaging of liver cancer. J Fasting Health. 2014. Spring;2(2):62–64. PMID:25599084; PMCID: PMCPMC4295519. [PMC free article] [PubMed] [Google Scholar]
- [37].Pouyssegur J, Dayan F, Mazure NM. Hypoxia signalling in cancer and approaches to enforce tumour regression. Nature. 2006;441(7092):437–443. doi: 10.1038/nature04871. PMID:16724055. [DOI] [PubMed] [Google Scholar]
- [38].Swietach P, Vaughan-Jones RD, Harris AL. Regulation of tumor pH and the role of carbonic anhydrase 9. Cancer Metastasis Rev. 2007;26(2):299–310. doi: 10.1007/s10555-007-9064-0. PMID:17415526. [DOI] [PubMed] [Google Scholar]
- [39].Gatenby RA, Gillies RJ. Why do cancers have high aerobic glycolysis? Nat Rev Cancer. 2004;4(11):891–899. doi: 10.1038/nrc1478. PMID:15516961. [DOI] [PubMed] [Google Scholar]
- [40].Patra KC, Hay N. The pentose phosphate pathway and cancer. Trends Biochem Sci. 2014;39(8):347–354. doi: 10.1016/j.tibs.2014.06.005. PMID:25037503; PMCID: PMCPMC4329227. [DOI] [PMC free article] [PubMed] [Google Scholar]
- [41].Wang HQ, Altomare DA, Skele KL, et al. Positive feedback regulation between AKT activation and fatty acid synthase expression in ovarian carcinoma cells. Oncogene. 2005;24(22):3574–3582. doi: 10.1038/sj.onc.1208463. PMID:15806173. [DOI] [PubMed] [Google Scholar]
- [42].DeBerardinis RJ, Cheng T. Q's next: the diverse functions of glutamine in metabolism, cell biology and cancer. Oncogene. 2010;29(3):313–324. doi: 10.1038/onc.2009.358. PMID:19881548; PMCID: PMCPMC2809806. [DOI] [PMC free article] [PubMed] [Google Scholar]
- [43].Miskimins WK, Ahn HJ, Kim JY, et al. Synergistic anti-cancer effect of phenformin and oxamate. PLoS One. 2014;9(1):e85576. doi: 10.1371/journal.pone.0085576. PMID:24465604; PMCID: PMCPMC3897486. [DOI] [PMC free article] [PubMed] [Google Scholar]
- [44].Chen YJ, Mahieu NG, Huang X, et al. Lactate metabolism is associated with mammalian mitochondria. Nat Chem Biol. 2016;12(11):937–943. doi: 10.1038/nchembio.2172. PMID:27618187; PMCID: PMCPMC5069139. [DOI] [PMC free article] [PubMed] [Google Scholar]
- [45].Faubert B, Li KY, Cai L, et al. Lactate metabolism in human lung tumors. Cell. 2017;171(2):358–371 e9. doi: 10.1016/j.cell.2017.09.019. PMID:28985563; PMCID: PMCPMC5684706. [DOI] [PMC free article] [PubMed] [Google Scholar]
- [46].Hui S, Ghergurovich JM, Morscher RJ, et al. Glucose feeds the TCA cycle via circulating lactate. Nature. 2017;551(7678):115–118. doi: 10.1038/nature24057. PMID:29045397. [DOI] [PMC free article] [PubMed] [Google Scholar]
- [47].Ma R, Zhang W, Tang K, et al. Switch of glycolysis to gluconeogenesis by dexamethasone for treatment of hepatocarcinoma. Nat Commun. 2013;4:2508. doi: 10.1038/ncomms3508. PMID:24149070. [DOI] [PubMed] [Google Scholar]
- [48].Wang B, Hsu SH, Frankel W, et al. Stat3-mediated activation of microRNA-23a suppresses gluconeogenesis in hepatocellular carcinoma by down-regulating glucose-6-phosphatase and peroxisome proliferator-activated receptor gamma, coactivator 1 alpha. Hepatology. 2012;56(1):186–197. doi: 10.1002/hep.25632. PMID:22318941; PMCID: PMCPMC3355233. [DOI] [PMC free article] [PubMed] [Google Scholar]
Associated Data
This section collects any data citations, data availability statements, or supplementary materials included in this article.