

Abstract
Background
In end-stage liver disease, alterations in iron metabolism can lead to iron overload and development of iron overload cardiomyopathy. In liver transplant candidates, evaluation for cardiac iron overload and dysfunction can help to identify candidates at increased risk for peritransplant morbidity and mortality, though recommendations for pretransplant evaluation of cardiac iron overload are not standardized. Cardiac Magnetic Resonance Imaging T2* (CMRI-T2*) is a validated method to quantify cardiac iron deposition, with normal T2* value of 20 ms or greater. In this study, we sought to identify the incidence and predictors of iron overload by CMRI-T2* and to evaluate the impact of cardiac and iron overload on morbidity and mortality after liver transplantation.
Methods
In this retrospective single-center cohort study, all liver transplant candidates who underwent a pretransplant CMRI-T2* between January 1, 2008, and June 30, 2016, were included to analyze the association between clinical characteristics and low T2* using logistic regression.
Results
One hundred seventy-nine liver transplant candidates who received CMRI-T2* were included. Median age was 57 years, 73.2% were male, and 47.6% were white. 49.7% had hepatitis C and 2.8% had hemochromatosis. Median Model for End-Stage Liver Disease score was 25. 65.2% were Child-Pugh C. In multivariable logistic regression, T2* less than 20 ms (n = 35) was associated with Model for End-Stage Liver Disease score of 25 or greater (odds ratio [OR], 3.65; P = 0.007), Child-Pugh C (OR, 3.42; P = 0.03), and echocardiographic systolic ejection fraction less than 65% (OR, 2.24; P = 0.01). Posttransplant heart failure occurred exclusively in recipients with T2* less than 15 ms. Survival was worse in T2* 10 to 14.9 versus T2* of 20 ms or greater (hazard ratio, 3.85; P = 0.003), but not for 15 to 19.9 versus T2* of 20 ms or greater.
Conclusions
Severity of liver disease and systolic dysfunction is associated with T2* less than 20 ms, though there was no difference in posttransplant outcomes between T2* 15 to 19.9 and T2* 20 ms or greater, suggesting that individuals with T2* of 15 ms or greater may be suitable transplant candidates. CMRI-T2* is an additional diagnostic tool in evaluating transplant candidates at high risk for posttransplant cardiac complications.
Heart failure from iron overload cardiomyopathy has been well described in both hereditary hemochromatosis and in secondary iron overload from repeated blood transfusions.1-3 Iron metabolism is altered in chronic and end-stage liver disease, leading to increased risk of secondary iron overload and subsequent extrahepatic iron accumulation.4-6 Cardiac iron overload in end-stage liver disease is rare,7 but its presence may increase morbidity and mortality before and after liver transplant (LT).8-10 Pretransplant evaluation for cardiac dysfunction has improved posttransplant survival for individuals with iron overload,11 but guidelines for evaluation have not been standardized.
Laboratory abnormalities, such as elevated serum ferritin or transferrin saturation and echocardiographic features, including diastolic dysfunction and dilated cardiomyopathy, may be suggestive but ultimately fail to adequately predict significant cardiac iron overload.12,13 Although tissue biopsy is traditionally the gold standard for making the diagnosis of iron overload, the yield of endomyocardial biopsy is limited by the patchy distribution of cardiac iron and the invasive nature of the test.1 Cardiac Magnetic Resonance Imaging T2* (CMRI-T2*) is a validated method to quantify cardiac iron deposition.14 Iron deposition causes a shortening of the T2* relaxation parameter, which can be measured easily and reproducibly. Studies in thalassemia populations have demonstrated that a T2* value of 20 ms or greater is considered normal, whereas a value less than 10 ms has been associated with significant myocardial iron deposition and cardiac dysfunction, characterized by greatly increased relative risk of heart failure and symptomatic arrhythmias.15,16
The advantage of T2* over traditional echocardiography is its ability to identify cardiac iron overload before clinical or echocardiographic evidence of heart failure develops.17 Early identification of cardiac iron deposition may allow for treatment of iron overload, leading to reversal of cardiac iron overload and prevention of cardiac dysfunction.18 Despite the advantages of CMRI-T2* in identifying cardiac iron overload and feasibility in pretransplant cardiac evaluation,19 its use in pretransplant cardiac evaluation is not standardized. There are no published guidelines that recommend a T2* value below which LT should be contraindicated.
There are a limited number of studies describing the incidence of cardiac iron overload in patients being evaluated for LT. Furthermore, the impact of cardiac iron overload in patients with end-stage liver disease in the peritransplant period has not been well described. At our institution, LT candidates with predefined indicators of iron overload must undergo CMRI-T2* to assess for myocardial iron overload before being considered suitable candidates for liver transplantation. In this study, we sought to identify the incidence and predictors of iron overload (ie, T2* <20 ms) by CMRI-T2* and also to evaluate the impact of various levels of myocardial iron deposition on morbidity and mortality after liver transplantation.
MATERIALS AND METHODS
Patients and Selection Criteria
All adult patients evaluated for LT at our institution, who underwent CMRI-T2* for suspected iron overload between January 1, 2008, and June 30, 2016, were included in this retrospective cohort study. Suspected iron overload was defined as presence of 1 or more of the following: ferritin greater than 1000 μg/L on 2 separate occasions with transferrin saturation greater than 50%; high-risk HFE genotypes C282Y homozygote or C282Y/H63D compound heterozygote with serum ferritin greater than 500 μg/L or transferrin saturation greater than 40%, or liver biopsy with iron stain ≥3+ or greater. HFE genotypes heterozygous H63D, heterozygous C282Y, or homozygous H63D were considered low-risk mutations, and did not require CMRI-T2* screening independent of other risk factors for iron overload. In addition to evaluation for risk factors for cardiac iron overload, all LT candidates at our center, regardless of risk factors for iron overload, are evaluated for pulmonary hypertension, structural heart disease, and ischemic heart disease with noninvasive imaging, stress testing, and cardiac catheterization as indicated.
All data were collected from the electronic health record. Demographic data included age, sex, and race/ethnicity. Clinical variables included underlying diagnosis of liver disease, Model for End-Stage Liver Disease (MELD) score, Child-Pugh class, and iron deposition on explant for those who ultimately received a LT. Evaluation of risk for iron overload included HFE gene testing and iron studies. Assessment of cardiac function included transthoracic echocardiographic parameters (systolic ejection fraction, diastolic dysfunction, left ventricular end diastolic and systolic volume, tricuspid annular plane systolic excursion [TAPSE], and pulmonary artery systolic pressure).
All cardiac MRI examinations were performed at our institution using a 1.5-Tesla magnet (Achieva, Philips Medical Systems) read by radiologists experienced in cardiac imaging and CMRI-T2*. Cardiac MRI protocols included breath hold short axis steady state precession cine images for evaluation of left and right ventricular ejection fractions and left and right ventricular end diastolic volume indices. T2* values were obtained from the ventricular septum at the mid ventricular level on short-axis, black blood, breath hold gradient echo cardiac MRI images using a ROI placed by the technologist at the time of the examination in accordance with previously published methods.20,21 Specific scan parameters at our institution are as follows: field of view, 320 mm2; slice thickness, 10 m; flip angle, 20°; repetition time, 32 ms; shortest echo time, 2.2 ms with a delta of 1.2 ms. T2* value measurements were systematically reviewed by 1 of the study investigators to ensure that the ROI was appropriately placed in the center of the ventricular septum and did not include the chambers. At least 2 separate T2* measurements, often 3 measurements, are performed in all patients at our institution, and the average of these T2* values was used. In cases where an ROI was deemed to be inappropriately placed, that measurement was eliminated from the average.
Follow-up time was measured as the time between date of CMRI-T2* and the last clinical encounter, date of death, or date of waitlist dropout. Posttransplant heart failure was defined as systolic ejection fraction less than 50% within 1 year of transplantation.22
Our institution has maintained a policy of deferring transplantation to individuals with baseline significant systolic dysfunction (ejection fraction equal or less than 50%). Additionally, our institution has maintained a policy of declining transplantation to all individuals with T2* less than 10 ms, with careful consideration of transplant candidacy in individuals with T2* 10 to 19.9 ms. This policy was developed based on center-specific experience and thalassemia literature suggesting an increased risk of heart failure and arrhythmia at T2* values less than 10 ms and less than 20 ms, respectively.16 If cardiac parameters improved with medical management, individuals would then be reconsidered for transplantation.
Statistical Analysis
Characteristics of the cohort were summarized using the median and interquartile range (IQR) or as proportions. Cohort characteristics were compared using χ2 or Kruskal-Wallis testing, as appropriate. Both linear (for continuous T2* variable) and logistic (for categorical T2* variable) regressions were performed to evaluate variables associated with low T2* on CMRI-T2*. Backward elimination was used to select multivariable models, including candidate variables with P values of 0.1 or less. The outcome of interest was T2* category dichotomized as less than 20 ms versus 20 ms or greater and also divided into 4 groups (T2* ≥ 20 ms, T2* 15-19.9 ms, T2* 10-14.9 ms, and T2* <10 ms) with 20 ms or greater as the reference. Cox regression analysis was used to assess for survival differences among the 4 T2* groups, using T2* of 20 ms or greater, as a reference group. Time-to event curves were analyzed according to the method of Kaplan-Meier, and group comparisons were made by applying the log-rank test. A P value less than 0.05 was considered statistically significant for all analyses. Data were analyzed using STATA v13.0 (College Station, TX). Study procedures were compliant with the Health Insurance Portability and Accountability Act. The study protocol was approved by the institutional review board.
RESULTS
Cohort Characteristics
One hundred seventy-nine individuals underwent CMRI-T2* for pretransplant evaluation of cardiac iron overload during the study period. Baseline characteristics are shown in Table 1. The median age was 57 years (IQR, 50-62), 73.2% were male, and 46.6% were white. Primary disease etiology included 89 (49.7%) with hepatitis C, 18 (10.1%) with hepatitis B, 34 (19.0%) with alcoholic liver disease, and 13 (7.3%) with nonalcoholic steatohepatitis, whereas 5 (2.8%) had liver disease secondary to hemochromatosis. The median MELD at time of CMRI-T2* was 25 (IQR, 16-33). Twenty-seven (15.2%) were classified as Child-Pugh Class A, 35 (19.6%) were Child-Pugh Class B, and 116 (65.2%) were Child-Pugh Class C. High-risk HFE mutations were present in 5 (2.8%) subjects; low-risk HFE mutations were present in 24 (13.4%). Sixty-seven (37.4%) tested negative for HFE mutation, and 83 (46.4%) were not tested or results were unavailable for review. Median T2* was 28.4 ms (IQR, 22.5-34.0). One hundred forty-four (80.4%) individuals had a T2*of 20 ms or greater, 16 (8.9%) with T2* 15 to 19.9 ms, 14 (7.8%) with T2* 10 to 14.9 ms, and 5 (2.8%) with T2* less than 10 ms.
TABLE 1.
Cohort characteristics, by T2a values

Clinical Characteristics
Age, sex, ethnicity, and listing diagnosis were similar among T2* categories (Table 1). The median MELD score in the T2* ≥ 20 ms group was 24 compared with median MELD score 32 in both T2*10 to 14.9 ms and T2* 15 to 19.9 ms groups (P = 0.04). In the T2* ≥20 ms group, 86 (60.1%) were Child Pugh Class C compared with 14 (87.5%) in the T2* 15 to 19.9 ms and 12 (85.7%) in the T2* 10 to 14.9 ms groups (P = 0.12). There was no statistically significant difference in presence of high-risk HFE mutations among T2* groups.
Median serum ferritin in the T2* ≥ 20 ms group was 1416 μg/L (IQR, 1124-2124), 1369 μg/L (IQR 933-1980) in the T2* 15 to 19.9 ms group, 2520 μg/L (IQR, 1574-3875) in the T2* 10-14.9 ms group, and 1549 μg/L (IQR, 1198-2783) in the T2* <10 ms group (P = 0.06). There was no statistically significant difference in serum iron between T2* groups. Median serum transferrin saturation was highest in the T2* <10 ms group (89%) and T2* 10-14.9 ms group (91%) compared to the T2* ≥ 20 ms group (85%), which was statistically significant among groups (P = 0.02).
The median systolic ejection fraction on echocardiography was 68% (IQR, 64-73) in the T2* ≥ 20 ms group, 67% (IQR, 62-73) in the T2* 15 to 19.9 ms group, 65% (IQR, 60-68) in the T2* 10-14.9 ms group, and 57% (IQR, 49-65) in the T2* < 10 ms group (P = 0.007). Diastolic dysfunction on echocardiography was present in 43.9% of the T2* ≥ 20 ms group, 30.8% of the T2* 15 to 19.9 ms and T2* 10 to 14.9 ms groups, and 60.0% of the T2* <10 ms group (P = 0.54). Left Ventricular End Diastolic Volume Index (LVEDVI) and Left Ventricular End Systolic Volume Index (LVESVI) on echocardiography were significantly different among T2* groups (P = 0.03 and P < 0.001, respectively), with higher values in the lower T2* groups.
Cardiac MRI Characteristics
Left ventricular ejection fracture as measured by CMRI-T2* was significantly different when compared across T2* groups, which was primarily driven by a relatively lower left ventricular ejection fraction (LVEF) in patients with T2* less than 10, (LVEF of 69% in those with T2* > 20, 71% in those with T2* 15-20, 62.5% in those with T2* 10-15, and 45.5% in those with T2* <10, P = 0.01). Left Ventricular End Diastolic Volume Index measured by CMRI-T2* was also significantly different among the groups, with the largest LV volumes seen in patients with T2* less than 10 (P = 0.02).
Predictors of Low T2* < 20
In univariable logistic analysis (Table 2), factors associated with low T2* less than 20 ms included more severe liver disease defined as MELD score of 25 or greater versus MELD score less than 25 (odds ratio [OR], 3.20; 95% confidence interval [CI], 1.44-7.10; P = 0.004) and Child-Pugh Class C versus Child-Pugh Class A/B (OR, 2.79; 95% CI, 1.15-6.79; P = 0.02). Elevated serum ferritin of 5000 μg/L or greater (OR, 2.24; 95% CI 1.17-11.89, P = 0.03) was also associated with T2* less than 20 ms, but this association was not found when lower cutoff levels of ferritin were tested (eg, ferritin ≥ 2000 μg/L). Low T2* < 20 ms was associated with lower serum iron (OR, 0.32; 95% CI, 0.12-0.81, P = 0.02 for iron>167 μg/dL, (upper limit of normal) and higher transferrin saturation (OR 1.03 95% CI 1.00-1.05, P = 0.03). There was an association between low T2* less than 20 ms and systolic ejection fraction less than 65% on echocardiography (OR, 2.24; 95% CI, 1.06-4.76; P = 0.02). There was no association between low T2* less than 20 ms for CMRI-T2* systolic ejection fraction less than 65% or CMRI-T2* left ventricular end-diastolic volume index in univariable analysis. Individuals with 3 risk factors for T2* less than 20 ms (MELD ≥ 25, Child-Pugh Class C, and systolic ejection fraction<65%) were also associated with low T2* (OR, 5.04; 95% CI, 1.97-12.84; P = 0.001).
TABLE 2.
Predictors of T2a < 20 ms versus T2a ≥ 20 ms, in univariable and multivariable logistic regression
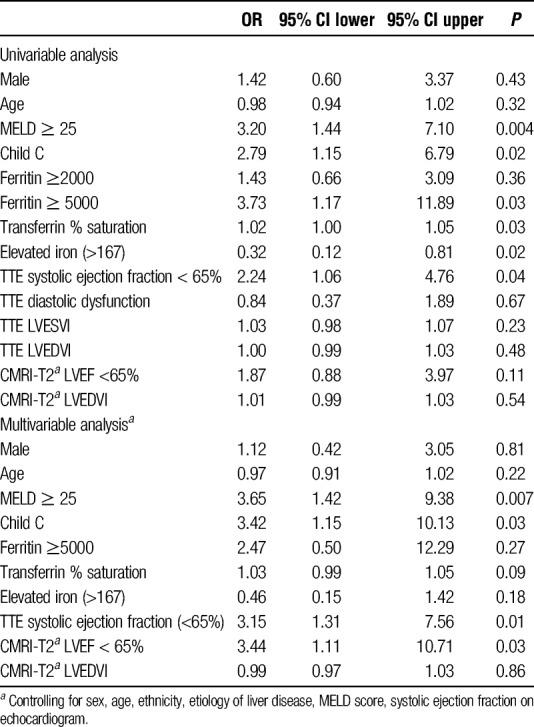
In multivariable logistic regression analysis, the association between T2* less than 20 ms and severity of liver disease persisted for both MELD score 25 or greater (OR, 3.65; 95% CI, 1.42-9.38; P = 0.007) and Child-Pugh Class C (OR, 3.42; 95% CI, 1.15-10.13; P = 0.03). The associations between T2* less than 20 ms and serum ferritin, % transferrin saturation, and serum iron demonstrated in univariable analysis did not persist on multivariable analysis. The association between T2* less than 20 ms and systolic ejection fraction less than 65% on echocardiography was also present on multivariable analysis (OR, 3.15; 95% CI, 1.31-7.56; P = 0.01). Ejection fraction less than 65% on CMRI-T2* was also associated with T2* less than 20 ms in multivariable analysis (OR, 2.56; 95% CI, 1.06-6.16; P = 0.04). Individuals with 3 risk factors for T2* less than 20 ms (MELD ≥ 25, Child-Pugh Class C, and systolic ejection fraction < 65%) had increased risk of T2* on multivariable analysis (multivariable OR, 4.56; 95% CI, 1.64-12.66, P = 0.004).
In both univariable and multivariable logistic regression analyses, age, sex, ethnicity, echocardiographic diastolic dysfunction, and CMRI-T2* LVEDVI were not associated with low T2* less than 20 ms. For individuals who received a LT, there was a trend toward 3+ or greater iron deposition on explant histology in multivariable analysis, but it did not reach statistical significance (OR, 3.27; 95% CI, 0.92-11.60; P = 0.07).
When T2* was considered as a continuous variable rather than using cutoff points (eg, T2* > 20 ms, T2* 15-19.9 ms, etc.), both univariable and multivariable linear regression models similarly found an association between severity of liver disease and systolic dysfunction on echocardiography. In multivariable linear regression, MELD score of 25 or greater was inversely correlated with T2* (coefficient, −3.84; 95% CI, −6.49 to −1.19, P = 0.005) and Child-Pugh Class C was also inversely correlated with T2* (coefficient, −6.47; 95% CI, −10.09 to −2.85; P = 0.001). Systolic ejection fraction on echocardiography was associated with T2*(coefficient, 0.43; 95% CI, 0.25-0.62, P ≤ 0.001).
Clinical Outcomes
The median time follow-up was 12.3 months (IQR, 3.3-27.1). Of the 179 individuals in the cohort, 86 (48.0%) ultimately received a LT (Table 3). Thirteen (7.3%) were declined for transplantation due to concern for cardiac iron overload. At our institution, all individuals with T2* < 10 ms (n = 5) were declined for transplantation, and those with T2* 10 to 20 (n = 30) were considered on a case-by-case basis. Of the 14 individuals with T2* 10 to 14.9 ms, 4 (28.6%) were transplanted, 5 (35.7%) were declined for transplant given concern for cardiac iron overload in combination with other comorbidities, and 4 (28.6%) were removed from the waiting list for other reasons (eg, progressive hepatocellular carcinoma, decompensated liver disease leading to death prior to transplant, relapsed substance abuse). Forty-three (24.0%) of the cohort had died by the end of the study, including 7 (8.1%) of LT recipients. In individuals with the T2* 15-19.9 ms, 11 (68.7%) were transplanted, 2 (12.5%) were declined for transplant given concern for cardiac iron overload, 1 (6.3%) was removed from the waiting list for other reasons.
TABLE 3.
Transplant and nontransplant clinical outcomes

In the LT recipients (n = 86), the median time from CMRI-T2* to transplant was 26 days (IQR 7-126). Three (3.5%) developed post-LT systolic heart failure. These 3 patients all had T2* 10-14.9 ms; only 1 transplanted patient out of 4 patients with T2* 10 to 14.9 ms did not develop post-LT systolic heart failure. One patient required extra corporeal membrane oxygenation secondary to posttransplant heart failure and subsequently died, 1 patient is still alive with compensated heart failure with systolic ejection fraction of 35% to 40%, and the third patient developed immediate posttransplant heart failure with systolic ejection fraction less than 20% that improved to 55% 2 weeks after transplant with medical management alone.
There was no statistically significant difference in all-cause mortality in the T2* < 20 ms group compared to T2* ≥ 20 ms (hazard ratio [HR], 1.72 95% CI 0.81-3.65, P = 0.16). However, all-cause mortality was greater among patients with T2* 10 to 14.9 ms compared to T2* ≥ 20 ms (unadjusted HR 3.85 95% CI 1.58-9.43, P = 0.003), with similar risk of death between T2* 15 to 19.9 ms and T2* ≥ 20 ms groups (unadjusted HR, 0.93; 95% CI, 0.28-3.05; P = 0.90) (Figure 1). Among individuals who ultimately underwent LT, there was no statistically significant difference in survival for T2* 10 to 14.9 ms compared to T2* ≥20 ms (unadjusted HR, 2.45; 95% CI, 0.28-21.53) or for T2* 15 to 19.9 ms compared with T2* ≥ 20 ms (unadjusted HR, 1.39; 95% CI, 0.16-11.93; P = 0.65) (Figure 2). All individuals with T2* less than 10 ms did not receive a LT, and so were excluded from this survival analysis. Systolic ejection fraction measured by echocardiography or CMRI-T2* failed to predict survival in all subjects and those who underwent transplant.
FIGURE 1.
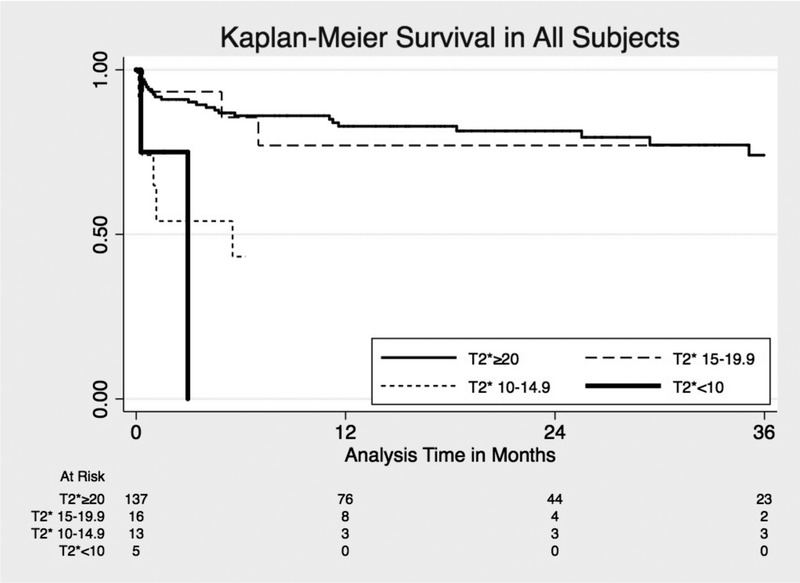
Kaplan-Meier survival estimates for all-cause mortality by T2*.
FIGURE 2.
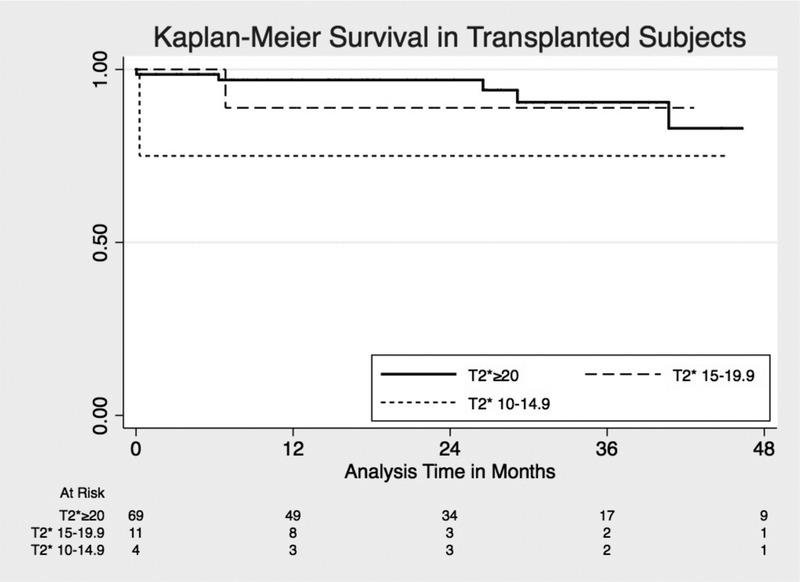
Kaplan-Meier survival estimates for posttransplant survival by T2*.
DISCUSSION
Systemic iron overload is common in end-stage liver disease and may result in secondary iron overload cardiomyopathy. A number of methods to evaluate cardiac iron overload are available, though they are not without limitation. Serum iron studies are easily obtained but are nonspecific. Echocardiography provides detailed information about cardiac function, but is unable to quantify cardiac iron accumulation.3 Quantification of myocardial iron load with cardiac biopsy is invasive with risk of complications. CMRI-T2* provides a safe, noninvasive, and quantitative way to measure cardiac iron overload and function,15 but its role in evaluation of cardiac iron overload in LT candidates has not been well studied.
This is the first study to evaluate clinical predictors of low T2* < 20 ms in LT candidates. This study found that more severe liver disease, including MELD score of 25 or greater and Child Pugh Class C, was associated with increased risk of low T2* less than 20 ms. Additionally, systolic ejection fraction <65% was associated with T2* less than 20 ms. Patients with end-stage liver disease often have normal or slightly elevated systolic ejection fraction in the setting of hyperdynamic circulation.23,24 Thus, systolic ejection fraction in the low range of normal may be an early predictor of cardiac iron overload. Although iron indices, such as elevated ferritin and transferrin saturation, were associated with T2* less than 20 ms on unadjusted analysis, these did not reach statistical significance in multivariable modeling. Individuals with all 3 risk factors for T2* less than 20 ms (MELD ≥ 25, Child-Pugh Class C, and systolic ejection fraction < 65%) had a fivefold increased risk of low T2*. Individual risk factors or a composite of all 3 risk factors may help to identify LT candidates at greatest risk for cardiac iron overload.
This study confirms previous studies in patients with thalassemia, sickle cell disease, myelodysplastic syndromes, and idiopathic cardiomyopathy, that systolic dysfunction, in particular, decreased systolic ejection fraction on echocardiogram, is associated with low T2*.25-27 It is notable that in systolic ejection fraction, less than 65%, which includes values often considered “normal,” was associated CMRI-T2*. This suggests that CMRI-T2* may be able to detect subtler differences in cardiac dysfunction than traditional echocardiography and can be useful to identify LT recipients at risk for posttransplant complications despite relatively normal echocardiographic findings. Elevated ferritin did not predict low T2*, as seen in previous studies in individuals with beta-thalassemia and sickle cell disease.28,29 Our study found that liver disease severity by MELD score and Child-Pugh Class is associated with low T2*, which is supported by evidence that more severe liver disease is associated with increased hepatic siderosis,30 though a small (n = 14) cohort study did not find a significant difference in MELD score between individuals with and without cardiac iron deposition on cardiac biopsy.7
The use of CMRI-T2* in the pretransplant evaluation seeks to identify those individuals with cardiac iron overload that may have poor posttransplant outcomes. In our cohort, nearly 20% of patients had T2* less than 20 ms indicating significant iron overload. Individuals with T2* less than 10 ms at our institution were excluded from LT given the concern for posttransplant heart failure and mortality. The risk of posttransplant heart failure in individuals with low T2* has not previously been elucidated. The present study shows that the risk of posttransplant heart failure increases with decreasing T2* levels within the 10 to 20 ms range. Whereas none of the 11 transplant recipients with a T2* 15 to 20 developed posttransplant heart failure, 75% (3 of 4) of transplant recipients with a T2*10 to 14.9 ms did develop posttransplant heart failure. Careful consideration should be given to determine the transplant candidacy of individuals with T2* 10 to 14.9 ms. If patients with T2* less than 15 ms are ultimately listed for transplant, cardiology consultation is advisable to optimize these patients both before and after transplant. It is possible that use of phlebotomy or chelation therapy in patients with lower values, even in the 15 to 19.9 ms range may help to improve posttransplant outcomes. Studies evaluating treatment effects on patients with low T2* are needed.
Although T2* less than 20 ms is often used as the definition for significant cardiac iron overload,31 our study demonstrated that there was no significant difference in mortality or posttransplant outcomes between patients with T2* 15 to 19.9 ms and ≥ 20 ms. There was no posttransplant heart failure identified in either group nor difference in clinical predictors for individuals with T2* 15 to 19.9 ms compared with 20 ms or greater. This suggests that individuals with “borderline” T2* 15 to 19.9 ms could safely undergo LT without significant additional risk compared with T2* ≥ 20 ms. Further analysis of posttransplant survival and heart failure in a larger cohort could help address this question further.
This study included the largest cohort to date describing the use of CMRI-T2* in LT candidate evaluation, all of whom received CMRI-T2* at a high-volume LT center and read by radiologists experienced in cardiac MRI. However, there were several notable limitations of the current study. This was a single-center cohort with a small proportion of individuals with T2* less than 20 ms, which limited the ability to analyze smaller, but potentially clinically meaningful, differences among T2* groups. In particular, the small number of events, such as post-LT heart failure and death, increases the likelihood that the difference between groups occurred by chance and may be explained by some other clinical characteristic between the groups rather than cardiac iron overload as measured by CMRI-T2*. Additionally, study was restricted to patients listed for LT and may have missed individuals with low T2* and cardiac iron overload who did not complete a full transplant evaluation. The majority of patients in the cohort had high MELD scores and was Child-Pugh Class C, which may not be generalizable to other centers. It is also possible that our institution’s selection criteria for performing CMRI-T2* may not have captured all LT candidates with cardiac iron overload, because patients with significant systolic dysfunction on echocardiogram were typically excluded as LT candidates and may not have received further testing with CMRI-T2*, thus being excluded from our study. CMRI-T2* is a validated method for determining cardiac iron overload. Due to the invasive nature of endomyocardial biopsy, the correlation between CMRI-T2* and cardiac iron has not been specifically validated at our center. Finally, individuals with T2* less than 10 ms were declined by institutional policy, and some individuals with “borderline” T2* 10 to 14.9 ms were also declined based on concern for significant cardiac iron overload; the true post-LT heart failure rate in these individuals remains unknown.
In summary, this study describes several clinical risk factors including more severe liver disease and transthoracic echocardiogram EF less than 65% associated with low T2* among LT candidates, which may help identify individuals at risk for iron overload. Use of cardiac MRI T2* prior to transplant may further identify individuals with significant cardiac iron deposition that may have unfavorable posttransplant outcomes. Importantly, patients with a T2* ≥15 ms had excellent posttransplant outcomes, whereas patients with T2* 10 to 14.9 ms may have worse outcomes, suggesting that T2* ≥ 15 ms may be an appropriate cutoff for transplant consideration.
Footnotes
Published online 8 June, 2018.
The authors declare no funding or conflicts of interest.
S.M.L. participated in writing of the article, performance of the research, data analysis, and research design. K.K. participated in writing of the article, performance of the research, data analysis, and research design. M.I.N. participated in writing of the article, performance of the research, data analysis, and research design. S.Z. participated in writing of the article and research design. O.K.F. participated in writing of the article and research design. G.C.B. participated in research design and performance. T.D.M. participated in research design. A.N.Q. participated in writing of the article and research design. K.G.O. participated in writing of the article, performance of the research, and research design. N.M. participated in writing of the article, performance of the research, data analysis, and research design.
REFERENCES
- 1.Gujja P, Rosing DR, Tripodi DJ, et al. Iron overload cardiomyopathy. J Am Coll Cardiol. 2010;56:1001–1012. [DOI] [PMC free article] [PubMed] [Google Scholar]
- 2.Gulati V, Harikrishnan P, Palaniswamy C, et al. Cardiac involvement in hemochromatosis. Cardiol Rev. 2014;22:56–68. [DOI] [PubMed] [Google Scholar]
- 3.Kremastinos DT, Farmakis D. Iron overload cardiomyopathy in clinical practice. Circulation. 2011;124:2253–2263. [DOI] [PubMed] [Google Scholar]
- 4.Abu Rajab M, Guerin L, Lee P, et al. Iron overload secondary to cirrhosis: a mimic of hereditary haemochromatosis? Histopathology. 2014;65:561–569. [DOI] [PubMed] [Google Scholar]
- 5.Eng SC, Taylor SL, Reyes V, et al. Hepatic iron overload in alcoholic end-stage liver disease is associated with iron deposition in other organs in the absence of HFE-1 hemochromatosis. Liver Int. 2005;25:513–517. [DOI] [PubMed] [Google Scholar]
- 6.Fenton H, Torbenson M, Vivekanandan P, et al. Marked iron in liver explants in the absence of major hereditary hemochromatosis gene defects: a risk factor for cardiac failure. Transplantation. 2009;87:1256–1260. [DOI] [PubMed] [Google Scholar]
- 7.O'Glasser AY, Scott DL, Corless CL, et al. Hepatic and cardiac iron overload among patients with end-stage liver disease referred for liver transplantation. Clin Transplant. 2010;24:643–651. [DOI] [PubMed] [Google Scholar]
- 8.Farrell FJ, Nguyen M, Woodley S, et al. Outcome of liver transplantation in patients with hemochromatosis. Hepatology. 1994;20:404–410. [PubMed] [Google Scholar]
- 9.Jermyn R, Soe E, D'Alessandro D, et al. Cardiac failure after liver transplantation requiring a biventricular assist device. Case Rep Transplant. 2014;2014:946961. [DOI] [PMC free article] [PubMed] [Google Scholar]
- 10.Kowdley KV, Brandhagen DJ, Gish RG, et al. Survival after liver transplantation in patients with hepatic iron overload: the national hemochromatosis transplant registry. Gastroenterology. 2005;129:494–503. [DOI] [PubMed] [Google Scholar]
- 11.Yu L, Ioannou GN. Survival of liver transplant recipients with hemochromatosis in the United States. Gastroenterology. 2007;133:489–495. [DOI] [PubMed] [Google Scholar]
- 12.Murphy CJ, Oudit GY. Iron-overload cardiomyopathy: pathophysiology, diagnosis, and treatment. J Card Fail. 2010;16:888–900. [DOI] [PubMed] [Google Scholar]
- 13.Alizad A, Seward JB. Echocardiographic features of genetic diseases: part 2. Storage disease. J Am Soc Echocardiogr. 2000;13:164–170. [DOI] [PubMed] [Google Scholar]
- 14.Carpenter JP, He T, Kirk P, et al. On T2* magnetic resonance and cardiac iron. Circulation. 2011;123:1519–1528. [DOI] [PMC free article] [PubMed] [Google Scholar]
- 15.Anderson L. Cardiovascular T2-star (T2*) magnetic resonance for the early diagnosis of myocardial iron overload. Eur Heart J. 2001;22:2171–2179. [DOI] [PubMed] [Google Scholar]
- 16.Kirk P, Roughton M, Porter JB, et al. Cardiac T2* magnetic resonance for prediction of cardiac complications in thalassemia major. Circulation. 2009;120:1961–1968. [DOI] [PMC free article] [PubMed] [Google Scholar]
- 17.Pennell DJ. T2* magnetic resonance: iron and gold. JACC Cardiovasc Imaging. 2008;1:579–581. [DOI] [PubMed] [Google Scholar]
- 18.Chow CH, El-Amm C, Liu W, et al. Reversal of severe biventricular dysfunction from cardiac hemochromatosis with iron removal. Circ Heart Fail. 2013;6:e14–e15. [DOI] [PubMed] [Google Scholar]
- 19.Reddy ST, Thai NL, Fakhri AA, et al. Exploratory use of cardiovascular magnetic resonance imaging in liver transplantation: a one-stop shop for preoperative cardiohepatic evaluation. Transplantation. 2013;96:827–833. [DOI] [PubMed] [Google Scholar]
- 20.He T, Gatehouse PD, Kirk P, et al. Black-blood T2* technique for myocardial iron measurement in thalassemia. J Magn Reson Imaging. 2007;25:1205–1209. [DOI] [PubMed] [Google Scholar]
- 21.Messroghli DR, Moon JC, Ferreira VM, et al. Clinical recommendations for cardiovascular magnetic resonance mapping of T1, T2, T2* and extracellular volume: a consensus statement by the Society for Cardiovascular Magnetic Resonance (SCMR) endorsed by the European Association for Cardiovascular Imaging (EACVI). J Cardiovasc Magn Reson. 2017;19:75. [DOI] [PMC free article] [PubMed] [Google Scholar]
- 22.Qureshi W, Mittal C, Ahmad U, et al. Clinical predictors of post-liver transplant new-onset heart failure. Liver Transpl. 2013;19:701–710. [DOI] [PubMed] [Google Scholar]
- 23.Laffi G, Barletta G, La Villa G, et al. Altered cardiovascular responsiveness to active tilting in nonalcoholic cirrhosis. Gastroenterology. 1997;113:891–898. [DOI] [PubMed] [Google Scholar]
- 24.Mandell MS, Tsou M-Y. Cardiovascular dysfunction in patients with end-stage liver disease. J Chin Med Assoc. 2008;71:331–335. [DOI] [PubMed] [Google Scholar]
- 25.Bowen DT, Hellström-Lindberg E, Steensma DP. Cardiac iron overload assessed by T2* magnetic resonance imaging and cardiac function in regularly transfused myelodysplastic syndrome patients. Br J Haematol. 2014;164:610–611. [DOI] [PubMed] [Google Scholar]
- 26.Said Othman KM, Elshazly SA, Heiba NM. Role of non-invasive assessment in prediction of preclinical cardiac affection in multi-transfused thalassaemia major patients. Hematology. 2014;19:380–387. [DOI] [PubMed] [Google Scholar]
- 27.Kanzaki Y, Yuki M, Yamamura K-I, et al. Is cardiac and hepatic iron status assessed by MRI T2* associated with left ventricular function in patients with idiopathic cardiomyopathy? Heart Vessels. 2016;31:1950–1959. [DOI] [PubMed] [Google Scholar]
- 28.Yuksel IO, Koklu E, Kurtoglu E, et al. The association between serum ferritin level, tissue Doppler echocardiography, cardiac T2* MRI, and heart rate recovery in patients with beta thalassemia major. Acta Cardiol Sin. 2016;32:231–238. [DOI] [PMC free article] [PubMed] [Google Scholar]
- 29.Wood JC, Tyszka JM, Carson S, et al. Myocardial iron loading in transfusion-dependent thalassemia and sickle cell disease. Blood. 2004;103:1934–1936. [DOI] [PubMed] [Google Scholar]
- 30.Kayali Z, Ranguelov R, Mitros F, et al. Hemosiderosis is associated with accelerated decompensation and decreased survival in patients with cirrhosis. Liver Int. 2005;25:41–48. [DOI] [PubMed] [Google Scholar]
- 31.De Montalembert M, Ribeil JA, Brousse V, et al. Cardiac iron overload in chronically transfused patients with thalassemia, sickle cell anemia, or myelodysplastic syndrome. PLoS One. 2017;12:e0172147. [DOI] [PMC free article] [PubMed] [Google Scholar]