Abstract
Vascular calcification (VC) is associated with significant morbidity and mortality of dialysis patients. Previous studies showed an association between loss of plasma pyrophosphate and VC. Moreover, loss of pyrophosphate occurs during dialysis in this population, suggesting that therapeutic approaches that prevent reduction of plasma pyrophosphate levels during dialysis could improve the quality of life of dialysis patients. This study found that pyrophosphate hydrolysis was 51% higher in post- than pre-dialysis plasma. Dialysis sessions modified the kinetic behavior of alkaline phosphatase, increasing its Vmax and reducing its Km, probably due to the elimination of uremic toxins during dialysis. At least 75% of alkaline phosphatase activity in human plasma was found to depend on a levamisole-sensitive enzyme probably corresponding to tissue non-specific alkaline phosphatase (TNAP). Dialysis increased total plasma protein concentration by 14% and reduced TNAP enzyme by 20%, resulting in an underestimation of pyrophosphate hydrolysis in post-dialysis plasma. Levamisole inhibited TNAP activity (IC50, 7.2 µmol/L), reducing pyrophosphate hydrolysis in plasma and increasing plasma pyrophosphate availability. Alkaline phosphatase is also found in many tissues and cells types; therefore, our results in plasma may be indicative of changes in phosphatase activity in other locations that collectively could contribute significantly to pyrophosphate hydrolysis in vivo. In conclusion, these findings demonstrate that dialysis increases pyrophosphate hydrolysis, which, taken together with previously reported increases in alkalization and calcium ion levels in post-dialysis plasma, causes VC and could be prevented by adding calcification inhibitors during dialysis.
Introduction
Vascular calcification is a common complication in hemodialysis patients and is associated with cardiovascular events and all-cause mortality1. Hyperphosphatemia is a typical clinical manifestation in these patients. Increases in plasma phosphate levels have been associated with the prevalence of calcification2 due to the spontaneous formation of calcium-phosphate crystals3. Moreover, calcification has been found to contribute to the substantial morbidity and mortality rates in this patient population4,5.
There are two major consequences regarding the fate of vascular smooth muscle cells in phosphate-induced calcification6,7. The first involves a profound transition to a bone-forming phenotype, that results in the loss of vascular smooth muscle cells markers and the expression of osteochondrogenic markers8,9. The second consequence invokes apoptosis-dependent matrix mineralization, which has been detected both in cultured humans vascular smooth muscle cells10,11 and in arteries from pediatric dialysis patients12.
Pyrophosphate is the main endogenous inhibitor of calcium-phosphate crystal formation and growth in vitro13–15 and in vivo16–19. Reductions in plasma pyrophosphate concentrations have been associated with vascular calcification20. Pyrophosphate is generated enzymatically via the hydrolysis of extracellular ATP by the enzyme ectonucleotide pyrophosphatase/phosphodiesterase (eNPP)21, and pyrophosphate is degraded to inorganic phosphate (Pi) mainly by tissue non-specific alkaline phosphatase (TNAP)22. Overexpression of TNAP in vascular smooth muscle cells is sufficient to cause ex vivo calcification in aortic rings22, and murine models with increased expression and activity of TNAP have demonstrated excessive vascular calcification22,23.
Reductions in plasma pyrophosphate levels after dialysis24,25 may be due to increases in phosphatase activity25. To expand on these findings, this study analyzed the kinetic behavior of alkaline phosphatase activity in plasma from hemodialysis patients, the effect of dialysis on pyrophosphate hydrolysis, and the effect of alkaline phosphatase inhibition on pyrophosphate availability.
Results
Alkaline phosphatase kinetic behavior in plasma is altered by dialysis
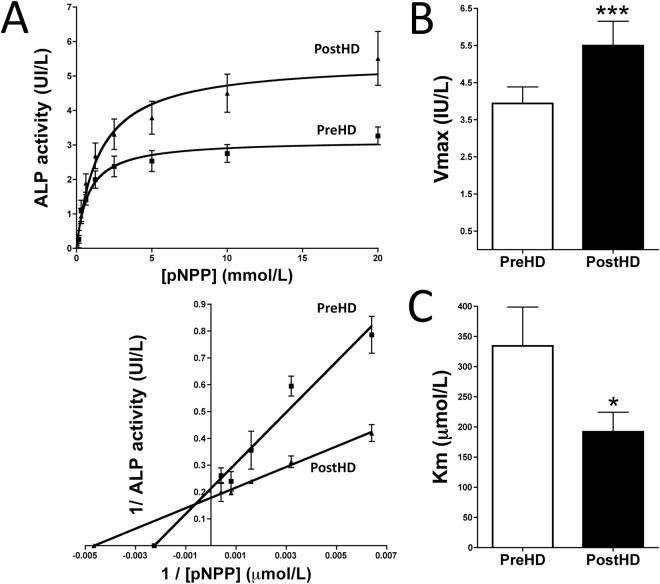
To analyze the kinetic behavior of plasma alkaline phosphatase, saturation kinetics for p-nitrophenyl phosphate (pNPP) hydrolysis in 40 pairs of samples were fitted to a Michaelis-Menten equation, V = (Vmax S)/(Km + S), where V is the velocity of pNPP hydrolysis, Vmax is the maximal velocity or capacity of pNPP hydrolysis, S is the concentration of pNPP and Km is the affinity constant. Analysis of the enzyme kinetics of plasma alkaline phosphatase showed that its Vmax was ∼40% higher (5.50 ± 0.66 IU/L vs. 3.94 ± 0.44 IU/L, P < 0.001) and its apparent Km was significantly lower (192.0 ± 32.5 μmol/L vs. 334.5 ± 64.2 μmol/L, P < 0.05) after than before dialysis (Fig. 1).
Figure 1.
Kinetic analysis of ALP activity in plasma samples before and after dialysis. (A) Representative Michaelis-Menten saturation curves to determine the Km and Vmax of pNPP hydrolysis in pre- and post-dialysis plasma samples under physiological conditions (top). Representative Lineweaver-Burk plot (bottom). The curves for each patient were used to determine Vmax (B) and Km (C) using nonlinear regression, as described in the Methods section. Results are presented as mean ± SEM (n = 40), and were compared by the Wilcoxon matched pairs test. *P < 0.05; ***P < 0.001.
TNAP is the main phosphatase in human plasma
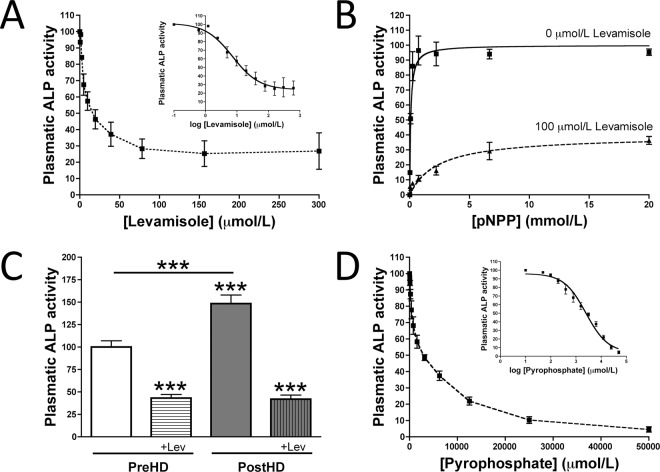
To ascertain the effect of alkaline phosphatase inhibitors on the availability of plasma pyrophosphate, we first analyzed the inhibitory kinetics of levamisole, a known inhibitor of TNAP activity, in human plasma. In this case pNPP has been also used as substrate. Levamisole had an IC50 of 7.2 µmol/L, with a concentration of 100 µmol/L completely inhibiting alkaline phosphatase activity (Fig. 2A). A dose-response analysis of plasma ALP substrate after hemodialysis showed that 100 µmol/L levamisole reduced the Vmax of ALP activity to 24% of that of the control (Fig. 2B,C) shown that the levamisole-sensitive phosphatase is the main component increased after dialysis. Finaly, pyrophosphate had an IC50 of 2477 µmol/L, which correspond with a Ki (Km for pyrophosphate) of 611.9 µmol/L pyrophosphate (Fig. 2D).
Figure 2.
Tissue non-specific alkaline phosphatase (TNAP) is the main phosphatase in human plasma. (A) Kinetic characterization of levamisole inhibition of pNPP hydrolysis. (B) Michaelis-Menten saturations curves to determine the Km and Vmax of plasma pNPP hydrolysis in the absence (−) or presence (+) of levamisole. (C) Plasmatic ALP activity in pre- and post-hemodialysis plasma (PreHD and PostHD, respectively) in absence and presence of 100 µmol/L levamisole (+Lev). (D) Kinetic characterization of pyrophosphate inhibition of pNPP hydrolysis. Results are presented as mean ± SEM of nine pools of post-hemodialysis plasma samples in three independent experiments.
Plasma pyrophosphate hydrolysis increases following dialysis
Pyrophosphate hydrolysis was quantified as 32-phosphate (32Pi) released from the hydrolysis of 32-pyrophosphate (32PPi) in plasma. 32Pi and 32PPi were separated by chromatography on PEI-cellulose plates and counted by liquid scintillation. 32PPi hydrolysis in plasma was linear over 8 hours (Fig. 3). After 4 hours of incubation, 32PPi hydrolysis in plasma was 51% higher after than before dialysis (11.2% ± 5.0% vs. 7.4% ± 2.7%, P < 0.001; Fig. 3). This correspond with a plasma pyrophosphate hydrolysis of 370 fmol * hour−1 * µL−1 (pre-dialysis) and 560 fmol * hour−1 * µL−1 (post-dialysis).
Figure 3.
Pyrophosphate hydrolysis in plasma is higher in patients after than before dialysis. Plasma samples obtained before and after dialysis were incubated for for the indicated time with 5 μmol/L pyrophospahte and 32-pyrophosphate (32PPi) as a radiotracer. A 5 μL aliquot of each sample was separated by thin layer chromatography. After radiography, the spots were excised and added to liquid scintillation fluid. Pyrophosphate hydrolysis was quantified as percent 32-phosphate (32Pi) produced relative to total CPM (32Pi + 32PPi) and represented as fmol pyrophosphate hydrolyzed per hour and per μL of plasma sample (fmol*hour−1*μL−1). (A) Pyrophosphate hydrolysis in post-hemodialysis plasma for the indicated time. Results are presented as mean ± SEM (n = 9). (B) Representative radiography of a thin layer chromatograph showing 32Pi and 32PPi after incubation for 4 hours. (C) Pyrophosphate hydrolysis in plasma samples before (PreHD) and after (PostHD) dialysis after incubation for 4 hours. Results are presented as mean ± SEM (n = 40), and were compared by the Wilcoxon matched pairs test. ***P < 0.001.
Inhibition of TNAP activity increases pyrophosphate availability
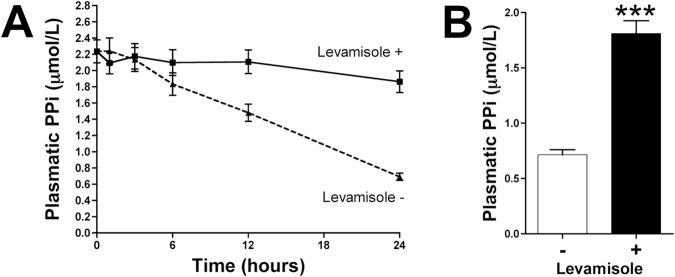
Addition of 100 µmol/L levamisole to post-hemodialysis plasma samples reduced pyrophosphate hydrolysis over time (Fig. 4A) and increased pyrophosphate availability after 24 hours (Fig. 4B). In the absence of levamisole, plasma pyrophosphate was markedly hydrolyzed.
Figure 4.
Inhibition of tissue non-specific alkaline phosphatase increases pyrophosphate availability in human plasma. Post-hemodialysis plasma samples were incubated at 37 °C in the absence (−) or presence (+) of 100 µmol/L levamisole. (A) Quantification of plasma pyrophosphate levels (n = 8) at the indicated times. (B) Quantification of pyrophosphate levels in post-hemodialysis plasma samples (n = 40) after incubation for 24 hours. Results are presented as mean ± SEM, and were compared by the Wilcoxon matched pairs test. ***P < 0.001.
Loss of TNAP despite an increase in protein concentration after dialysis
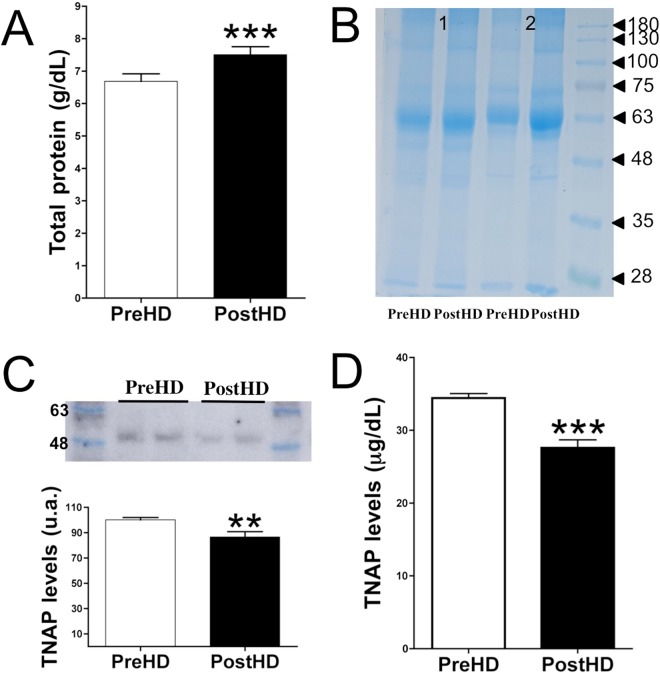
Plasma protein concentration was found to be ~14% higher after than before dialysis (7.34 ± 0.22 g/dL vs. 6.42 ± 0.19 g/dL, P < 0.001; Fig. 4A). Coomassie Brilliant Blue staining revealed similar findings after proteins were separated by molecular weight (Fig. 4B). Immunoblotting with TNAP antibody showed that the plasma concentration of this ∼53 kDa protein was significantly lower after than before dialysis (∼13%; P = 0.0063; Fig. 4C and Supplementary Info File). Moreover, TNAP quantification by ELISA (Fig. 4D) showed that the level of this protein was ~20% lower after than before dialysis (27.59 ± 1.10 µg/dL vs. 34.43 ± 0.62 µg/dL, P < 0.001; Fig. 4D).
Phosphate inhibit pyrophosphate hydrolysis in rat aortic wall
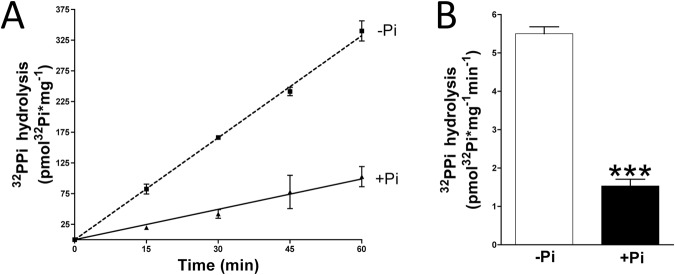
Aortas were obtained from euthanized rats and digested over 10 min in order to remove the adventitia layer. Then, pyrophosphate hydrolysis assay in absence of phosphate was first performed. Then, after washing five times in MEM media without phosphate, the same aortic rings were used for pyrophosphate hydrolysis assay in presence of 1 mmol/L phosphate. Pyrophosphate hydrolysis was found to be 3.7-fold higher (Fig. 6) in absence of phosphate (5.50 ± 0.18 pmol * mg−1 * min−1) that in presence of phosphate (1.53 ± 0.17 pmol * mg−1 * min−1).
Figure 6.
Phosphate inhibits pyrophosphate hydrolysis. 32-Pyrophosphate (32PPi) hydrolysis in rat aortic rings cultured in MEM (without phosphate) supplemented (+Pi) or not (−Pi) with 1 mmol/L phosphate. (A) Representative 32PPi hydrolysis in the indicated time. (B) 32PPi hydrolysis in absence or presence of 1 mmoL/L phosphate after 20 min of incubation. Results are presented as mean ± SEM of 12 rings (in three independent experiments), and were compared using the Wilcoxon matched pairs test. ***P < 0.001.
Discussion
Reductions in plasma pyrophosphate levels, which occur following hemodialysis24,25, have been associated with vascular calcification16,20. Because vascular calcification is the main clinical adverse effect in dialysis patients, largely determining their morbidity and mortality rates, further exploration of these findings may improve patient quality of life. This study showed that the reduction in plasma pyrophosphate levels following dialysis could be probably due to an increase in pyrophosphate hydrolysis. The ~51% increase in pyrophosphate hydrolysis was due primarily to increases in plasma alkaline phosphatase activity following dialysis. We found that the Vmax of this enzyme increased by ∼40%, while its Km decreased by ∼40%, from before to after dialysis. These findings are compatible with the presence of both competitive and non-competitive inhibitors, which are removed from plasma during dialysis. For example, the elimination of phosphate from plasma during dialysis25 may explain, at least in part, the increase in levamisol-sensitive alkaline phosphatase activity. Moreover, since alkaline phosphatase is found in many tissues and cells types (anchored in the cell membrane), pyrophosphate hydrolysis in isolated plasma is much less than in vivo. However, our results in plasma may be indicative of changes in phosphatase activity in other locations that collectively could contribute significantly to pyrophosphate hydrolysis in vivo. This could also explain the associated up-regulation of TNAP enzyme in uremic aorta shown in previously studies16, as a compensatory mechanism to improve the loss of hydrolysis capacity due to the phosphatase inhibition with uremic toxins (mainly phosphate).
Interesting, high levels of plasma alkaline phosphatase are also associated with mortality in all stages of chronic kidney diseases. Our study revealed an increase in alkaline phosphatase activity in post-dialysis plasma. Therefore, this hidden consequence of hemodialysis increases our knowledge of the factors contributing to mortality in this population.
We also found that levamisole, an inhibitor of TNAP22, had an IC50 value of 7.2 µmol/L, with a concentration of 100 µmol/L completely inhibiting alkaline phosphatase activity in human plasma. Interestingly, 75% of alkaline phosphatase activity in plasma is provided by a levamisole-sensitive enzyme, probably TNAP22. Although levamisole has been used as an anthelmintic treatment agent in humans, it has been replaced by more effective treatments. Levamisole could be used to prevent excessive pyrophosphate hydrolysis during dialysis sessions while developing more effective TNAP inhibitors. We found that the addition of levamisole to post-dialysis plasma reduced the hydrolysis of pyrophosphate, thereby increasing its availability.
Although we found that the increased pyrophosphate hydrolysis in post-dialysis plasma was associated with an increase in phosphatase activity, the plasma concentration of TNAP was ∼20% lower after than before dialysis. These findings suggest that ~51% higher pyrophosphate hydrolysis in plasma after than before dialysis is an underestimate. During dialysis, low molecular weight proteins are lost (<60 kDa). These may include TNAP, with a molecular weight of ∼53 kDa, suggesting that the lower TNAP concentration after than before dialysis session may be the consequence of diffusion during dialysis.
In conclusion, this study showed that pyrophosphate hydrolysis in plasma is greater after than before dialysis, despite the reduction in the level of TNAP protein, the main phosphatase in human plasma. Moreover, reduction in pyrophosphate levels is also be influenced by increments in tissue/cell TNAP activity. Because reductions in plasma pyrophosphate levels are associated with vascular calcification20, the findings of this study indicate that a loss of ability to prevent calcification plays a predominant role during this pathological process16,26. Vascular calcification is therefore associated with reductions in plasma pyrophosphate levels24,25 and increases in alkalization25,27 and calcium concentrations following dialysis. Supplementation with exogenous anticalcifying agents, such as pyrophosphate and TNAP inhibitors, may therefore inhibit or prevent dialysis-associated calcification.
Material and Methods
Hemodialysis conditions and sampling
Each patient underwent a conventional, purely diffusive 4 hour (mid-week) hemodialysis session without hemodiafiltration, using a high flux helixone dialyzer (Fresenius; CUF, 59 mL/h/mmHg; surface, 1.8 m2). The dialysate was composed of 1.5 mmol/L calcium, 35 mmol/L bicarbonate, 0.75 mmol/L potassium, 0.5 mmol/L magnesium, and 140 mmol/L sodium.
Blood samples before and after hemodialysis were collected in heparin-containing tubes and centrifuged at 5000 rpm for 5 min at 4 °C. In the case of Fig. 5 (pyrophosphate quantification) heparin-containing tubes were immediately centrifuged at 5000 rpm for 5 min at 4 °C. Plasma samples were frozen in liquid nitrogen and stored at −80 °C until further use. This study was conducted according to the Declaration of Helsinki and was approved by the Ethics Committee of Research of University Hospital Fundación Jiménez Díaz. Participants, ranging in age from 46 to 80 years and consisting of 26% women, were identified by a number and no other identifying material. Subjects were included if they were adults on stable chronic hemodialysis with a life expectancy over 6 months according to clinical criteria and provided informed consent. There were no exclusion criteria based on compliance; calcium, phosphate, parathyroid hormone, or vitamin D levels; or concomitant medications. Patients with positive serology for HIV, HB surface Ag, or HCV or other known active infection were excluded.
Figure 5.
Loss of TNAP protein in post-dialysis plasma. (A) Total protein concentrations in plasma samples before and after dialysis. (B) Representative Coomassie Brilliant Blue staining of plasma proteins in two pairs of samples. (C) Representative immunoblot of TNAP levels in plasma samples before and after dialysis (upper), and relative level of TNAP level in post-dialysis relative to pre-dialysis samples (lower). (D) ELISA quantification of TNAP levels in plasma samples before and after dialysis. Results are presented as mean ± SEM of 40 pairs of samples, and were compared using the Wilcoxon matched pairs test. **P < 0.01; ***P < 0.001.
Pyrophosphate hydrolysis and quantification
Plasma samples (5 µL) were incubated in 15 µL Molecular Biology Water (BE51200, Lonza, Switzerland) containing pyrophosphate (S6422, Sigma-Aldrich, St. Louis, MO) and [32P]pyrophosphate (Perkin Elmer, Boston, MA) at final concentrations of 5 µmol/L and 10 µCi/mL, respectively. After 4 hours, the samples were chromatographed on PEI-cellulose plates (105579; Merck, Germany), which were developed with 650 mmol/L K2HPO4 (P5655, Sigma-Aldrich) pH 3, as described22. After radiography, the spots containing phosphate and pyrophosphate were removed and added to liquid scintillation fluid (UltimaGold™, 6013329; Perkin Elmer). Radioactivity was measured using the liquid scintillation analyzer Tri-Carb 2810TR (Perkin Elmer).
Pyrophosphate was measured using an enzyme-linked bioluminescence assay, as described16,25. After measuring pyrophosphate levels in post-dialysis plasma samples, these samples were incubated in the presence or absence of levamisole for up to 24 hours, and pyrophosphate was again quantified.
Alkaline phosphatase activity and inhibition
Alkaline phosphatase activity was measured using pNPP (N4645, Sigma-Aldrich) as substrate. Briefly, 50 µL of human plasma was incubated with 150 µL of dH2O containing 0–20 mmol/L pNPP for 2 hours, and the absorbance of the solution was measured at 405 nm every 30 min. To test the ability of levamisole (31742, Sigma-Aldrich) or pyrophosphate to inhibit TNAP activity, 50 µL of human plasma was incubated with 150 µL of dH2O containing 10 mmol/L pNPP and the indicated levamisole or pyrophosphate concentration. Slopes and activities were calculated by linear regression using GraphPad Prism 5 software.
Protein quantification, gels, and immunoblots
Plasma protein levels were quantified using a BCA Protein Assay Kit (Pierce, Rockford, IL). Briefly, plasma samples were prepared in loading Buffer (62.5 mmol/L NaCl, 1 M Tris, pH 6.8; 2% SDS; 10% glycerol; 0.05% bromophenol blue), and the same volume for each pair of samples (containing 20 to 50 μg of protein) was separated by SDS-PAGE and stained with Coomassie Brilliant Blue (Generon; Maidenhead, UK) or blotted to polyvinylidenedifluoride (PVDF) transfer membranes (Immobilon®-P; Merck Millipore Ltd, Billerica, MA) as described16. The membranes were incubated with primary rabbit polyclonal anti-TNAP (1 μg/mL, ab65834, Abcam) antibody. After incubation with the appropriate secondary antibody (GENA934, Sigma-Aldrich), the blots were developed using Luminata™Classic Western HRP Substrate (WBLUC0500, Millipore, Billerica, Massachusetts) in the ImageQuant LAS 4000.
TNAP levels in plasma were quantified using ELISA kits for alkaline phosphatase in liver, bone, and kidney (SEB091Hu, Wuhan USCN Business Co., Ltd.; Houston, TX).
Kinetic analyses
Alkaline phosphatase saturation kinetics for pNPP hydrolysis were fitted to a Michaelis-Menten equation, V = Vmax S/(Km + S), where V is the velocity of pNPP hydrolysis, Vmax is the maximal velocity or capacity of pNPP hydrolysis, S is the concentration of pNPP, and Km is the affinity constant.
The mean inhibitory concentration (IC50) was also calculated by nonlinear regression using the one-site competition equation, V = Bottom + [(Top-Bottom)/(1 + 10(S-logIC50))], where Top refers to the velocity of pNPP hydrolysis in the absence of inhibitor (levamisole), and Bottom refers to the maximal inhibition.
The inhibition constant, Ki, for pyrophosphate (its Km) was then calculated indirectly using the following equation: Ki = IC50 /[1 + (S/Km)], were S is the constant concentration of pNPP (0.250 mmol/L) and Km is the affinity constant of pNPP (0.082 mmol/L).
Animals
Male Sprague-Dawley rats (8–12 weeks) were obtained from Charles River Laboratories (France). The protocol was approved by ethics committees both the FIIS-FJD (Fundación Instituto de Investigación Sanitaria, Fundación Jiménez Díaz) and Madrid Community (PROEX 427/15); and conformed to directive 2010/63EU and recommendation 2007/526/EC regarding the protection of animals used for experimental and other scientific purposes, enforced in Spanish law under RD1201/2005.
Aorta isolation and pyrophosphate hydrosysis assay
Rats were euthanized via carbon dioxide inhalation and thoracic aorta tissue was perfused with saline and removed according to previously published protocols15Then, the pyrophosphate hydrolysis assay was performed.
For pyrophosphate hydrolysis experiment (Fig. 6), aortic rings were cultured ex vivo in Minimum Essential Medium Eagle (MEM Media, Gibco, Paisley, United Kingdom). To remove adventitia layer, rat aortas were digested for 10 min with collagenase, as previously described28. Then, medial layer of the aortic rings were incubated ex vivo in MEM media containing 5 µmol/L pyrophosphate and 32-pyrophosphate (32PPi) as a radiotracer. After the indicated time of incubation, ortophosphate was separated from pyrophosphate, as previously described15. Briefly, 20 μL of sample was mixed with 400 μL of ammonium molybdate (to bind the orthophosphate, 09913, Sigma-Aldrich) and 0.75 mol/L sulphuric acid (258105, Sigma-Aldrich). Samples were then extracted with 800 μL of isobutanol/petroleum ether (4:1) to separate the phosphomolybdate from the pyrophosphate (ref. 77379 and 360465 for petroleum ether and isopropanol, respectively; Sigma-Aldrich). Next, 400 μL of the organic phase containing phosphomolybdate was removed and subjected to radioactivity counting.
In experiments shown in Fig. 6, pyrophosphate hydrolysis in absence of phosphate assay was first performed. In this case, the aortic rings were incubated in MEM media without phosphate. Then, after washing five times in MEM media without phosphate, the same aortic rings were used for pyrophosphate hydrolysis assay in presence of 1 mmol/L phosphate (KH2PO4/K2HPO4 pH 7.4). Finally, the aortic rings were dried and weighed.
Statistical analysis
Results are presented as mean ± standard error of the mean (SEM), and were compared by the Wilcoxon matched pairs test. Statistical significance was determined using GraphPad Prism 5 software.
Electronic supplementary material
Acknowledgements
We thank the nurses of the Hemodialysis Service of the Renal Division of the University Hospital Fundación Jiménez Díaz for providing plasma samples. This study was supported by grant SAF-2014-60699-JIN from the Spanish Ministerio de Economía y Competitividad (MINECO). The funders had no role in study design, data collection and analysis, decision to publish, or preparation of the manuscript.
Author Contributions
Conceived and designed the experiments: R.V.-B. Performed the experiments: R.V.-B. and D.A. (Fig. 4). Analyzed the data: R.V.-B. Contributed reagents/material/analysis tolls: R.V.-B. Contributed blood samples: E.G.-P. Prepared figures: R.V.-B. Wrote the paper: R.V.-B. All authors approved the final version of manuscript.
Competing Interests
The authors declare no competing interests.
Footnotes
Daniel Azpiazu and Ricardo Villa-Bellosta contributed equally to this work.
Electronic supplementary material
Supplementary information accompanies this paper at 10.1038/s41598-018-29432-4.
Publisher's note: Springer Nature remains neutral with regard to jurisdictional claims in published maps and institutional affiliations.
References
- 1.Go AS, Chertow GM, Fan D, McCulloch CE, Hsu C. Chronic kidney disease and the risks of death, cardiovascular events, and hospitalization. N. Engl. J. Med. 2004;351:1296–1305. doi: 10.1056/NEJMoa041031. [DOI] [PubMed] [Google Scholar]
- 2.Shanahan CM, Crouthamel MH, Kapustin A, Giachelli CM. Arterial calcification in chronic kidney disease: key roles for calcium and phosphate. Circ. Res. 2011;109:697–711. doi: 10.1161/CIRCRESAHA.110.234914. [DOI] [PMC free article] [PubMed] [Google Scholar]
- 3.Villa-Bellosta R. Vascular Calcification Revisited: A New Perspective for Phosphate Transport. Curr. Cardiol. Rev. 2015;11:341–351. doi: 10.2174/1573403X11666150805120505. [DOI] [PMC free article] [PubMed] [Google Scholar]
- 4.Block GA, Hulbert-Shearon TE, Levin NW, Port FK. Association of serum phosphorus and calcium x phosphate product with mortality risk in chronic hemodialysis patients: a national study. Am. J. Kidney Dis. Off. J. Natl. Kidney Found. 1998;31:607–617. doi: 10.1053/ajkd.1998.v31.pm9531176. [DOI] [PubMed] [Google Scholar]
- 5.Ganesh SK, Stack AG, Levin NW, Hulbert-Shearon T, Port FK. Association of elevated serum PO(4), Ca x PO(4) product, and parathyroid hormone with cardiac mortality risk in chronic hemodialysis patients. J. Am. Soc. Nephrol. JASN. 2001;12:2131–2138. doi: 10.1681/ASN.V12102131. [DOI] [PubMed] [Google Scholar]
- 6.Lau WL, Pai A, Moe SM, Giachelli CM. Direct effects of phosphate on vascular cell function. Adv. Chronic Kidney Dis. 2011;18:105–112. doi: 10.1053/j.ackd.2010.12.002. [DOI] [PMC free article] [PubMed] [Google Scholar]
- 7.Shroff RC, et al. Chronic mineral dysregulation promotes vascular smooth muscle cell adaptation and extracellular matrix calcification. J. Am. Soc. Nephrol. JASN. 2010;21:103–112. doi: 10.1681/ASN.2009060640. [DOI] [PMC free article] [PubMed] [Google Scholar]
- 8.Steitz SA, et al. Smooth muscle cell phenotypic transition associated with calcification: upregulation of Cbfa1 and downregulation of smooth muscle lineage markers. Circ. Res. 2001;89:1147–1154. doi: 10.1161/hh2401.101070. [DOI] [PubMed] [Google Scholar]
- 9.Speer MY, Li X, Hiremath PG, Giachelli CM. Runx2/Cbfa1, but not loss of myocardin, is required for smooth muscle cell lineage reprogramming toward osteochondrogenesis. J. Cell. Biochem. 2010;110:935–947. doi: 10.1002/jcb.22607. [DOI] [PMC free article] [PubMed] [Google Scholar]
- 10.Ewence AE, et al. Calcium phosphate crystals induce cell death in human vascular smooth muscle cells: a potential mechanism in atherosclerotic plaque destabilization. Circ. Res. 2008;103:e28–34. doi: 10.1161/CIRCRESAHA.108.181305. [DOI] [PubMed] [Google Scholar]
- 11.Proudfoot D, et al. Apoptosis regulates human vascular calcification in vitro: evidence for initiation of vascular calcification by apoptotic bodies. Circ. Res. 2000;87:1055–1062. doi: 10.1161/01.RES.87.11.1055. [DOI] [PubMed] [Google Scholar]
- 12.Shroff RC, et al. Dialysis accelerates medial vascular calcification in part by triggering smooth muscle cell apoptosis. Circulation. 2008;118:1748–1757. doi: 10.1161/CIRCULATIONAHA.108.783738. [DOI] [PubMed] [Google Scholar]
- 13.Villa-Bellosta R, Sorribas V. Phosphonoformic acid prevents vascular smooth muscle cell calcification by inhibiting calcium-phosphate deposition. Arterioscler. Thromb. Vasc. Biol. 2009;29:761–766. doi: 10.1161/ATVBAHA.108.183384. [DOI] [PubMed] [Google Scholar]
- 14.Villa-Bellosta R, Millan A, Sorribas V. Role of calcium-phosphate deposition in vascular smooth muscle cell calcification. Am. J. Physiol. Cell Physiol. 2011;300:C210–220. doi: 10.1152/ajpcell.00229.2010. [DOI] [PubMed] [Google Scholar]
- 15.Villa-Bellosta R, Sorribas V. Calcium phosphate deposition with normal phosphate concentration. -Role of pyrophosphate- Circ. J. Off. J. Jpn. Circ. Soc. 2011;75:2705–2710. doi: 10.1253/circj.cj-11-0477. [DOI] [PubMed] [Google Scholar]
- 16.Villa-Bellosta R, et al. Defective extracellular pyrophosphate metabolism promotes vascular calcification in a mouse model of Hutchinson-Gilford progeria syndrome that is ameliorated on pyrophosphate treatment. Circulation. 2013;127:2442–2451. doi: 10.1161/CIRCULATIONAHA.112.000571. [DOI] [PubMed] [Google Scholar]
- 17.O’Neill WC, Lomashvili KA, Malluche HH, Faugere M-C, Riser BL. Treatment with pyrophosphate inhibits uremic vascular calcification. Kidney Int. 2011;79:512–517. doi: 10.1038/ki.2010.461. [DOI] [PMC free article] [PubMed] [Google Scholar]
- 18.Riser BL, et al. Daily peritoneal administration of sodium pyrophosphate in a dialysis solution prevents the development of vascular calcification in a mouse model of uraemia. Nephrol. Dial. Transplant. Off. Publ. Eur. Dial. Transpl. Assoc. - Eur. Ren. Assoc. 2011;26:3349–3357. doi: 10.1093/ndt/gfr039. [DOI] [PubMed] [Google Scholar]
- 19.Schibler D, Russell RG, Fleisch H. Inhibition by pyrophosphate and polyphosphate of aortic calcification induced by vitamin D3 in rats. Clin. Sci. 1968;35:363–372. [PubMed] [Google Scholar]
- 20.Lomashvili KA, Narisawa S, Millán JL, O’Neill WC. Vascular calcification is dependent on plasma levels of pyrophosphate. Kidney Int. 2014;85:1351–1356. doi: 10.1038/ki.2013.521. [DOI] [PMC free article] [PubMed] [Google Scholar]
- 21.Rutsch F, et al. Mutations in ENPP1 are associated with ‘idiopathic’ infantile arterial calcification. Nat. Genet. 2003;34:379–381. doi: 10.1038/ng1221. [DOI] [PubMed] [Google Scholar]
- 22.Villa-Bellosta R, Wang X, Millán JL, Dubyak GR, O’Neill WC. Extracellular pyrophosphate metabolism and calcification in vascular smooth muscle. Am. J. Physiol. Heart Circ. Physiol. 2011;301:H61–68. doi: 10.1152/ajpheart.01020.2010. [DOI] [PMC free article] [PubMed] [Google Scholar]
- 23.Lomashvili KA, Garg P, Narisawa S, Millan JL, O’Neill WC. Upregulation of alkaline phosphatase and pyrophosphate hydrolysis: potential mechanism for uremic vascular calcification. Kidney Int. 2008;73:1024–1030. doi: 10.1038/ki.2008.26. [DOI] [PMC free article] [PubMed] [Google Scholar]
- 24.Lomashvili KA, Khawandi W, O’Neill WC. Reduced plasma pyrophosphate levels in hemodialysis patients. J. Am. Soc. Nephrol. JASN. 2005;16:2495–2500. doi: 10.1681/ASN.2004080694. [DOI] [PubMed] [Google Scholar]
- 25.Villa-Bellosta R, González-Parra E, Egido J. Alkalosis and Dialytic Clearance of Phosphate Increases Phosphatase Activity: A Hidden Consequence of Hemodialysis. PloS One. 2016;11:e0159858. doi: 10.1371/journal.pone.0159858. [DOI] [PMC free article] [PubMed] [Google Scholar]
- 26.Villa-Bellosta R, Egido J. Phosphate, pyrophosphate, and vascular calcification: a question of balance. Eur. Heart J. 2017;38:1801–1804. doi: 10.1093/eurheartj/ehv605. [DOI] [PubMed] [Google Scholar]
- 27.Mendoza FJ, et al. Metabolic acidosis inhibits soft tissue calcification in uremic rats. Kidney Int. 2008;73:407–414. doi: 10.1038/sj.ki.5002646. [DOI] [PubMed] [Google Scholar]
- 28.Villa-Bellosta R, Hamczyk MR. Isolation and Culture of Aortic Smooth Muscle Cells and In Vitro Calcification Assay. Methods Mol. Biol. Clifton NJ. 2015;1339:119–129. doi: 10.1007/978-1-4939-2929-0_8. [DOI] [PubMed] [Google Scholar]
Associated Data
This section collects any data citations, data availability statements, or supplementary materials included in this article.


