

Abstract
Objective
To compare response rate and nonresponse bias across two mixed‐mode survey designs and two single‐mode designs.
Data Sources
This experiment was embedded in a clinician survey of knowledge and attitudes regarding HPV vaccination (n = 275).
Study Design
Clinicians were randomly assigned one of two mixed‐mode (mail/web or web/mail) or single‐mode designs (mail‐only/web‐only). Differences in response rate and nonresponse bias were assessed.
Principal Findings
Using a multiple‐contact protocol increased response, and sending a web survey first provided the more rapid response. Overall, the mixed‐mode survey designs generated final response rates approximately 10 percentage points higher than their single‐mode counterparts, although only the final response differences between the mail‐only and web/mail conditions attained statistical significance (32.1 percent vs. 48 percent, respectively; p = .005). Observed differences did not result in nonresponse bias.
Conclusions
Results support mixing modes of survey administration and web‐based data collection in a multiple contact survey data collection protocol.
Keywords: Survey methods, mode effects, response rate, clinician surveys
Clinician surveys have long been used by health researchers and policy makers to assess clinician knowledge, attitudes, and behaviors, including practice patterns and guideline adherence. Unfortunately, response rates to clinician surveys are typically lower than nonclinician surveys (Asch, Jedrziewski, and Christakis 1997; Asch et al. 2000), and participation is declining among this population (Cho, Johnson, and Vangeest 2013; McLeod et al. 2013).
Recent reviews of the literature on clinician survey response behavior have implicated the mode of survey administration and the approach to nonrespondent follow‐up as potentially important predictors of response propensity (Kellerman and Herold 2001; VanGeest, Johnson, and Welch 2007; Thorpe et al. 2009; Cho, Johnson, and Vangeest 2013; Klabunde, Willis, and Casalino 2013). According to the leverage‐saliency theory of survey participation developed by Groves, Singer, and Corning (2000), survey participation depends on “leverage” applied by some combination of response mode and follow‐up. Specifically, if a survey request is perceived to be burdensome or inconvenient, providing an alternative method of response might exert enough “counterweight” to compel response.
Using multiple modes of contact has been shown to increase response rates and increase representativeness while decreasing costs in the general population (Beebe et al. 2005, 2012; de Leeuw 2005). Use of multiple modes of contact has also been shown to increase response rates and increase representativeness in clinician populations (Beebe et al. 2007; Dykema et al. 2013; Pit, Vo, and Pyakurel 2014). Most often, clinician studies using more than one mode have evaluated the impact of having a final contact in a different mode than initial contacts, an approach recommended by Dillman (Kellerman and Herold 2001; Puleo et al. 2002; McMahon et al. 2003; Dillman, Smyth, and Christian 2009; Kroth et al. 2009). Some studies have compared the use of one or more modes across respondent groups where the contact mode remains constant to the respondent (Akl et al. 2005; Hocking et al. 2006).
Few studies have used a crossover design to compare the order of use of various modes that change with each contact. However, select members of this study's authorship team previously published a study in this journal evaluating use of a crossover design (Beebe et al. 2007). Specifically, 500 primary care and specialist clinicians were randomly assigned to one of two sequential mixed‐mode designs (web followed by mail and mail followed by web). We found higher response rates in the latter design (62.9 percent compared to 70.5 percent, respectively) but no differences in terms of the responding sample either sociodemographically or in terms of their substantive findings (e.g., computer use). However, we did find evidence that inclusion of the mail mode led to better representation of specialists, underscoring the need to look at nonresponse bias among clinicians. There were some limitations to this study upon which we improved in the present investigation, including the lack of a true control.
Herein, we report the results of a community‐based embedded experiment designed to disentangle the impact of multiple contacts to initial nonresponders in the same mode compared to switching modes for additional contacts. We focus on web‐based and mailed surveys because they have been shown to represent the two most viable modes of contact for clinicians (Beebe et al. 2007; McLeod et al. 2013; VanGeest, Beebe, and Johnson 2014; Sebo et al. 2017). The objective of this study was to determine the relative strengths and weaknesses of different contact regimens for surveying clinicians. To our knowledge, no studies have employed an experiment of this nature in this population.
Methods
Study Participants
We randomly sampled primary care clinicians, including physicians, nurse practitioners, and physician assistants, in a 27‐county geographic region captured by the Rochester Epidemiology Project (REP), a research infrastructure that links medical records from multiple clinicians to individuals residing in the community and maintains an electronic index of diagnoses, drug prescriptions, and procedural information from these records, as well as hospitalizations, office visits, and emergency room visits (Rocca et al. 2012). The REP has captured virtually all health care delivered in Olmsted County, Minnesota, since 1966 and was recently expanded to include neighboring counties in southeast Minnesota and western Wisconsin (St. Sauver et al. 2012).
Study Design and Survey Instrument
This study was embedded in a larger survey study conducted from October 2015 to January 2016 and designed to assess clinician knowledge, clinician barriers, and perceived parental barriers regarding HPV vaccination using a validated instrument. The methods and results associated with the larger investigation are reported elsewhere (Rutten et al. 2017). We compared two mixed‐mode designs (sequential: mail/web and sequential: web/mail) to two single‐mode designs (mail‐only and web‐only), with respect to response rate and nonresponse bias. Surveys were administered according to the flowchart depicted in Figure 1.
Figure 1.
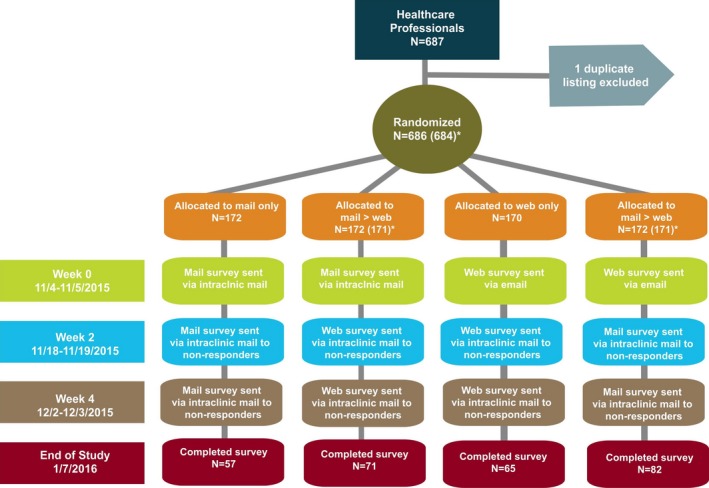
- Notes. “End of Study” was defined as 1 day after the last survey was received and a “Completed survey” indicated that a respondent completed at least 50 percent of items on the survey. There are two dates given for each phase—the mailed surveys were sent on the earlier date, and the web surveys were emailed on the later date (this holds true within each phase).
- *At the end of the study, two responders were found to be nonclinicians and were excluded from the denominator (one excluded from mail→web, and one excluded from web→mail, N for analysis is 684).
All mail contacts included a cover letter on Mayo Clinic letterhead detailing the purpose of the survey, the survey booklet, and a postage‐paid return envelope. The paper surveys were returned to the Mayo Clinic Survey Research Center (hereafter Mayo SRC), where they were dated and double entered by data entry professionals. All web contact was sent from a Mayo SRC address. The body of the e‐mail included the same information as the paper cover letter and included an embedded link to the web survey. All web survey data were automatically populated into a database that was reconciled by a trained data librarian who worked closely with the paper data entry team.
Initial survey nonresponders received up to two additional contacts as specified in Figure 1. When a clinician responded to a survey or indicated refusal, subsequent contact was ceased. All arms of the experiment were kept on the same mail schedule with 2 weeks passing between contacts. This was performed to prevent any secular trends from differentially impacting response rates or data quality across experimental conditions. The web survey link remained active for all sample members during the entire survey period regardless of survey arm.
Analysis
First, we considered the impact of additional contacts and mode change (or no change) on unit nonresponse by calculating the number of completions divided by the number of eligible cases, consistent with the American Association for Public Opinion Research (AAPOR) guidelines (RR1) (AAPOR, 2016). The response rates within each phase of data collection were first compared between the four conditions with an overall chi‐square test; and then with pairwise chi‐square tests, using a significance level of 0.01 to account for multiple comparisons. The second analysis was designed to determine the impact of mode and contact on potential nonresponse bias. For this, we used sample frame data available from the REP to compare characteristics of responders to the distribution for the entire sample frame within each experimental condition and within each phase of data collection using chi‐square goodness‐of‐fit tests (treating the sample frame as the fixed distribution for the null hypothesis). Unfortunately, frame characteristics were limited and included only job description (physician vs. advanced practice clinician like nurse practitioners and physician assistants) and employment status (full‐time vs. part‐time). Similarly, to assess whether there was inconsistency in the responses to key outcome variables, we compared the distributions for selected survey items within each experimental condition and data collection phase to the distribution among all responders with chi‐square goodness‐of‐fit tests (treating the overall distribution from all responders combined as fixed for the null hypothesis). p‐Values less than 0.01 were regarded as statistically significant for these goodness‐of‐fit tests. All analyses were performed using SAS version 9.4 (SAS Institute Inc., Cary, NC).
Results
A total of 686 clinicians were sent the survey, 275 returned the survey, and 2 were excluded prior to analysis due to being nonclinicians, resulting in an overall response rate of 40.2 percent. A total of 57 cases in the mail‐only condition, 71 cases in the mail/web condition, 65 cases in the web‐only condition, and 82 cases in the web/mail condition were available for analysis overall.
Response Rates
The response rates for each of the four experimental conditions by data collection phase are reported in Table 1. Overall, response rates differed significantly across the conditions at each phase of data collection. Looking at the between‐condition differences, before the first reminder was sent, the response rates in the web/mail condition (24.6 percent) were significantly higher than those seen in the mail‐only condition (10.5 percent, p = .0006). The response rates between the other conditions did not differ significantly from each other (p ≥ .01).
Table 1.
Cumulative Response Rates by Data Collection Phase and Survey Mode, n (%)
| Mail‐Only (N = 172) | Mail → Web (N = 171) | Web‐Only (N = 170) | Web → Mail (N = 171) | Overall (N = 684) | Overall p‐value | |
|---|---|---|---|---|---|---|
| Before 2nd contact | 18 (10.5%) | 25 (14.6%) | 33 (19.4%) | 42 (24.6%) | 118 (17.3%) | .004 |
| A | AB | AB | B | |||
| Before 3rd contact | 35 (20.3%) | 56 (32.7%) | 54 (31.8%) | 54 (31.6%) | 199 (29.1%) | .035 |
| A | B | AB | AB | |||
| End of study | 57 (32.1%) | 71 (41.5%) | 65 (38.2%) | 82 (48.0%) | 275 (40.2%) | .041 |
| A | AB | AB | B |
A “complete responder” is someone who answered at least 50% of survey items.
Groups sharing the same letter are not significantly different (p ≥ .01). Groups without letters in common are significantly different (p < .01).
After the reminder was sent, however, response rates increased rather considerably across conditions, with mail/web seeing the largest increase at 18.1 percentage points, followed by web‐only at 12.4 percentage points, mail‐only at 9.8 percentage points, and web/mail at 7 percentage points. At this point in the data collection process, the response rate for the mail‐only condition of 20.3 percent was significantly lower than the rates observed in the mail/web condition (32.7 percent). Although the response rates were also considerably higher in the web‐only (31.8 percent) and web/mail (31.6 percent) conditions, these were not significantly different from the mail‐only condition. Response rates increased appreciably across all conditions as a result of the second reminder with the web/mail condition being the largest beneficiary with an increase of 16.4 percentage points, followed by mail‐only, mail/web, and web‐only with increases of 11.8, 8.8, and 6.4 percentage points, respectively. Overall and at the end of data collection, the response rate in the web/mail condition was significantly higher than the rate observed in the mail‐only condition (48 percent vs. 32.1 percent, respectively, p = .005).
Nonresponse Bias
Table 2 presents the distributions of selected variables overall and by data collection condition and phase. No systematic bias was observed at any point in the data collection process, regardless of condition, for the two variables where we had information on the entire sample frame (upper panel of Table 2) or for the four key outcome variables from the responding sample relating to cervical cancer causes and HPV vaccination recommendations (lower panel of Table 2). Further, there was no evidence that more contacts or switching modes brought any of the distributions closer or further away from the overall distributions.
Table 2.
Distributions of Selected Variables Overall and by Data Collection Condition and Phasea
| Overall | Data Collection Condition | ||||||||||||
|---|---|---|---|---|---|---|---|---|---|---|---|---|---|
| Mail‐Only (N = 172) | Mail → Web (N = 171) | Web‐Only (N = 170) | Web → Mail (N = 171) | ||||||||||
| Before 2nd Contact | Before 3rd Contact | End of Study | Before 2nd Contact | Before 3rd Contact | End of Study | Before 2nd Contact | Before 3rd Contact | End of Study | Before 2nd Contact | Before 3rd Contact | End of Study | ||
| Job descriptionb | |||||||||||||
| Physician | 497 (72.7%) | 66.7% | 71.4% | 73.7% | 64.0% | 71.4% | 76.1% | 72.7% | 77.8% | 73.8% | 57.1% | 63.0% | 67.1% |
| Advanced practice | 187 (27.3%) | 33.3% | 28.6% | 26.3% | 36.0% | 28.6% | 23.9% | 27.3% | 22.2% | 26.2% | 42.9% | 37.0% | 32.9% |
| p‐Value | NA | 0.56 | 0.87 | 0.87 | 0.33 | 0.83 | 0.53 | 1.0 | 0.40 | 0.84 | 0.02 | 0.11 | 0.25 |
| FTEb | |||||||||||||
| Full‐time | 495 (72.4%) | 72.2% | 68.6% | 68.4% | 80.0% | 78.6% | 80.3% | 72.7% | 75.9% | 75.4% | 73.8% | 74.1% | 72.0% |
| Part‐time | 189 (27.6%) | 27.8% | 31.4% | 31.6% | 20.0% | 21.4% | 19.7% | 27.3% | 24.1% | 24.6% | 26.2% | 25.9% | 28.0% |
| p‐Value | NA | 0.99 | 0.61 | 0.50 | 0.40 | 0.30 | 0.14 | 0.97 | 0.56 | 0.59 | 0.84 | 0.78 | 0.93 |
| Genital warts are caused by the same HPV types that cause cervical cancerc | |||||||||||||
| False/Unsure | 182 (66.7%) | 76.5% | 73.5% | 67.9% | 72.0% | 71.4% | 69.0% | 72.7% | 74.1% | 69.2% | 59.5% | 56.6% | 61.7% |
| True | 91 (33.3%) | 23.5% | 26.5% | 32.1% | 28.0% | 28.6% | 31.0% | 27.3% | 25.9% | 30.8% | 40.5% | 43.4% | 38.3% |
| p‐Value | NA | 0.39 | 0.40 | 0.85 | 0.57 | 0.45 | 0.68 | 0.46 | 0.25 | 0.67 | 0.32 | 0.12 | 0.34 |
| HPV causes head and neck cancersc | |||||||||||||
| False/Unsure | 48 (17.5%) | 11.1% | 11.4% | 17.5% | 4.0% | 10.7% | 15.5% | 9.1% | 14.8% | 18.5% | 16.7% | 17.0% | 18.5% |
| True | 226 (82.5%) | 88.9% | 88.6% | 82.5% | 96.0% | 89.3% | 84.5% | 90.9% | 85.2% | 81.5% | 83.3% | 83.0% | 81.5% |
| p‐Value | NA | 0.48 | 0.34 | 0.99 | 0.08 | 0.18 | 0.66 | 0.20 | 0.60 | 0.84 | 0.89 | 0.92 | 0.81 |
| In the past 12 months, how often did you recommend the HPV vaccine to your female patients aged 11–12 years?c | |||||||||||||
| ≤90% of the time | 79 (36.6%) | 45.5% | 44.0% | 37.8% | 46.7% | 40.0% | 37.0% | 24.0% | 26.8% | 34.0% | 34.4% | 40.9% | 37.3% |
| >90% of the time | 137 (63.4%) | 54.5% | 56.0% | 62.2% | 53.3% | 60.0% | 63.0% | 76.0% | 73.2% | 66.0% | 65.6% | 59.1% | 62.7% |
| p‐Value | NA | 0.54 | 0.44 | 0.87 | 0.42 | 0.66 | 0.95 | 0.19 | 0.19 | 0.70 | 0.79 | 0.55 | 0.90 |
| In the past 12 months, how often did you recommend the HPV vaccine to your male patients aged 11–12 years?c | |||||||||||||
| ≤90% of the time | 122 (56.2%) | 45.5% | 50.0% | 51.2% | 66.7% | 62.8% | 61.4% | 48.0% | 45.2% | 51.0% | 48.4% | 53.7% | 59.1% |
| >90% of the time | 95 (43.8%) | 54.5% | 50.0% | 48.8% | 33.3% | 37.2% | 38.6% | 52.0% | 54.8% | 49.0% | 51.6% | 46.3% | 40.9% |
| p‐Value2 | NA | 0.47 | 0.52 | 0.51 | 0.37 | 0.38 | 0.43 | 0.41 | 0.15 | 0.45 | 0.38 | 0.74 | 0.64 |
Estimates compared each experimental group to the total value using chi‐square goodness‐of‐fit tests.
Comparing distributions for each data collection condition and phase to overall distribution from administrative data that includes survey responders and nonresponders.
Comparing distributions for each data collection condition and phase to overall distribution of responding sample.
Discussion
In this regional survey of primary care clinicians, including physicians, nurse practitioners, and physician assistants, using a multiple contact protocol proved to be an effective means of increasing response with increases of approximately 11 percentage points observed after each contact attempt. This is consistent with prior research (Moore and Tarnai 2002; Braithwaite et al. 2003; McMahon et al. 2003). We observed a differential impact of the contacts across the four conditions, but in general, single‐mode surveys (mail or web) tended to generate lower response rates than mixed‐mode surveys (mail and web) in the context of this three‐phase multicontact protocol, although only the mail‐only and web/mail rates differed significantly at the end of data collection (the web/mail rate was higher). Broadly, in the two experimental conditions where the mailed survey was followed by a web option or where the web survey was followed by a mailed option, final response rates were observed to be almost 10 percentage points higher relative to their single‐mode counterparts. Consistent with previous research (Beebe et al. 2007; Dykema et al. 2013; Pit, Vo, and Pyakurel 2014), these results demonstrate that switching modes bring about the highest levels of participation relative to single modes in surveys of clinicians. Also consistent with previous research, sending a web survey first provides the more rapid response, likely due to delays in the postal system in the mailed survey conditions (McMahon et al. 2003; Akl et al. 2005; Beebe et al. 2007; Sebo et al. 2017).
A few results in the response rate realm ran counter to expectations. First, whereas our prior research had pointed to increased levels of participation in a mail/web condition relative to the web/mail (Beebe et al. 2007), the current results revealed results that fell in the opposite direction. Specifically, the web/mail combination yielded an overall response rate that was 6.5 percentage points higher than the mail‐web combination, although this difference failed to attain statistical significance. Second, we observed a similarly sized gap between the mail‐only versus the web‐only conditions with participation observed to be higher in the latter—something that previous research has not observed (see Dykema et al. 2013 and VanGeest, Beebe, and Johnson 2014 for recent systematic reviews of the literature on web versus mailed survey response rates). It may be that in the decade since our earlier study that the web option has become more acceptable to clinicians. The research demonstrating that younger clinicians tend to prefer the web option versus their older counterparts would seem to support this notion (Lusk et al. 2007; McMahon et al. 2003). Further, we observed in a separate analysis (data not shown) that 52 percent of respondents to the web/mail treatment responded by web compared to only 45 percent of respondents to the mail/web treatment. This suggests that starting with a web option might lead more clinicians to the less expensive web mode (largely due to cost savings related to data entry) than starting with the mail and that a web option is “coming of age” among clinicians.
Our finding that the overall response rate in the web/mail condition was significantly higher than the rate observed in the mail‐only condition differs from the results observed by Ernst and colleagues, who found just the opposite in a comparably designed study of primary care gynecologists in Germany (Ernst et al. 2018). The authors posit that the lower response rate for the web/mail method vis‐à‐vis mail‐only may be due to the older age structure of the responding sample. Because we did not have access to clinician age in our sample frame, it is not possible to attribute the differences in findings to that potential source. Further research in this area is warranted.
It is important to note that few studies have looked at nonresponse bias in clinician surveys—less than 20 percent of studies reviewed between 1996 and 2005 even attempted assessment of possible nonresponse bias (Cook, Dickinson, and Eccles 2009). The research that exists has shown modest differences between responders and nonresponders and between early and late responders on key demographic, geographic, and/or practice‐related characteristics (see VanGeest, Beebe, and Johnson 2014 for a review of nonresponse bias in physician surveys). Our results are really no different, no matter how we assessed bias. As has been posited in the past, it is likely that clinicians in our sample were more resilient to response bias compared to other surveys because the population tends to be rather homogeneous in terms of knowledge, training, attitudes, and behavior than their general population counterparts (Kellerman and Herold 2001; Cull et al. 2005; McFarlane et al. 2007; Bjertnaes, Garratt, and Botten 2008). Further, we had speculated that nonphysician clinicians might be more likely to respond to our survey requests than their physician counterparts because they have more limited work‐related autonomy, lower levels of clerical support that might potentiate “gate keeping,” and/or limited experience with and willingness to engage in research (Roxburgh 2006; Begley 2010). However, our results did not indicate differential levels of participation by clinician type or impact of contact method.
It is worth noting that a potential limitation of our study is that we evaluated the impact of mixed‐mode versus single‐mode designs and multiple contact attempts on survey response and nonresponse bias wherein mode of contact and mode of response were paired and consistent. This approach is characteristic of prior research in this area, particularly in surveys of clinicians (see Beebe et al. 2007; Dykema et al. 2013; Pit, Vo, and Pyakurel 2014). An exception to this standard is the work of Millar and Dillman (2011), who separated method of contact from mode of response in a survey of college undergraduates. Future research should test the impact of this latter design among clinicians.
In conclusion, the results of the present investigation offer support for the practice of mixing modes of survey administration rather than deploying a single mode in a multiple contact survey data collection protocol and that the use of a web‐based method of data collection should be considered. Coupled with the litany of salutary aspects of the web mode—such as their potential for significant cost savings, reduced field periods, rapidity of data availability, and improved data quality (Schleyer and Forrest 2000; Braithwaite et al. 2003; Akl et al. 2005; Dykema et al. 2011, 2013; Minniear et al. 2013)—the relatively high levels of response to that mode suggest that web surveys are becoming an increasingly viable method of data collection. Further, the observed response rate differences across the four conditions in terms of response bias appeared to have little impact, although the information we had to formally assess that was limited. Future research on clinician survey nonresponse with more fortified sample frame data is encouraged.
Acknowledgments
Joint Acknowledgment/Disclosure Statement: The project was funded by the Mayo Clinic Foundation for Research and Education and the Mayo Clinic Kern Center for the Science of Healthcare Delivery.
Disclosures: None.
Disclaimer: None.
References
- Akl, E. A. , Maroun N., Klocke R. A., Montori V., and Schunemann H. J.. 2005. “Electronic Mail Was Not Better Than Postal Mail for Surveying Residents and Faculty.” Journal of Clinical Epidemiology 58 (4): 425–9. [DOI] [PubMed] [Google Scholar]
- American Association for Public Opinion Research . 2016. Standard Definitions: Final Dispositions of Case Codes and Outcome Rates for Surveys, 9th Edition Oakbrook Terrace, IL: AAPOR. [Google Scholar]
- Asch, D. A. , Jedrziewski M. K., and Christakis N. A.. 1997. “Response Rates to Mail Surveys Published in Medical Journals.” Journal of Clinical Epidemiology 50 (10): 1129–36. [DOI] [PubMed] [Google Scholar]
- Asch, S. , Connor S. E., Hamilton E. G., and Fox S. A.. 2000. “Problems in Recruiting Community‐based Physicians for Health Services Research.” Journal of General Internal Medicine 15 (8): 591–9. [DOI] [PMC free article] [PubMed] [Google Scholar]
- Beebe, T. J. , Davern M. E., McAlpine D. D., Call K. T., and Rockwood T. H.. 2005. “Increasing Response Rates in a Survey of (Mail and Telephone).” Medical Care 43 (4): 411–4. [DOI] [PubMed] [Google Scholar]
- Beebe, T. J. , Locke G. R. 3rd, Barnes S. A., Davern M. E., and Anderson K. J.. 2007. “Mixing Web and Mail Methods in a Survey of Physicians.” Health Services Research 42 (3 Pt 1): 1219–34. [DOI] [PMC free article] [PubMed] [Google Scholar]
- Beebe, T. J. , McAlpine D. D., Ziegenfuss J. Y., Jenkins S., Haas L., and Davern M. E.. 2012. “Deployment of a Mixed‐mode Data Collection Strategy Does Not Reduce Nonresponse Bias in a General Population Health Survey.” Health Services Research 47 (4): 1739–54. [DOI] [PMC free article] [PubMed] [Google Scholar]
- Begley, A. M. 2010. “On Being a Good Nurse: Reflections on the Past and Preparing for the Future.” International Journal of Nursing Practice 16 (6): 525–32. [DOI] [PubMed] [Google Scholar]
- Bjertnaes, O. A. , Garratt A., and Botten G.. 2008. “Nonresponse Bias and Cost‐Effectiveness in a Norwegian Survey of Family Physicians.” Evaluation and the Health Professions 31: 65–80. [DOI] [PubMed] [Google Scholar]
- Braithwaite, D. , Emery J., de Lusignan S., and Sutton S.. 2003. “Using the Internet to Conduct Surveys of Health Professionals: A Valid Alternative?” Family Practice 20: 545–51. [DOI] [PubMed] [Google Scholar]
- Cho, Y. I. , Johnson T. P., and Vangeest J. B.. 2013. “Enhancing Surveys of Health Care Professionals: A Meta‐analysis of Techniques to Improve Response.” Evaluation and the Health Professions 36 (3): 382–407. [DOI] [PubMed] [Google Scholar]
- Cook, J. V. , Dickinson H. O., and Eccles M. P.. 2009. “Response Rates in Postal Surveys of Healthcare Professionals between 1996 and 2005: An Observational Study.” BMC Health Services Research 9: 160. [DOI] [PMC free article] [PubMed] [Google Scholar]
- Cull, W. L. , O'Connor K. G., Sharp S., and Tang S. F.. 2005. “Response Rates and Response Bias for 50 Surveys of Pediatricians.” Health Services Research 40 (1): 213–26. [DOI] [PMC free article] [PubMed] [Google Scholar]
- de Leeuw, E. 2005. “To Mix or Not to Mix Data Collection Modes in Survey.” Journal of Official Statistics 21 (2): 233–55. [Google Scholar]
- Dillman, D. A. , Smyth J. D., and Christian L. M.. 2009. Internet, Mail, and Mixed‐mode Surveys: The Tailored Design Method, 3rd Edition Hoboken, NJ: Wiley & Sons. [Google Scholar]
- Dykema, J. , Stevenson J., Day B., Sellers S. L., and Bonham V. L.. 2011. “Effects of Incentives and Prenotification on Response Rates and Costs in a National Web Survey of Physicians.” Evaluation of the Health Professions 34 (4): 434–47. [DOI] [PMC free article] [PubMed] [Google Scholar]
- Dykema, J. , Jones N. R., Piche T., and Stevenson J.. 2013. “Surveying Clinicians by Web: Current Issues in Design and Administration.” Evaluation and the Health Professions 36 (3): 352–81. [DOI] [PubMed] [Google Scholar]
- Ernst, S. A. , Brand T., Lhachimi S. K., and Zeeb H.. 2018. “Combining Internet‐Based and Postal Survey Methods in a Survey among Gynecologists: Results of a Randomized Trial.” Health Services Research 53 (2): 879–95 10.1111/1475-6773.12664 [DOI] [PMC free article] [PubMed] [Google Scholar]
- Groves, R. M. , Singer E., and Corning A.. 2000. “Leverage‐Saliency Theory of Survey Participation: Description and an Illustration.” Public Opinion Quarterly 64 (3): 299–308. [DOI] [PubMed] [Google Scholar]
- Hocking, J. S. , Lim M. S., Read T., and Hellard M.. 2006. “Postal Surveys of Physicians Gave Superior Response Rates over Telephone Interviews in a Randomized Trial.” Journal of Clinical Epidemiology 59 (5): 521–4. [DOI] [PubMed] [Google Scholar]
- Kellerman, S. E. , and Herold J.. 2001. “Physician Response to Surveys. A Review of the Literature.” American Journal of Preventive Medicine 20 (1): 61–7. [DOI] [PubMed] [Google Scholar]
- Klabunde, C. N. , Willis G. B., and Casalino L. P.. 2013. “Facilitators and Barriers to Survey Participation by Physicians: A Call to Action for Researchers.” Evaluation and the Health Professions 36 (3): 279–95. [DOI] [PubMed] [Google Scholar]
- Kroth, P. J. , McPherson L., Leverence R., Pace W., Daniels E., Rhyme R. L., Williams R. L., and Prime Net Consortium . 2009. “Combining Web‐based and Mail Surveys Improves Response Rates: A PBRN Study from PRIME Net.” Annals of Family Medicine 7 (3): 245–8. [DOI] [PMC free article] [PubMed] [Google Scholar]
- Lusk, C. , Delclos G. L., Burau K., Drawhorn D. D., and Aday L. A.. 2007. “Mail Versus Internet Surveys: Determinants of Method of Response Preferences among Health Professionals.” Evaluation and the Health Professions 30 (2): 186–201. [DOI] [PubMed] [Google Scholar]
- McFarlane, E. , Olmsted M. G., Murphy J., and Hill C. A.. 2007. “Nonresponse Bias in a Mail Survey of Physicians.” Evaluation and the Health Professions 30 (2): 170–85. [DOI] [PubMed] [Google Scholar]
- McLeod, C. C. , Klabunde C. N., Willis G. B., and Stark D.. 2013. “Health Care Provider Surveys in the United States, 2000‐2010: A Review.” Evaluation and the Health Professions 36 (1): 106–26. [DOI] [PubMed] [Google Scholar]
- McMahon, S. R. , Iwamoto M., Massoudi M. S., Yusuf H. R., Stevenson J. M., David F., Chu S. Y., and Pickering L. K.. 2003. “Comparison of E‐mail, Fax, and Postal Surveys of Pediatricians.” Pediatrics 111 (4 Pt 1): e299–303. [DOI] [PubMed] [Google Scholar]
- Millar, M. M. , and Dillman D. A.. 2011. “Improving Response to Web and Mixed‐Mode Surveys.” Public Opinion Quarterly 75: 249–69. [Google Scholar]
- Minniear, T. D. , McIntosh E. B., Alexander N., Weidle P. J., and Fulton J.. 2013. “Using Electronic Surveys to Gather Information on Physician Practices during Response to a Local Epidemic—Rhode Island, 2011.” Annals of Epidemiology 23 (8): 521–3. [DOI] [PubMed] [Google Scholar]
- Moore, D. L. , and Tarnai J.. 2002. “Evaluating Nonresponse Error in Mail Surveys” In Survey Nonresponse, edited by Groves R. M., Dillman D. A., Eltinge J. L., and Little R. J. A., pp. 197–211. New York: John Wiley & Sons. [Google Scholar]
- Pit, S. W. , Vo T., and Pyakurel S.. 2014. “The Effectiveness of Recruitment Strategies on General Practitioner's Survey Response Rates — A Systematic Review.” BMC Medical Research Methodology 14: 76. [DOI] [PMC free article] [PubMed] [Google Scholar]
- Puleo, E. , Zapka J., White M. J., Mouchawar J., Somkin C., and Taplin S.. 2002. “Caffeine, Cajoling, and Other Strategies to Maximize Clinician Survey Response Rates.” Evaluation and the Health Professions 25 (2): 169–84. [DOI] [PubMed] [Google Scholar]
- Rocca, W. A. , Yawn B. P., St. Sauver J. L., Grossardt B. R., and Melton L. J. 3rd. 2012. “History of the Rochester Epidemiology Project: Half a Century of Medical Records Linkage in a US Population.” Mayo Clinic Proceedings 87 (12): 1202–13. [DOI] [PMC free article] [PubMed] [Google Scholar]
- Roxburgh, M. 2006. “An Exploration of Factors which Constrain Nurses from Research Participation.” Journal of Clinical Nursing 15 (5): 535–45. [DOI] [PubMed] [Google Scholar]
- Rutten, L. J. , St. Sauver J. L., Beebe T. J., Wilson P. M., Jacobson D. J., Fan C., Breitkopf C. R., Vadaparampil S. T., and Jacobson R. M.. 2017. “Clinician Knowledge, Clinician Barriers, and Perceived Parental Barriers Regarding Human Papillomavirus Vaccination: Association with Initiation and Completion Rates.” Vaccine 35 (1): 164–9. [DOI] [PMC free article] [PubMed] [Google Scholar]
- Schleyer, T. K. , and Forrest J. L.. 2000. “Methods for the Design and Administration of Web‐based Surveys.” Journal of the American Medical Informatics Association 7 (4): 416–25. [DOI] [PMC free article] [PubMed] [Google Scholar]
- Sebo, P. , Maisonneuve H., Cerutti B., Fournier J. P., Senn N., and Haller D. M.. 2017. “Rates, Delays, and Completeness of General Practitioners’ Responses to a Post Versus Web‐Based Survey: A Randomized Trial.” Journal of Medical Internet Research 19 (3): e83. [DOI] [PMC free article] [PubMed] [Google Scholar]
- St. Sauver, J. L. , Grossardt B. R., Yawn B. P., Melton L. J. 3rd, Pankratz J. J., Brue S. M., and Rocca W. A.. 2012. “Data Resource Profile: The Rochester Epidemiology Project (REP) Medical Records‐linkage System.” International Journal of Epidemiology 41 (6): 1614–24. [DOI] [PMC free article] [PubMed] [Google Scholar]
- Thorpe, C. , Ryan B., McLean S. L., Burt A., Stewart M., Brown J. B., Reid G. J., and Harris S.. 2009. “How to Obtain Excellent Response Rates When Surveying Physicians.” Family Practice 26 (1): 65–8. [DOI] [PubMed] [Google Scholar]
- VanGeest, J. B. , Beebe T. J., and Johnson T. P.. 2014. “Surveys of Physicians” In Handbook of Survey Methods, edited by Johnson T. P., pp. 515–43. Hoboken, NJ: John Wiley & Sons. [Google Scholar]
- VanGeest, J. B. , Johnson T. P., and Welch V. L.. 2007. “Methodologies for Improving Response Rates in Surveys of Physicians: A Systematic Review.” Evaluation and the Health Professions 30 (4): 303–21. [DOI] [PubMed] [Google Scholar]