

Abstract
Objective
To build and test a model that predicts community discharge probabilities for Medicaid‐eligible nursing home (NH) residents who remain in the nursing home at 90 days after admission and, thus, would be candidates for the Money Follows the Person (MFP) program.
Data Source
The Minimum Data Set, Medicaid Management Information Systems, and Minnesota Vital Statistics file.
Data
Cohort of 33, 590 nursing home stays that qualified for Medicaid by the 90th day of their stay from 383 Minnesota nursing homes from July 2011 to June 2013.
Study Design
Mixed effects logistic regression model to predict community discharge.
Principal Findings
The scoring system had a high level of accuracy in predicting community discharge for both the fitting and validation cohorts. Subpopulations with severe mental illness or intellectual disability were well represented across the entire score range.
Conclusions
Findings are being applied in the Minnesota's MFP initiative (Moving Home Minnesota) to target Medicaid‐eligible NH residents for transitioning to the community. This approach could be applied to MFP in other states.
Keywords: Modeling, multi‐level, long‐term care, Medicaid, quality improvement
Minnesota has joined 42 other states and the District of Columbia in participating in the Federal Money Follows the Person (MFP) Rebalancing Demonstration Grant. One of the primary goals of MFP is to increase the use of home‐ and community‐based services (HCBS) while simultaneously reducing the use of institutionally based services (CMS 2016). One aspect of this takes the form of transitioning individuals from the nursing home back into the community. To participate in MFP, an individual must be eligible for Medical Assistance (MA) and live in an institution such as a nursing home for 90 days or more excluding Medicare rehabilitation days (DHS 2017).
The MFP was motivated at least in part by the Supreme Court's Olmstead decision of 1999 when the court ruled that public community‐based services must be provided to individuals with disabilities “when appropriate, not opposed by the person affected, and when reasonably accommodated by the public entity” (ADA, 2016). The MFP programs appear to have met these objectives. Evaluation findings point to sustained quality of life improvements for those who transition into the community through the program (Irvin et al. 2015).
Although the elderly constitute the majority of the Medicaid population, MFP has gained the most ground for the younger adult subpopulation with intellectual disability, physical disability, or severe mental illness (Irvin et al. 2015). Nationally, only 11,440 Medicaid NH residents were transitioned through MFP in 2015, representing only a tiny fraction of the 1.4 million nursing home residents (Morris et al. 2016). Only 36 percent of MFP transitioned residents were above the age of 65. In contrast, 11 to 13 percent of mainly elderly residents who remained in NHs nationally have been determined to be low care (Mor et al. 2007; Thomas and Mor 2013).
These findings suggest that MFP might target individuals, both young and old, with low needs or other characteristics that increase the likelihood of community discharge. Ideally, targeting would optimize the allocation of MFP resources while increasing the rate of successful community transitions. The research literature offers little guidance on how to accomplish such targeting.
In prior research, Arling et al. (2010, 2011) studied the individual, facility, and market factors associated with community discharge of nursing home residents in Minnesota. This study addressed community discharge in the first 90 days after admission for an admission cohort of all pay sources. In their study, Medicaid status was negatively related to community discharge. Preference for returning to the community, as expected, had a strong positive relationship. Having a Medicare postacute stay, age, and health and functional status variables, such as greater independence in activities of daily living, absence of severe cognitive impairment, and being continent, was also predictive of community discharge. When compared to private pay residents, a different set of factors may influence community discharge of Medicaid residents (Liu, Coughlin, and McBride 1991; Holup et al. 2015). In addition, this earlier study did not address community discharge for individuals with severe mental illness and developmental disabilities who are a priority for MFP.
In developing a scoring system for the purpose of targeting, we made several assumptions. First, the targeting score should be predictive of community discharge. It should identify residents who at admission would be most capable of discharging to the community, yet remain in the facility for 90 days and are likely to become permanent residents absent an intervention. Second, it should not use potentially modifiable variables unrelated to health and functioning but related to a resident's ability to transition to the community. Examples of modifiable variables are access to housing and availability of a caregiver, the absence of which can be a barrier to community discharge. Information about barriers to discharge may help locate individuals likely to benefit from program assistance; however, using them in a predictive model would have a confounding effect. These barriers are likely to be negatively correlated with community discharge. If so, individuals facing these barriers would receive a lower targeting score, suggesting that they should not be targeted by the program. Rather, such barriers represent gaps that the MFP programs are seeking to fill. Third, scoring should correlate meaningfully with resident outcomes such as mortality and nursing home readmission.
The objectives of our study were to (1) develop a predictive model of community discharge for the Medicaid population, (2) validate the model's accuracy in predicting community discharge, (3) convert the prediction model into a scoring system, and (4) determine how well community discharge scores predict long‐term patterns of NH use, community residence, and mortality within one year of admission. We pay particular attention to the distribution of scores for residents with severe mental illness or developmental disabilities.
Methods
Data
The study cohort consisted of admissions to Minnesota's nursing facilities from July 2011 to June 2013 that were Medicaid eligible at admission or within 90 days thereafter. Day 90 was the first day a resident was potentially eligible to participate in any MFP program. Each resident was followed for up to 365 days to determine if the resident died, was discharged to the community, remained in the NH, or was discharged and readmitted. The data were split into two 1‐year segments; the first was used for model building (n = 14,873) and the second for model validation (n = 16,969).
Data were from the Minimum Data Set (MDS) for each resident at admission and at the 90‐day assessment. The MDS contains standardized health and functioning data for residents from all long‐term care facilities certified to participate in Medicare or Medicaid (Saliba et al. 2012; Resdac 2017). Medicaid eligibility was determined according to the Medicaid Management Information System's (MMIS) Medicaid eligibility data set. The Minnesota Vital Statistics file was used for mortality.
Predictors
Prior work and the availability of variables in the MDS guided the selection of potential predictors (Greene and Ondrich 1990; Liu, Coughlin, and McBride 1991; McFall and Miller 1992; Engle and Graney 1993; Boaz and Muller 1994; Fried and Mor 1997; Ahmed, Allman, and DeLong 2003; Arling et al. 2010; Gassoumis et al. 2013). Variables selected for modeling came from the Minimum Data Set (MDS) admission assessment. An important variable was preference for community discharge as indicated by the resident at the time of admission (MDS Section Q). Dependency in ADLs was scored according to the RUG‐IV ADL index from items covering assistance with eating, transferring, bed mobility, and toileting. It was binned into four groups (0–4, 5–8, 9–12, and 13–16). The use of postacute rehabilitation refers to the Medicare RUG‐IV Rehabilitation category. Cognitive impairment was determined by a score of 12 or less on the Brief Interview for Mental Status (BIMS) or assessment items related to memory and decision making (Saliba et al. 2012). Behavior problems were measured by one or more specific behaviors in MDS Section E that occurred at least weekly. Other items from the MDS were demographics of age, gender, marital status; diagnoses of congestive heart failure, stroke, incontinence, end‐stage disease, or hip fracture; and admission from acute care.
Model building
The outcome of interest was whether the resident discharged to the community by day 180 after initial admission. Community discharge rates for MA nursing home residents are very low beyond 180 days (Wenzlow and Lipson 2009). The resident had to remain in the community for at least 30 days to count as a community discharge. Readmissions within that time were considered a continuation of the previous stay. A natural choice for a binary outcome is the logistic regression model. Most work on community discharge modeling utilizes either a form of logistic regression (Engle and Graney 1993; Boaz and Muller 1994; Arling et al. 2010; Gassoumis et al. 2013; Holup et al. 2015) or a time to event analysis that involves estimation of a hazard function such as the Cox model (Greene and Ondrich 1990; Liu et al. 1991; Gassoumis et al. 2013; Mudrazija, Thomeer, and Angel 2015). Our choice of the logistic model was driven by our interest in the possibility of discharge rather than the time to discharge. Our goal is to relate health, functioning, and other characteristics taken from the MDS to the likelihood of discharge to the community. This allows us to better understand the profile of those who return to the community and to predict which nursing home residents are most likely to be able to make that transition.
We chose a mixed effects logistic regression model because of the nesting of residents within facilities. Prior studies have shown that certain facility characteristics are related to community discharge rates (Bliesmer et al. 1998; Arling et al. 2011; Holup et al. 2015). However, our interest lies not in predicting community discharge, per se, but in understanding the profile of those that are able to return to the community. To control for the unique effects of specific facilities (and to some extent the community in which it is located), we estimated a random intercept for each facility. This allows the estimated effects of the resident characteristics to be the marginal effects, or those effects remaining after the variability due to facility have been taken into account. In this way, the model targets individuals who are measurably similar to those who discharge to the community with the hope that the program is able to concentrate on modifiable characteristics related to discharge such as lack of housing or community services. Results from a fixed effect model were substantially the same, and the predictive accuracy was nearly identical to the mixed effects model presented. The model was fit using the Glimmix procedure in SAS version 9.4. For an excellent resource on mixed effects logistic regression, see Agresti (2013).
Only data from July 2011 to June 2012 were used for model building. A long list of candidate variables was included in univariate logistic models with a facility random effect, and variables were assessed for statistical significance as well as predictive accuracy (as measured by the Chi‐square test and ROC area under the curve, respectively). Candidate variables showing promise were put into a multivariate logistic model that was reduced using backward selection. Variables in the final model are given in Table 1. Missing values were deleted list‐wise for modeling, and they were assumed to be the value least likely to be associated with community discharge for purposes of scoring and descriptive tables. For example, if a resident's preference for discharge at admission is unknown, we assume that the resident does not prefer discharge. This causes the model to be conservative in putting resident's in the highest score groups when data are missing.
Table 1.
Profile Variables for Scoring
| Variable | Coefficient | p‐Value | Odd's Ratio | Points |
|---|---|---|---|---|
| Prefers discharge | 2.177 | <.0001 | 8.82 | 24 |
| Not end stage of disease | 1.157 | <.0001 | 3.18 | 13 |
| ADL Score 1–4 (RUG IV) | 0.907 | <.0001 | 2.48 | 10 |
| ADL Score 5–8 (RUG IV) | 0.664 | <.0001 | 1.94 | 7 |
| ADL Score 9–12 (RUG IV) | 0.378 | <.0001 | 1.46 | 4 |
| Admitted from acute care | 0.850 | <.0001 | 2.34 | 9 |
| Under age 65 | 0.523 | <.0001 | 1.69 | 6 |
| Age 65–74 | 0.411 | <.0001 | 1.51 | 5 |
| Age 75–84 | 0.306 | <.0001 | 1.36 | 3 |
| Rehab (RUG IV) | 0.537 | <.0001 | 1.71 | 6 |
| Hip fracture | 0.501 | <.0001 | 1.65 | 6 |
| Continent | 0.448 | <.0001 | 1.56 | 5 |
| Cognitively intact | 0.348 | <.0001 | 1.42 | 4 |
| No behavior problems | 0.340 | <.0001 | 1.40 | 4 |
| No falls | 0.361 | <.0001 | 1.44 | 4 |
| No heart failure diagnosis | 0.350 | <.0001 | 1.42 | 4 |
| Female | 0.243 | <.0001 | 1.27 | 3 |
| No Alzheimer's/dementia diagnosis | 0.133 | 0.0517 | 1.14 | 1 |
| Profile score range | 0–99 |
Fixed effects from the final mixed effects logistic regression model are given, and all were significant at the 5% level with the exception of Alzheimer's/dementia diagnosis. Response is community discharge within 180 days of admission. The points’ column refers to the rescaled coefficients used in scoring.
Model validation
Data from July 2012 to June 2013 were used for model validation. Individuals from this time period were scored using the fixed effects only from the model. These predictions were then assessed using a Receiver Operator Curve (ROC). Validation results are presented in the Appendix SA2.
Scoring
Coefficients from the final model were transformed to produce a discharge score from 0 to 99, with higher scores being associated with higher chance of discharge. Baseline values of each variable were set such that all coefficients had a positive value. All coefficients were then divided by the smallest coefficient to make each variable relative to the smallest effect, rounded, and normalized so that the maximum achievable score was 99. The maximum was set to 99 to avoid any loss of confidence in the scoring by users should they otherwise encounter a score of 100 that does not subsequently discharge (as it is not a probability). For more on the practice of rounding and scaling regression coefficients, see Cole (1993), and for an example with logistic regression, see Fowler (2005).
Each variable, its point total, and the odd's ratio (above one being more likely to discharge and below one less likely to do so) associated with discharge are given in Table 1. Each resident was scored by adding up the points for each variable that was true of that resident. There are two variables that have multiple categories, age, and Activities of Daily Living (ADL) score, of which each resident can only fall into one category. The scores were then divided into five groups based on the quintiles of the scores of the model training data at admission. The score range which contained the highest 20 percent of scores was designated as the most likely to discharge, the next 20 percent as the second most likely to discharge, and so on down to the lowest 20 percent, which was the least likely to discharge. Visualizations of the percentage and count of residents belonging to each group over time are given in Figures 1 and S2 in Appendix SA2, respectively.
Figure 1.
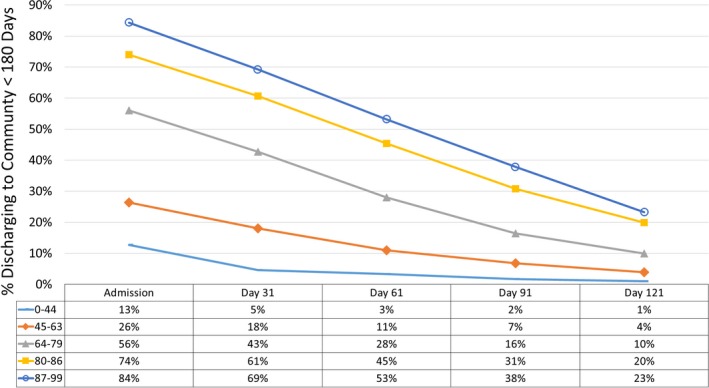
- Notes: Community discharge rates given for those who remain in the facility at the given day. Each line represents a different score quintile.
Results
Preferring community discharge when admitted is the strongest indicator that a nursing home resident would return to the community before day 180. Relatively better health (not being in the end stages of a disease and no heart failure diagnosis), younger than age 85, more functionally independent (lower ADL score), continent, no recent falls, having had a hip fracture, being cognitively intact, without a dementia diagnosis, absent behavioral problems, admitted from acute care and with a rehabilitation stay, and the female gender were all associated with community discharge. In this population, conditional on the included variables, marital status, and prior nursing home use within the previous 2 years were not significant predictors of community discharge.
To assess the model's consistency across time, the validation data were scored on the model built on the previous year's data, and ROC area under the curve was calculated for both data sets (Figure S1 in Appendix SA2). The training data scored a C‐statistic of 0.833 and the validation data scored 0.829, indicating the model's predictability generalizes across time.
To assess the ability of the five score groups to differentiate rates of discharge, rates were calculated for all five groups for both the training and validation data sets. Validation results are plotted in Figure 1. Results for all of the data are given in the Appendix SA2 (Table S1), and results for just those residents remaining in the nursing home until the 90th day following admission are given in Table S2 in Appendix SA2. Figure 1 highlights that the discharge rate increases with scoring group; the groups range from 13 percent in the lowest discharge score quintile to 84 percent in the highest discharge score quintile. This indicates that the model is able to differentiate among residents for their propensity to discharge. This pattern is consistent across the training and validation data, supporting that the model has strength for scoring future residents.
The target population for assistance is made up of those residents who remain until day 90, which continues to display differing propensities for discharge based on discharge score (Figure 1). The rates of community discharge have fallen off considerably for the top categories, and their numbers are much smaller than at initial admission because most of them have been discharged to the community.
Table 2 displays the characteristics of each discharge score group and their overall rates for the validation cohort that remained in the nursing home at least 90 days. Note that some characteristics stratify very well, such as preference for discharge, admitted from acute care, receiving rehabilitation, incontinence, and cognitive impairment, whereas other characteristics have a more uniform distribution. Intellectual disability and severe mental illness were not used in modeling or scoring because they had no significant relationship to community discharge. Residents with intellectual disability made up less than 1 percent of any score group. Residents with severe mental illness, 13 percent of the overall sample, were uniformly distributed across the score groups. Finally, residents having Medicaid at admission (85 percent of the sample) were also distributed uniformly across score groups.
Table 2.
Admission Characteristics of Validation Cohort by Score Groups for Residents Remaining in the Nursing Home for at Least 90 days
| By Score Group | Overall | ||||||
|---|---|---|---|---|---|---|---|
| 0–44 | 45–63 | 64–79 | 80–86 | 87–99 | Total | % Total | |
| Frequency | 1,472 | 1,877 | 1,193 | 709 | 370 | 5,621 | 100% |
| Preference for discharge | 0% | 6% | 93% | 100% | 100% | 2,288 | 41% |
| End‐stage disease | 9% | 1% | 1% | 0% | 0% | 166 | 3% |
| ADL Score 1–4 (RUG IV) | 18% | 36% | 18% | 28% | 61% | 1,579 | 28% |
| ADL Score 5–8 (RUG IV) | 21% | 27% | 22% | 31% | 24% | 1,387 | 25% |
| ADL Score 9–12 (RUG IV) | 24% | 22% | 33% | 38% | 15% | 1,504 | 27% |
| ADL Score 13–16 (RUG IV) | 37% | 14% | 26% | 3% | 0% | 1,151 | 20% |
| Admitted from acute care | 26% | 64% | 77% | 95% | 100% | 3,554 | 63% |
| Under age 65 | 6% | 19% | 23% | 37% | 56% | 1,196 | 21% |
| Age 65–74 | 12% | 17% | 18% | 20% | 28% | 956 | 17% |
| Age 75–84 | 28% | 27% | 23% | 24% | 11% | 1,401 | 25% |
| Age 85 plus | 54% | 37% | 36% | 19% | 5% | 2,068 | 37% |
| Rehab (RUG IV) | 39% | 75% | 88% | 93% | 98% | 4,049 | 72% |
| CPS moderate impaired | 68% | 38% | 31% | 14% | 2% | 2,196 | 39% |
| Incontinent | 70% | 35% | 55% | 20% | 2% | 2,503 | 45% |
| Falls | 20% | 8% | 14% | 6% | 2% | 663 | 12% |
| Heart failure diagnosis | 26% | 18% | 26% | 21% | 5% | 1,212 | 22% |
| Female | 64% | 65% | 59% | 59% | 73% | 3,553 | 63% |
| Hip fracture | 1% | 4% | 6% | 6% | 8% | 242 | 4% |
| Alzheimer's/dementia | 54% | 34% | 24% | 11% | 6% | 1,829 | 33% |
| Weekly behavior problems | 41% | 22% | 22% | 12% | 4% | 1,381 | 25% |
| Not used in scoring | |||||||
| Intellectual disability | 1% | 2% | 1% | 1% | 1% | 79 | 1% |
| Severe mental illness | 13% | 15% | 11% | 10% | 16% | 736 | 13% |
| MA at admission | 87% | 83% | 83% | 83% | 91% | 4,754 | 85% |
| Converted to MA in facility | 13% | 17% | 17% | 17% | 9% | 867 | 15% |
Percent of residents having characteristics in each score group given, along with overall totals and percentages. Intellectual disability and severe mental illness were not used in the model, but are given here to show their prevalence across score groups. All results taken from the admission MDS assessment.
Those characteristics with a propensity to change between the admission assessment and the 90‐day assessment were tested for statistically significant changes using either a paired t‐test or McNemar's test. These variables were ADL score on a 16‐point scale, receiving RUG‐IV rehabilitation category, moderately cognitively impaired, incontinent, and having weekly behavior problems. This analysis informs whether the population remaining in the nursing home until day 90 is declining substantially in health and functionality as measured in the MDS. Results of the test are included in Table S3 in Appendix SA2.
The one‐year postdischarge outcomes for the validation cohort by score group and subpopulation are given in Table 3. The discharge score correlates strongly with residents’ likelihood of remaining alive and in the community at 365 days postdischarge. Higher scoring residents were more likely to remain alive and in the community. Younger residents (under 65) were also more likely to remain alive and in the community. Those with an intellectual disability or a severe mental illness also had a higher rate of remaining in the community than those without these conditions.
Table 3.
One‐Year Postdischarge Outcomes for the Validation Cohort by Score Group and Subpopulation
| Discharged within 90 days | Discharged between 90 and 180 daysa | 365‐Day Postdischarge Outcome | |||||||
|---|---|---|---|---|---|---|---|---|---|
| Discharged to Community by day 180 | Remained in Nursing Home at day 180 | Total | |||||||
| Remained in the Community | Readmitted to NH at Least Once | Mortality | Remained in the Nursing Home | Mortality | Other | ||||
| Score group | |||||||||
| 0–44 | 12% | 2% | 7% | 3% | 3% | 36% | 48% | 4% | 3,088 |
| 45–63 | 23% | 7% | 14% | 7% | 5% | 41% | 26% | 7% | 3,502 |
| 64–79 | 51% | 16% | 30% | 16% | 8% | 22% | 16% | 7% | 3,777 |
| 80–86 | 68% | 31% | 45% | 19% | 9% | 12% | 9% | 6% | 3,547 |
| 87–99 | 80% | 38% | 58% | 19% | 7% | 6% | 5% | 5% | 3,055 |
| Age | |||||||||
| Under 65 | 57% | 28% | 43% | 14% | 5% | 15% | 13% | 9% | 4,970 |
| 65+ | 43% | 9% | 25% | 13% | 7% | 27% | 24% | 4% | 11,999 |
| Mental health | |||||||||
| Both | 46% | 19% | 33% | 11% | 6% | 31% | 10% | 11% | 72 |
| ID | 54% | 19% | 42% | 13% | 3% | 20% | 10% | 13% | 190 |
| SMI | 47% | 12% | 33% | 14% | 4% | 25% | 15% | 8% | 1,923 |
| None | 47% | 14% | 30% | 13% | 7% | 23% | 21% | 5% | 14,784 |
For those who did not discharge from the facility, follow‐up ends after 18 months postadmission. Other refers to discharges to noncommunity settings. Readmission to the NH is only counted from the community.
Denominator is those who remained in the NH for more than 90 days.
We estimate that each month there would be an average of 468 residents who remained in the nursing home for at least 90 days and were on Medicaid. Of those, 90 would be in the top two discharge score quintiles. This number represents the expected monthly workload for Moving Home Minnesota if the top two quintiles were targeted. Not all targeted residents will require or desire assistance; some will leave on their own, and others will decide to remain in the nursing home. See Figure S2 in Appendix SA2 for more on the pattern of the number of residents remaining in the facility over time.
Discussion
This predictive model has practical value in arraying individuals according to personal preference and health and functional characteristics that are related to community discharge. This allows the practitioner, who is tasked with facilitating transitions, to more easily prioritize time, spending more of it with the residents who in theory would be more easily transitioned and who might be served most appropriately in the community.
An important finding is the sharply decreasing rate of community discharge rates for the top profile categories (Figure 1) as length of stay increases. There are probably two major forces contributing to the decline in community discharge rates. The condition of the resident may have changed since admission, and he or she may no longer fit the profile scored at admission. This was examined for the few variables that are updated after the admission assessment. For the two highest score groups, ADL disability improved, but cognitive impairment and incontinence increased by statistically significant but practically small amounts. Alternatively, there may be barriers to departure not related to a change in condition, such as inability to line up social support or home‐ and community‐based services or to locate adequate housing. This situation is where MFP can be most useful counseling residents, helping them develop a discharge plan, and then helping to coordinate care postdischarge. It can assist individuals to go home who have not quite been able to do so.
Given the success of transitioning those with SMI and ID in other states (Irvin et al. 2015), it was particularly important that our model gives equal opportunity to these individuals to score well. Our work shows that these individuals are able to score across all quintiles as they have a variety of health and functioning characteristics similar to the population as a whole.
The difference in cost between nursing home and community care can be substantial, particularly as it accumulates across time. Given the significant number of residents still present in the NH 180 days after admission, there is potential for cost savings from the government perspective if the program is successful in transitioning residents who would not otherwise go. The increase in quality of life associated with returning to the community makes the program beneficial from the resident's perspective as well (Robison et al. 2015).
One concern about such a targeting model is that it could, if rigidly applied, restrict the pool of residents served by the program. Moving Home Minnesota uses the targeting results as a guide for prioritizing potential contacts; however, model scores are only one avenue by which likely candidates are identified. Any Medicaid resident at 90 days who seeks assistance, or is referred by the facility or a community agency, will be served.
Another concern is the uncertainty of Medicaid cost savings from this or any other targeting approach, or from MFP in general. There is no way to determine if individuals assisted by MFP would have remained in the nursing facility absent MFP. A substantial number of residents, 1,329 in our sample, discharged to the community on their own between 90 and 180 days. A targeting model calibrated on the propensity to return to the community could lead to false positives where MFP resources were directed to residents who had relatively good health and social resources and who would have left the facility without the program. If Medicaid cost savings is a major policy goal, then careful consideration should be given to each MFP candidate to assess barriers and facilitators for community discharge based on information beyond that available on the MDS. In addition, effects of targeting could be evaluated initially with a quasi‐experimental design that compared community discharge rates for targeted and nontargeted residents assisted by MFP.
Finally, we should caution about the generalization of findings to other states. Minnesota is unique in several respects. It has a large managed care population. Minnesota ranks near the top of states in availability of home‐ and community‐based services and length of stay for postacute residents (AARP Score Card 2014). Nonetheless, similar models could be developed for other states using the same general approach and uniformly collected MDS assessment data. Before being applied, models in other states should be validated for overall predictive accuracy and significance of risk factors, and scores should be calibrated for Medicaid populations in those states. Additionally, MFP efforts could be informed by a better understanding of the consumer decisions about NH use (Leedahl et al. 2015).
Supporting information
Appendix SA1: Author Matrix.
Appendix SA2:
Figure S1: ROC Curve for Final Model on Training and Validation Data.
Figure S2: Number of Residents Remaining in Facility over Time by Score Group.
Table S1: Resident and Discharge Counts, and Discharge Rates by Score Group for All Admissions.
Table S2: Resident and Discharge Counts, and Discharge Rates by Score Group for 90+ Day Stays.
Table S3: Quarterly Assessment Characteristics of Validation Cohort by Admission Score Groups.
Acknowledgments
Joint Acknowledgment/Disclosure Statement: One of the authors, Dr. Robert Kane, passed away after submission of the manuscript, but prior to revisions. This work was funded by the Minnesota Department of Human Services. There are no other disclosures.
Disclosures: None.
Disclaimer: None.
References
- AARP Score Card . 2014. “Raising Expectations” [accessed on November 29, 2016]. Available at http://www.longtermscorecard.org/
- ADA . 2016. “Olmstead: Community Integration for Everyone.” [accessed on August 16, 2016]. Available at https://www.ada.gov/olmstead/olmstead_about.htm
- Agresti, A. 2013. Categorical Data Analysis, 3rd Edition Hoboken, NJ: John Wiley & Sons. [Google Scholar]
- Ahmed, A. , Allman R. M., and DeLong J. F.. 2003. “Predictors of Nursing Home Admission for Older Adults Hospitalized with Heart Failure.” Archives of Gerontology and Geriatrics 36 (2): 117–26. [DOI] [PubMed] [Google Scholar]
- Arling, G. , Kane R. L., Cooke V., and Lewis T.. 2010. “Targeting Residents for Transitions from Nursing Home to Community.” Health Services Research 45 (3): 691–711. [DOI] [PMC free article] [PubMed] [Google Scholar]
- Arling, G. , Abrahamson K. A., Cooke V., Kane R. L., and Lewis T.. 2011. “Facility and Market Factors Affecting Transitions from Nursing Home to Community.” Medical Care 49 (9): 790–6. [DOI] [PubMed] [Google Scholar]
- Bliesmer, M. M. , Smayling M., Kane R. L., and Shannon I.. 1998. “The Relationship between Nursing Staffing Levels and Nursing Home Outcomes.” Journal of Aging and Health 10 (3): 351–71. [DOI] [PubMed] [Google Scholar]
- Boaz, R. F. , and Muller C. F.. 1994. “Predicting the Risk of “Permanent” Nursing Home Residence: The Role of Community Help as Indicated by Family Helpers and Prior Living Arrangements.” Health Services Research 29 (4): 391. [PMC free article] [PubMed] [Google Scholar]
- CMS . 2016. “Money Follows the Person” [accessed on July 15, 2016]. Available at https://www.medicaid.gov/Medicaid-CHIP-Program-Information/By-Topics/Long-Term-Services-and-Supports/Balancing/Money-Follows-the-Person.html
- Cole, T. J. 1993. “Algorithm AS 281: Scaling and Rounding Regression Coefficients to Integers.” Journal of the Royal Statistical Society. Series C. Applied Statistics 42 (1): 261–8. [Google Scholar]
- DHS . 2017. “Moving Home Minnesota Program Manual: Eligibility” [accessed on March 7, 2017]. Available at http://www.dhs.state.mn.us/
- Engle, V. F. , and Graney M. J.. 1993. “Predicting Outcomes of Nursing Home Residents: Death and Discharge Home.” Journal of Gerontology 48 (5): S269–75. [DOI] [PubMed] [Google Scholar]
- Fowler, V. G. , O'Brien S. M., Muhlbaier L. H., Corey G. R., Ferguson T. B., and Peterson E. D.. 2005. “Clinical Predictors of Major Infections after Cardiac Surgery.” Circulation 112 (9 suppl): I‐358. [DOI] [PubMed] [Google Scholar]
- Fried, T. R. , and Mor V.. 1997. “Frailty and Hospitalization of Long‐Term Stay Nursing Home Residents.” Journal of the American Geriatrics Society 45 (3): 265–9. [DOI] [PubMed] [Google Scholar]
- Gassoumis, Z. D. , Fike K. T., Rahman A. N., Enguidanos S. M., and Wilber K. H.. 2013. “Who Transitions to the Community from Nursing Homes? Comparing Patterns and Predictors for Short‐stay and Long‐stay Residents.” Home Health Care Services Quarterly 32 (2): 75–91. [DOI] [PMC free article] [PubMed] [Google Scholar]
- Greene, V. L. , and Ondrich J. I.. 1990. “Risk Factors for Nursing Home Admissions and Exits: A Discrete‐time Hazard Function Approach.” Journal of Gerontology 45 (6): S250–8. [DOI] [PubMed] [Google Scholar]
- Holup, A .A. , Gassoumis Z. D., Wilber K. H., and Hyer K.. 2015. “Community Discharge of Nursing Home Residents: The Role of Facility Characteristics.” Health Services Research 51 (2): 645–66. [DOI] [PMC free article] [PubMed] [Google Scholar]
- Irvin, C. V. , Lipson D., Simon S., Hodges M., Bohl A., Peebles V., Bary J., Sweeney M., Ruttner L., Orzol S., and Schurrer J.. 2015. Money Follows the Person 2014 Annual Evaluation Report. Final report submitted to the Centers for Medicare & Medicaid Services Cambridge, MA: Mathematica Policy Research. [Google Scholar]
- Leedahl, S. N. , Chapin R. K., Wendel C., Anne Baca B., Hasche L. K., and Townley G. W.. 2015. “Successful Strategies for Discharging Medicaid Nursing Home Residents with Mental Health Diagnoses to the Community.” Journal of Social Service Research 41 (2): 172–92. [Google Scholar]
- Liu, K. , Coughlin T., and McBride T.. 1991. “Predicting Nursing‐Home Admission and Length of Stay: A Duration Analysis.” Medical Care 29 (2): 125–41. [DOI] [PubMed] [Google Scholar]
- McFall, S. , and Miller B. H.. 1992. “Caregiver Burden and Nursing Home Admission of Frail Elderly Persons.” Journal of Gerontology 47 (2): S73–9. [DOI] [PubMed] [Google Scholar]
- Mor, V. , Zinn J., Gozalo P., Feng Z., Intrator O., and Grabowski D. C.. 2007. “Prospects for Transferring Nursing Home Residents to the Community.” Health Affairs 26 (6): 1762–71. [DOI] [PubMed] [Google Scholar]
- Morris, E. , Coughlin R., Hagen B., He C., Steiner A., Denny‐Brown N., McCusker L., Smoot J., Lester R. S., and Williams S. R.. 2016. Money Follows the Person Demonstration: Overview of State Grantee Progress, January to December 2015. Final report submitted to the Centers for Medicare & Medicaid Services Cambridge, MA: Mathematica Policy Research. [Google Scholar]
- Mudrazija, S. , Thomeer, M. B. , and Angel, J. L. . 2015. “Gender Differences in Institutional Long‐Term Care Transitions.” Women's Health Issues 25 (5): 441–9. [DOI] [PMC free article] [PubMed] [Google Scholar]
- ResDac . 2017. “Long Term Care Minimum Data Set 3.0.” [accessed on March 1, 2017]. Available at https://www.resdac.org/cms-data/files/mds-3.0
- Robison, J. , Porter M., Shugrue N., Kleppinger A., and Lambert D.. 2015. “Connecticut's ‘Money Follows the Person’ Yields Positive Results for Transitioning People Out of Institutions.” Health Affairs 34 (10): 1628–36. [DOI] [PubMed] [Google Scholar]
- Saliba, D. , Jones M., Streim J., Ouslander J., Berlowitz D., and Buchanan J.. 2012. “Overview of Significant Changes in the Minimum Data Set for Nursing Homes Version 3.0.” Journal of the American Medical Directors Association 13 (7): 595–601. [DOI] [PubMed] [Google Scholar]
- Thomas, K. S. , and Mor V.. 2013. “The Relationship between Older Americans Act Title III State Expenditures and Prevalence of Low‐Care Nursing Home Residents.” Health Services Research 48 (3): 1215–26. [DOI] [PMC free article] [PubMed] [Google Scholar]
- Wenzlow, A. T. , and Lipson D. J.. 2009. Transitioning Medicaid Enrollees from Institutions to the Community: Number of People Eligible and Number of Transitions Targeted under MFP. MFP Report from the Field 1. Ann Arbor, MI: Mathematica Policy Research. [Google Scholar]
Associated Data
This section collects any data citations, data availability statements, or supplementary materials included in this article.
Supplementary Materials
Appendix SA1: Author Matrix.
Appendix SA2:
Figure S1: ROC Curve for Final Model on Training and Validation Data.
Figure S2: Number of Residents Remaining in Facility over Time by Score Group.
Table S1: Resident and Discharge Counts, and Discharge Rates by Score Group for All Admissions.
Table S2: Resident and Discharge Counts, and Discharge Rates by Score Group for 90+ Day Stays.
Table S3: Quarterly Assessment Characteristics of Validation Cohort by Admission Score Groups.