Abstract
Purpose
The purpose of this study was to investigate the biological role and mechanism of miR-373 targeting of TFIIB-related factor 2 (BRF2) in the regulation of non-small cell lung cancer (NSCLC) cells.
Materials and Methods
miRNA microarray chip analysis of four paired NSCLC and adjacent non-tumor tissues was performed. Quantitative real-time polymerase chain reaction (qRT-PCR) andwestern blotting were used to detect the expression levels of miR-373 and BRF2 in NSCLC tissues and cell lines. The dual-luciferase reporter method was performed to determine if BRF2 is a target of miR-373. MTT, wound-healing, Transwell, and flow cytometric assays were conducted to examine the proliferation, migration, invasion, and cell cycle progression of NSCLC A549 cells, respectively; western blotting was used to detect the expression of epithelial-mesenchymal transition (EMT)–related proteins.
Results
The miRNA microarray chip analysis demonstrated that miR-373 was down-regulated in NSCLC tissues, and this result was confirmed by qRT-PCR. Additionally, miR-373 was confirmed to target BRF2. Moreover, miR-373 expression was inversely correlated with BRF2 expression in NSCLC tissues and cell lines; both miR-373 down-regulation and BRF2 up-regulation were strongly associated with the clinicopathological features and prognosis of NSCLC patients. In vitro, overexpression of miR-373 markedly inhibited cell proliferation, migration, and invasion; up-regulated the expression of E-cadherin; and down-regulated the expression of N-cadherin and Snail in A549 cell. Knockdown BRF2 by siRNA resulted in effects similar to those caused by overexpression of miR-373.
Conclusion
MiR-373 is decreased in NSCLC, and overexpression of miR-373 can suppress cell EMT, and inhibit the proliferation, migration, and invasion of NSCLC A549 cells by targeting BRF2.
Keywords: miR-373, BRF2, Non-small cell lung carcinoma, Cell proliferation, Cell migration inhibition, Epithelial-mesenchymal transition
Introduction
Lung cancer is the most common solid tumor, and it is well-known as a leading cause of cancer-related death worldwide due to its high mortality rate [1,2]. Approximately 85% of cancer patients have non-small cell lung cancer (NSCLC), one of the most predominant pathological types of lung cancers, and the incidence rates increases year after year [3]. The 5-year overall survival (OS) rate of NSCLC patients remains very poor mainly owing to its late diagnosis and the paucity of effective treatments [1]. Hence, novel and effective biomarkers are urgently needed for the diagnosis and therapy of NSCLC.
MicroRNAs (miRNAs), a family of small noncoding RNAs, are able to negatively regulate the expression of their target genes at the post-transcriptional level by binding to the 3′-untranslated regions (3′-UTRs) of their target genes [4,5]. Recently, numerous studies have shown that miRNAs are deregulated in multiple types of cancers and acted as regulators of tumor cellular functions, including proliferation, invasion, metastasis, differentiation, and apoptosis [6-8]. For instance, miR-373, which has been shown to be aberrantly expressed in a variety of human cancers, has also been found to be negatively expressed in NSCLC and to play a role in its occurrence, progression and metastasis of NSCLC [9,10]. However, the mechanism and function of miR-373 in NSCLC are unclear.
To the best of our knowledge, RNA polymerase (Pol) III is the predominant RNA polymerase, and it is responsible for the transcription of small (less than 300 nucleotides), untranslated RNAs, including miRNAs [11]. Of note, TFIIB-related factor2 (BRF2) located on chromosome 8p12, has been suggested to be an RNA Pol III transcription factor, and it plays a crucial role in Pol III recruitment and the accurate initiation of transcription [12,13]. Previous studies have shown that BRF2 is significantly overexpressed in various types of human tumors, including esophageal squamous cell cancer [14,15] and lung cancer tissues, and has been associated with the NSCLC progression [16]. Further evidence has suggested that overexpression of BRF2 may act as an oncogene in lung squamous cell carcinoma by up-regulateing the expression of RNA Pol III transcripts, resulting in tumorigenesis [17].
Considering the above observations, we hypothesized that the expression of miR-373 may be influenced by the presence of BRF2 in NSCLC. Thus, in the present study, we aimed to explore the molecular mechanism by which miR-373 mediates the growth and metastasis of NSCLC cells through its targeting of BRF2.
Materials and Methods
1. Patients and tissue samples
Human primary cancer tissues and corresponding nontumor lung tissues were obtained from 92 patients who underwent lung resection at our hospital from November 2014 to November 2016 and who were diagnosed with NSCLC based on histopathological evaluation (hematoxylin and eosin staining). All cancer tissues were shown to contain at least 50% malignant cells, and the non-tumor lung tissues from carcinoma patients did not have any tumor cell infiltration. None of the patients received radiotherapy, chemotherapy, or any other anticancer therapy before surgery. These cohorts were composed of 45 patients who were under 65 years old and 47 cases patients who were over 65 years old with an average age of 58.67±17.95 years; in total, there were 56 male and 36 female patients. There were 10 nonsmokers, 43 quitters, and 39 smokers in this study. According to the TNM staging criteria issued by the American Joint Committee on Cancer and the World Health Organization method, staging and differentiation were determined, respectively [18]. There were 29 patients in stage I, 38 in stage II, and 25 in stage III; 37 patients presented with well-differentiated carcinoma, 29 were moderately differentiated, and 26 were poorly differentiated. The histological types in this study included 43 adenocarcinoma and 49 squamous cell carcinoma patients. Of these 92 patients, 43 were central type, 39 were peripheral type and 10 were diffuse type. Forty-eight patients did not have lymph node metastasis, and 44 patients did; 30 patients did not have vascular invasion and 59 patients did. Mutations in EGFR, KRAS, BRAF, HER2, AKT1, PIK3CA, and ALK genes were detected in 38, 9, 3, 1, 1, 1, and 2 patients, respectively, of the 92 patients with NSCLC. All collected tissue samples were rapidly snap-frozen in liquid nitrogen and stored in liquid nitrogen at ‒80℃. Follow-up information for all patients was collected through referral, readmission records and regular telephone interviews, as well as through other methods. The follow-up ended in August 2017.
2. miRNA microarray chip analysis
Four NSCLC specimens and corresponding non-tumor lung tissues were randomly selected for miRNA microarray chip analysis by using 3.0 miRNA microarrays (Affymetrix, Santa Clara, CA). The RNA samples were labeled and hybridized according to an Agilent miRNA Complete Labelling and Hyb Kit (Agilent Technologies, Mississauga, ON, Canada). Agilent Genespring GX software ver. 9.0.5 (Agilent Technologies) was used for further data analysis. Genelists were generated using a fold change ≥ 2.0 and a p ≤ 0.05 [19].
3. Cell lines and cell culture
A normal human bronchial epithelial cell line (HBE) and human NSCLC cell lines, namely, A549, H1299, H1975, SPCA-1, and PC-9 cells (purchased from American Type Culture Collection), were cultured in RPMI -1640 (Gibco, Thermo Fisher Scientific Inc., Waltham, MA) medium (10% fetal bovine serum, 100 U/mL penicillin, and 100 μg/mL streptomycin) at 37℃ in 5% CO2. When the cells grew to 80% confluence in culture flasks, they were detached with a solution with 0.25% trypsin and 0.002% EDTA (Gibco, Thermo Fisher Scientific Inc.) and collected for transfection and subsequent experiments.
4. Luciferase reporter assay
The amplified human 3′-UTR segments of the BRF2 gene (containing the predicted miR-373 binding site) were inserted into pRL-TK vectors containing Renilla luciferase (Promega, Madison, WI) to generate the wild plasmid (BRF2 wt) or mutant plasmid (BRF2 mut) construct. For luciferase assays, A549 cells were seeded in 96-well plates and transfected with pLuc-3'-UTR, 10 ng Renilla and the mimic/negative control (NC) miRNA using Lipofectamine 2000 reagent (Invitrogen, Carlsbad, CA), the cells were collected and analyzed by applying Dual-Luciferase Reporter Assay System (Promega) after 48 hours. The luciferase activity values were normalized relative to that of the Renilla luciferase internal control. Single transfection or co-transfection of the reporter genes was completed in the following combinations: miR-373 mimic alone, BRF2-wt alone, NC+BRF2-wt, miR-373 mimic+BRF2-mut, and NC+BRF2-mut. Successful transfection of all cell treatment groups was confirmed prior to biological testing. Each experiment was repeated three times in duplicate.
5. Cell transfection and grouping
Lipofectamine 2000 reagent (11668-027, Gibco, Invitrogen) was used for transfection according to the manufacturer’s instructions. A549 cells (4×10⁴ cells/well) were seeded in a 96-well plate and divided into the following five groups: the Mock group (without any transfections), NC group (transfected with miR-373 NC sequence), miR-373 mimic group (transfected with miR-373 mimics), miR-373 inhibitor group (transfected with miR-373 inhibitor), and miR-373 inhibitor+si-BRF2 group (co-transfected with miR-373 inhibitor and small interfering RNA [siRNA] for BRF2). The culture solution was replaced with the conventional RPMI -1640 medium 1 hour prior to transfection. The oligonucleotide sequences for the miR-373 mimics, inhibitor, and NC, as well as the siRNA of BRF2, were purchased from Shanghai GenePharma (Shanghai, China). Following transfection, the cells were further incubated for subsequent analysis.
6. RNA extraction and polymerase chain reaction analyses
Total RNA was extracted by TRIzol reagent (Invitrogen) according to the instructions of the manufacturers, and was quantified by a NanoDrop 2000C instrument (Thermo Fisher Scientific). The polymerase chain reaction (PCR) primers used for amplification in this study in Table 1 were designed according to the published GenBank database using Primer Premier 5.0 (Premier Biosoft Inc., Paolo Alto, CA). The cDNA was synthesized by Shanghai GenePharma. A SYBR Green I PCR Core Reagent Kit (Applied Biosystems, Foster City, CA) was used to detect miR-373 and BRF2 expression with an ABI PRISM 7500 Real-time PCR system (Applied Biosystems) according to the manufacturer’s recommendations. The 2-ΔΔCt method was performed by using U6 or glyceraldehyde 3-phosphate dehydrogenase asthe internal reference and the formula: ΔΔCT=ΔCtexperimental group–ΔCtcontrol group. where, ΔCt=Ctdetected gene–Ctinternal reference. Experiments were repeated at least three times.
Table 1.
Primer sequences for real-time quantitative polymerase chain reaction
| Gene | Primer sequences (5′-3′) | |
|---|---|---|
| miR-373 | Forward | 5′-GTAGCAGGATGGCCCTAGAC-3′ |
| Reverse | 5′-CGCCCTCTGAACCTTCTCTT-3′ | |
| U6 | Forward | 5′-CTCGCTTCGGCAGCACA-3′ |
| Reverse | 5′-AACGCTTCACGAATTTGCGT-3′ | |
| BRF2 | Forward | 5′-GTGAAGCTCCTGGGACTGGAT-3′ |
| Reverse | 5′-GTATTTGGCTGGCACAGAAGG-3′ | |
| GAPDH | Forward | 5′-AGGTCGGTGTGAACGGATTTG-3′ |
| Reverse | 5′-TGTAGACCATGTAGTTGAGGTCA-3′ |
7. Western blot analysis
Total cellular protein was extracted and determined with a bicinchoninic acid protein assay kit (Boster, Wuhan, China). The extracted proteins were added to sample loading buffer, boiled for 10 minutes at 95℃, detached by 10% sodium dodecyl sulfate-polyacrylamide gel electrophoresis (Boster), and transferred to polyvinylidene fluoride membranes (Millipore, Bedford, MA) by semi-dry blotting; then, the membranes were blocked with 5% bovine serum albumin for 1 hour at room temperature and incubated overnight at 4ºC with anti-BRF2 (ab194442), anti‒E-cadherin (ab76055), anti‒N-cadherin (ab18203), anti-Snail (ab53519), or anti‒β-actin (ab8226). All antibodies were purchased from Abcam (Chicago, IL). Membranes were incubated at room temperature for 1 hour with horseradish peroxidase‒conjugated goat anti‑rabbit IgG (1:2,000) after being washed 3 times with Trisbuffered saline containing Tween-20 (TBST). Protein bands were detected using the Chemi-Lumi One L western blotting substrate (Nacalai Tesque, Kyoto, Japan). The relative protein levels were normalized to the concentration of β-actin and all experiments were run 3 times.
8. MTT assay for cell proliferation
A549 cells were grown in complete medium in 96-well plates at 5×10³ cells/well, and after transfection, were cultured for 24, 48, or 72 hours at 37ºC in 5% CO2 after transfection. A volume of 20 μL of MTT (Promega) was added to each well. The results were measured as the optical density value at 490 nm after 4 hours using a multifunction enzymelinked analyzer (SpectraMax M5, Molecular Devices, Sunnyvale, CA). All experiments were confirmed with at least three independent experiments.
9. Wound-healing assay
A549 cells were seeded in 6-well plates and incubated at 37ºC for 24 hours. Before transfection, linear wounds were generated gently by dragging a pipette tip through the monolayer; then, the cells were washed three times with phosphate-buffered saline (PBS) and incubated in serum-free medium. The healing process was subsequently photographed at 0 and 24 hours with a microscope (Olympus 600 autobiochemical analyzer, Tokyo, Japan). Migration distance was measured in the photographed images (6 fields) using counting software. The experiment was repeated at least 3 times.
10. Transwell invasion assay
Polycarbonate membrane culture inserts with an eight-micrometer-pore size polycarbonate membrane culture inserts (Trans-well, Costar, High Wycombe, UK) were placed into the wells of 24-well culture plates, separating the upper and lower chambers. Five hundred microliters of RPMI 1640 medium containing 10% fetal bovine serum was added to the lower chamber, and serum-free medium containing 5×10⁴ A549 cells was added to the upper chamber. After incubation at 37℃ with 5% CO2 for 24 hours, the number of invading cells was quantified by counting six independent visual fields under the microscope (Olympus 600 autobiochemical analyzer), and cell morphology was observed by staining with 0.1% crystal violet for 10 minutes. Each experiment was performed at least three times.
11. Cell cycle analysis
Propidium iodide (PI) staining flow cytometry was used to assess cell cycle distribution. Briefly, transfected A549 cells were released by trypsinization, collected, washed with cold PBS, and then fixed in 70% ethanol at 4℃ overnight. Then, the fixed cells were suspended in 250 μL of RNase A buffer (100 ng/mL), and labeled with a 2× solution of PI (100 ng/mL) for 30 minutes at 4℃. Finally, the stained cells were analyzed by a flow cytometer (FC500 Flow Cytometer, Beckman Coulter, Fullerton, CA).
12. Statistical analysis
SPSS ver. 18.0 software (SPSS Inc., Chicago, IL) was used for all statistical analyses. The results were presented as the means±standard deviation from at least three independently experiments. Student’s t test (two-tailed) was used for comparing two groups, and one-way analysis of variance (ANOVA), followed by Bonferroni post test was evaluated with the comparing more than two groups. Survival analysis was performed by Kaplan-Meier method. A p < 0.05 was considered to indicate a statistically significant difference.
13. Ethical statement
This study protocol received approval from the Human Ethics Committee of the First Affiliated Hospital of Harbin Medical University, and all participants signed the consent forms before participating in this research.
Results
1. miRNA microarray chip analysis and luciferase assay
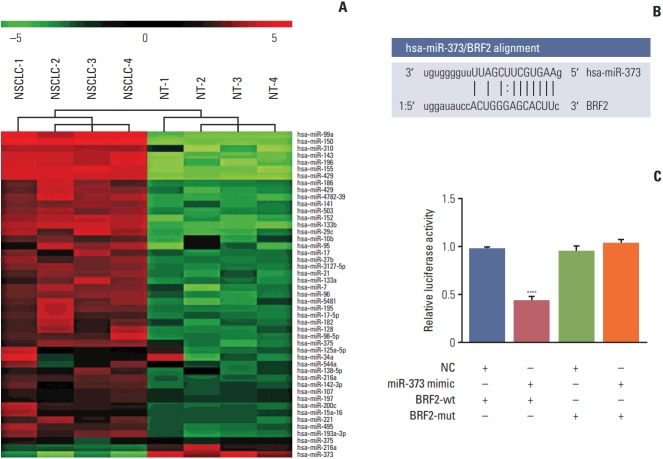
Among 47 identified candidate miRNAs, the miRNA microarray chip analysis showed that the levels expression of miR-373, miR-216a, and miR-375 were significantly downregulated in NSCLC tissues (Fig. 1A). Of these miRNAs, miR-373 was selected as a potential regulator of BRF2 on the basis of the prediction by the online bioinformatics analysis software microRNA.org (http://www.microrna.org/microrna/home.do) (Fig. 1B). Moreover, the results of the luciferase assay demonstrated that miR-373 substantially decreased luciferase activity when the reporter plasmid carried the wild-type BRF2 3′-UTR (p < 0.001); conversely, no significant change in luciferase activity was found when the mutant BRF2 3′-UTR (Fig. 1C) was used, further supporting miR-373 targeting of BRF2.
Fig. 1.
miRNA microarray chip analysis and luciferase assay. (A) miRNA microarray chip analysis was performed to identify miRNAs in tumor tissues of five non-small cell lung cancer patients and their corresponding non-tumor lung tissues. (B) The predicted miR-373 binding site on the BRF2 3′-untranslated region (3′-UTR) and the corresponding mutant binding site are shown. (C) Relative activities of luciferase reporters encoding the BRF2 3′-UTR variants co-transfected either the with miR-373 mimic or negative control (NC) oligonucleotides in NSCLC A549 cells. ****p < 0.001 compared with the other three groups.
2. Expression of miR-373 and BRF2 in NSCLC tissues and adjacent tissues
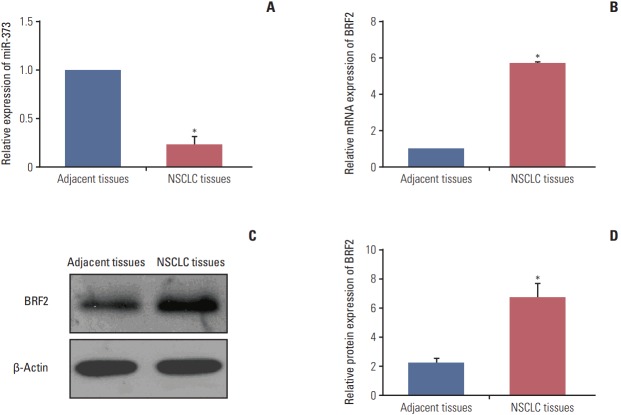
As illustrated in Fig. 2, miR-373 expression level was significantly decreased in all 92 NSCLC tissues when compared with the level in corresponding adjacent tissues (p < 0.001). In contrast to miR-373 expression, the mRNA and protein expression levels of BRF2 were markedly higher in NSCLC tissues compared to those in normal tissues (all p < 0.001).
Fig. 2.
The expression levels of miR-373 and BRF2 in non-small cell lung cancer (NSCLC) tissues and adjacent normal tissues. (A, B) Quantitative real-time polymerase chain reaction was used to detect the relative expression levels of miR-373 (A) and BRF2 (B) in 92 paired NSCLC tissues and adjacent non-tumor tissues. (C, D) Western blotting was performed to measure the relative protein expression level of BRF2 in 92 paired NSCLC tissues and adjacent non-tumor tissues. *p < 0.05 compared with adjacent tissues.
3. Correlation of miR-373 and BRF2 expression levels with clinicopathological factors and prognosis
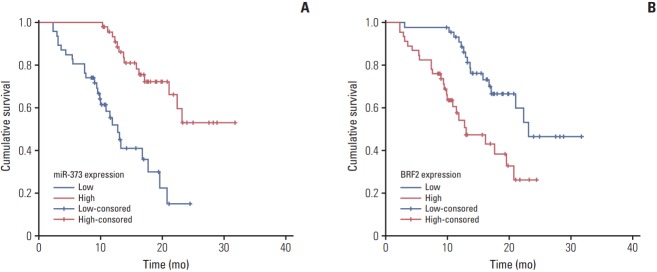
To evaluate the association of miR-373 and BRF2 expression levels with clinicopathological factors in NSCLC (excluding their association with BRAF, HER2, AKT1, ALK, and PIK3CA mutations since a several patients in the study were known carriers of these alterations), the patients were divided into high- and low-expression groups according to the median relative expression levels of miR-373 (median, 0.235) and BRF2 (median, 5.730). As revealed in Table 2, the expression of miR-373 had a close relationship with the degree of differentiation, histology type, lymph node metastasis, clinical stage, vascular invasion, and KRAS mutation in NSCLC (all p < 0.05), but was not related to sex, age, smoking history, or EGFR mutation (all p > 0.05). Partially consistent with miR-373, BRF2 expression was also highly related to differentiation degree, lymph node metastasis, clinical stage, and vascular invasion (all p < 0.05), but no correlation with sex, age, smoking history, histology type, KRAS mutation, or EGFR mutation was observed (all p > 0.05). Additionally, as shown in Fig. 3, the Kaplan-Meier analysis showed that the expression levels of miR-373 and BRF2 were related to prognosis of patients with NSCLC (both p < 0.001).
Table 2.
Correlation of miR-373 and BRF2 expression and clinical pathological characteristics of NSCLC patients
| Clinicopathological factor | No. | miR-373 |
p-value | BRF2 |
p-value | ||
|---|---|---|---|---|---|---|---|
| Low expression | High expression | Low expression | High expression | ||||
| Sex | |||||||
| Male | 56 | 30 | 26 | 27 | 29 | ||
| Female | 36 | 16 | 20 | 0.393 | 19 | 17 | 0.669 |
| Age (yr) | |||||||
| ≥ 65 | 47 | 20 | 27 | 27 | 20 | ||
| < 65 | 45 | 26 | 19 | 0.144 | 19 | 26 | 0.144 |
| Smoking history | |||||||
| Nonsmoker | 10 | 2 | 8 | 6 | 4 | ||
| Quitters | 43 | 20 | 23 | 24 | 19 | ||
| Smoker | 39 | 24 | 15 | 0.053 | 16 | 23 | 0.327 |
| Differentiation | |||||||
| Well-differentiated | 37 | 8 | 29 | 27 | 10 | ||
| Moderate-differentiated | 29 | 18 | 11 | 12 | 17 | ||
| Poorly-differentiated | 26 | 20 | 6 | < 0.001 | 7 | 19 | 0.001 |
| Histological tumor type | |||||||
| Adenocarcinoma | 43 | 14 | 29 | 25 | 18 | ||
| Squamous cell carcinoma | 49 | 32 | 17 | 0.002 | 21 | 28 | 0.144 |
| Tumor position | |||||||
| Central | 43 | 18 | 25 | 27 | 16 | ||
| Peripheral | 39 | 21 | 18 | 16 | 23 | ||
| Diffuse | 10 | 7 | 3 | 0.227 | 3 | 7 | 0.059 |
| Lymph node metastasis | |||||||
| With | 44 | 29 | 15 | 16 | 28 | ||
| Without | 48 | 17 | 31 | 0.004 | 30 | 18 | 0.012 |
| Clinical stage | |||||||
| I | 29 | 9 | 20 | 20 | 9 | ||
| II | 38 | 19 | 19 | 16 | 22 | ||
| III | 25 | 18 | 7 | 0.011 | 10 | 15 | 0.047 |
| Vascular invasion | |||||||
| With | 59 | 36 | 23 | 22 | 11 | ||
| Without | 33 | 10 | 23 | 0.005 | 24 | 35 | 0.017 |
| EGFR mutation | |||||||
| Yes | 38 | 21 | 17 | 15 | 23 | ||
| No | 54 | 25 | 29 | 0.397 | 31 | 23 | 0.138 |
| KRAS mutation | |||||||
| Yes | 9 | 8 | 1 | 2 | 7 | ||
| No | 83 | 38 | 45 | 0.030 | 44 | 39 | 0.158 |
NSCLC, non-small cell lung cancer.
Fig. 3.
The Kaplan-Meier curves of the relative expression levels of miR-373 (A) and BRF2 (B) in patients with non-small cell lung cancer.
4. Expression of miR-373 and BRF2 in NSCLC cells
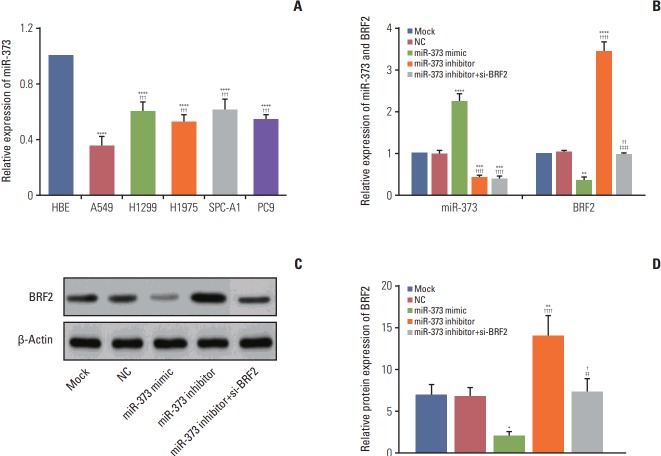
The expression levels of miR-373 and BRF2 were also examined in five NSCLC cell lines (A549, H1299, H1975, SPC-A-1, and PC-9) using the HBE cell line as a control, and the results showed that miR-373 was down-regulated in NSCLC cell lines compared to its expression in the normal HBE cell line (all p < 0.001). Of note, among these five NSCLC cell lines, miR-373 was decreased the most in A549 cells among these five NSCLC cell lines, which were selected for subsequent experiments (Fig. 4A). Furthermore, the expression levels of miR-373 and BRF2 in each transfected group were analyzed by quantitative real-time polymerase chain reaction and western blotting, and the results demonstrated that there was no significant difference between the Mock and NC group with regard to the expression of miR-373 and BRF2. The expression of miR-373 was significantly increased in the miR-373 mimic group, but was decreased in the miR-373 inhibitor and miR-373 inhibitor+si-BRF2 groups (all p < 0.05); however, the mRNA and protein levels expression of BRF2 were found to be substantially down-regulated in the miR-373 mimic group and highly overexpressed in the miR-373 inhibitor group compared with its expression in the Mock and NC groups (Fig. 4B). Meanwhile, the mRNA and protein expression levels of BRF2 in the miR-373 inhibitor+si-BRF2 group were significantly decreased when compared to that those of the miR-373 inhibitor group (all p < 0.05) (Fig. 4B-D).
Fig. 4.
The expression levels of miR-373 and BRF2 in different non-small cell lung cancer (NSCLC) cell lines and in a normal lung bronchus epithelial cell line. (A) Quantitative real-time polymerase chain reaction (qRT-PCR) was used to detect the relative expression of miR-373 in NSCLC cell lines and in normal lung bronchus epithelial cell line. ****p < 0.001 compared with cells from the human bronchial epithelial cell line; ††† p < 0.005, compared with A549 cells. (B) qRT-PCR was used to detect the relative expression levels of miR-373 and BRF2 in each transfected group. ****p < 0.001, ***p < 0.005, **p < 0.01 compared with the Mock and negative control (NC) groups; †††† p < 0.001, †† p < 0.01 compared with the miR-373 mimic group; ‡‡‡‡ p < 0.001 compared with the miR-373 inhibitor group. (C, D) Western blotting was performed to measure the relative protein expression of BRF2 in each transfected group. **p < 0.01, *p < 0.05 compared with the Mock and NC groups; †††† p < 0.001, † p < 0.05 compared with the miR-373 mimic group; ‡‡ p < 0.01 compared with the miR-373 inhibitor group. Each sample was analyzed in triplicate.
5. miR-373 repressed the proliferation of NSCLC A549 cells
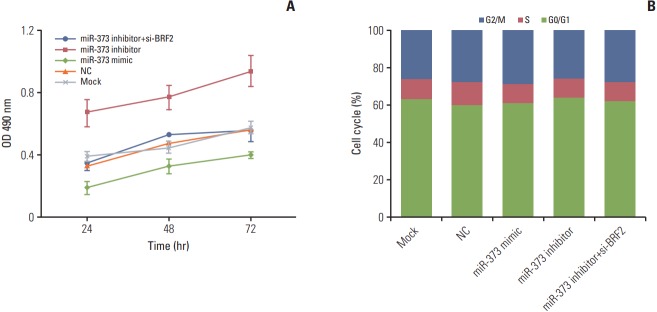
The result from the MTT assay demonstrated that compared with that of the Mock or NC groups, the proliferation of A549 cells in the miR-373 mimic group was clearly decreased and was greatly increased in the miR-373 inhibitor group (both p < 0.05). Furthermore, proliferation was remarkably decreased after co-transfection with both the miR-373 inhibitor and si-BRF2 compared to that of the miR-373 inhibitor group (p < 0.05) (Fig. 5A). These results indicated that miR-373 could inhibit the proliferation of A549 cells. In addition, cell cycle analysis by flow cytometry revealed that there were no significant differences in cell cycle progression among the transfected groups (all p > 0.05) (Fig. 5B).
Fig. 5.
Effects of miR-373 targeting of BRF2 on the proliferation and cell cycle progression of non-small cell lung cancer (NSCLC) A549 cells as determined using MTT and flow cytometric assays, respectively. (A) MTT assay was performed to examine NSCLC A549 cell proliferation at 24, 48, and 72 hours after transfection. (B) Flow cytometry assay analysis of cell cycle progression. Each sample was analyzed in triplicate. OD, optical density; NC, negative control.
6. MiR-373 inhibited cell migration and invasion in NSCLC A549 cells
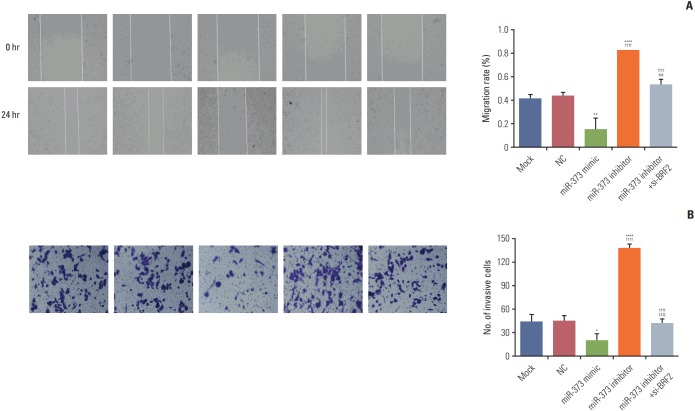
The results in Fig. 6A and B show a substantial reduction in cell migration and invasion in NSCLC A549 cells transfected with the miR-373 mimic, while cell migration and invasion ability were enhanced after transfection with the miR-373 inhibitor (all p < 0.05). Moreover, cell migratory and invasive abilities in the miR-373 inhibitor+si-BRF2 group were significantly lower than in the miR-373 inhibitor group (p < 0.005).
Fig. 6.
Effects of miR-373 targeting of BRF2 on the migration and invasion of non-small cell lung cancer A549 cells as determined by using wound-healing and Transwell assays, respectively. (A) The effect of miR-373 on the cell migration ability of A549 cells was verified by wound-healing experiments. (B) The effect of miR-373 on the cell invasion ability of A549 cells was verified by Transwell experiments. ****p < 0.001, **p < 0.01, *p < 0.05 compared with the Mock and negative control (NC) groups; ††††p < 0.001 compared with the miR-373 mimic group; ‡‡‡‡p < 0.001, ‡‡‡p < 0.005 compared with the miR-373 inhibitor group. Each sample was analyzed in triplicate.
7. Effect of miR-373 targeting of BRF2 on the epithelial-mesenchymal transition in A549 NSCLC cells
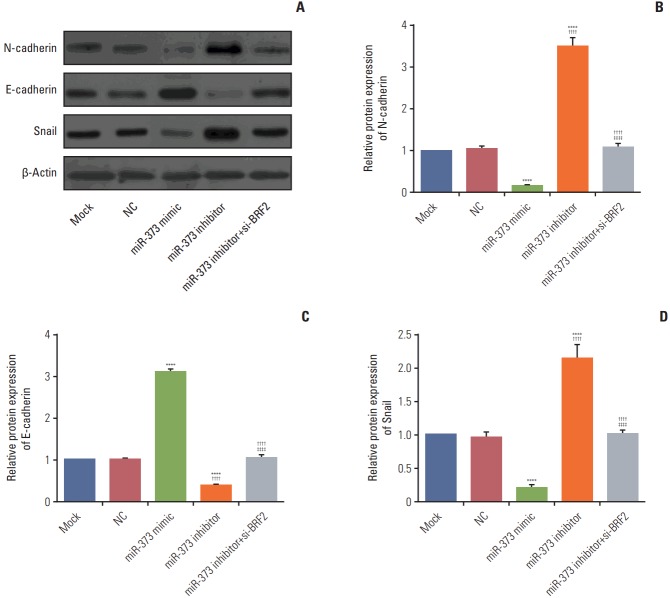
As revealed in Fig. 7, western blot results showed that there were no significantly difference in the protein expression levels of E-cadherin, N-cadherin, and Snail between Mock and NC group (all p > 0.05). When compared to their expression levels in the Mock and NC group, the miR-373 mimic substantially decreased N-cadherin and Snail expression levels and increased E-cadherin expression (all p < 0.05); conversely, the miR-373 inhibitor group demonstrated up-regulation of the expression of N-cadherin and Snail and a reduction in E-cadherin expression (all p < 0.05). Moreover, compared with miR-373 inhibitor group, the expression level of E-cadherin was significantly increased but N-cadherin and Snail expression levels were decreased in the miR-373 inhibitor+si-BRF2 group (p < 0.001), which indicated that miR-373 suppresses epithelial-mesenchymal transition (EMT) in A549 cells.
Fig. 7.
Effects of miR-373 targeting of BRF2 on the relative protein expression levels of N-cadherin (A, B), E-cadherin (A, C), and Snail (A, D) in non-small cell lung cancer A549 cells as determined by western blotting. ****p < 0.001 compared with the Mock and negative control (NC) groups; †††† p < 0.001 compared with the miR-373 mimic group; ‡‡‡‡ p < 0.001 compared with the miR-373 inhibitor group. Each sample was analyzed in triplicate.
Discussion
Recently, increasing studies have suggested that miRNAs are promising biomarkers for tumor monitoring since their aberrant expression has been observed to lead to a variety of diseases [7,20]. miR-373, located at chromosome 19q13.42 and the mature product of pri-miRNAs-371-373, has been shown to play a crucial role in tumorigenesis and metastasis [21]. In our experiments, miR-373 was observed to be strongly decreased in NSCLC tissue and cells. Consistent with our study, miR-373 has been demonstrated to be significantly down-regulated in human epithelial ovarian cancer [22] and was reduced by aberrant methylation in colon cancer, where it may exert oncogenic functions by regulating the expression of the oncogene RAB22A [23]. Moreover, miR-373 has a close relationship with lymph node metastasis, clinical stage and vascular invasion, indicating that miR-373 might function as a suppressor gene in the occurrence and development of tumors, including NSCLC. Notably, miR-373 plays a crucial role in regulating several RAS-pathway genes, such as RAB22A and RASSF1A, which are among the best characterized known cancer-related genes. Chen et al. [24] showed that miR-373 increased RASSF1A expression in hilar cholangiocarcinoma. Moreover, Voorhoeve et al. [25] also reported that miR-373 cooperates with oncogenic RAS, thus suppressing the growth and cellular transformation of testicular germ cell tumors. In addition, the mutation status of the KRAS gene, a member of the Ras gene family, has been reported that to be a prognostic or predictive marker in patients with NSCLC [26]. Importantly, our study further showed that patients with low expression of miR-373 had more frequent KRAS mutations than patients with high miR-373 expression. In addition, miR-373 was decreased the most in A549 cells that harbored with a mutated KRAS gene, confirming our clinical results and supporting the importance of miR-373 in KRAS-activated NSCLC; thus, the A549 cell was selected for subsequent experiments. Furthermore, we observed in our results that the expression of miR-373 was related to the prognosis of patients with NSCLC, which is consistent with the findings presented in previous studies. For instance, Jing et al. [27] discovered that the low expression of miR-373 indicated a poorer prognosis in patients with glioma and breast cancer [28], suggesting that miR-373 may be a potential predictive factor for survival in NSCLC.
To the best of our knowledge, BRF2, encoded by a gene located on chromosome 8p12, is a component of TFIIIB required for gene external RNA Pol III transcription, which is responsible for miRNA production and contributes to the regulation of the biosynthetic capacity of a cell [12]. Deregulation of RNA Pol III transcription could result in the aberrant production of key RNAs and consequently lead to uncontrollable cell growth uncontrollably, which is directly related to cancer cell proliferation [15]. Recently, BRF2 has been shown to be substantially overexpressed and play the an oncogenic role in a variety of cancer, including breast and melanoma cancers, as well as NSCLC, since the overexpression of BRF2 can drive the aberrant expression of RNA Pol III transcripts [17,29]. Coincidentally, in our study, BRF2 was significantly increased in NSCLC tissues and cell lines and was strongly associated with NSCLC clinicopathological features, which was in agreement with a previous study showed that BRF2 overexpression markedly predicted decreased 5-year OS and a higher risk of recurrence of NSCLC due to its the promotion of tumor angiogenesis.
As evidenced in the literature, miRNAs have been reported to exert function by binding to the mRNA 3′-UTR of a target gene to block its expression and thus participating in the regulation of various cellular processes, such as cell proliferation, migration, and invasion [8]. In this study, miR-373 was identified to directly target BRF2, resulting in the enhanced migration and invasion of NSCLC A549 cells and indicating that both miR-373 and its target gene BRF2 affects the metastasis of NSCLC. Accumulating studies have demonstrated that EMT is crucial for the migration and invasion of tumors [30], and is characterized by reduced expression of the epithelial marker E-cadherin and increased expression of the mesenchymal marker N-cadherin [31]. Seol et al. [9] revealed that transfection with miR-373 attenuated EMT by decreasing N-cadherin expression and up-regulating E-cadherin expression in NSCLC by targeting the downstream IRAK2 and LAMP1 genes. Of note, the transcription factor Snail is widely accepted as a prominent inducer of EMT by enhancing the invasion capacity of cells and greatly repressing the expression level of the E-cadherin protein, which was thought to be a metastatic suppressor associated with the malignant characteristics of tumor progression [32]. Here, in our study, transfection with the miR-373 mimics in NSCLC A549 cells was able to induce E-cadherin expression and reduce Snail and N-cadherin expression levels, while the miR-373 inhibitor attenuated E-cadherin expression and increased Snail and N-cadherin expression levels; moreover, the reduction in BRF2 expression inhibited migration and invasion and inhibited EMT of NSCLC A549 cells [33], which provide the evidence that by targeting BRF2, miR-373 may contribute to reducing cell EMT possibly through the up-regulation of Snail, resulting in the aberrant expression of E-cad-herin and N-cadherin.
However, the potential effects of miR-373 in vivo are unknown, and thus, animal models for investigating the roles of miR-373 in NSCLC development and the correlations between EMT marker molecules and BRF2-related signaling that are considered well-established will be helpful in evaluating the role of miR-373 in tumorigenesis in future studies.
Taken together, our data support the assumption that miR-373 may function as a tumor suppressor in NSCLC by attenuating the expression of BRF2 to inhibit EMT and the proliferation, migration and invasion of NSCLC cells; these findings may better our understanding of the molecular mechanisms of NSCLC and provide new targets for NSCLC therapy.
Acknowledgments
This study was funded by the award number LC2009C21 from the Scientific Research Foundation for Returned Overseas Chinese Scholars of the Education Office of Heilongjiang Province.
Footnotes
Conflict of interest relevant to this article was not reported.
References
- 1.Wang F, Meng F, Wang L, Wong SC, Cho WC, Chan LW. Associations of mRNA:microRNA for the shared downstream molecules of EGFR and alternative tyrosine kinase receptors in non-small cell lung cancer. Front Genet. 2016;7:173. doi: 10.3389/fgene.2016.00173. [DOI] [PMC free article] [PubMed] [Google Scholar]
- 2.Mahdavifar N, Ghoncheh M, Pakzad R, Momenimovahed Z, Salehiniya H. Epidemiology, incidence and mortality of bladder cancer and their relationship with the development index in the world. Asian Pac J Cancer Prev. 2016;17:381–6. doi: 10.7314/apjcp.2016.17.1.381. [DOI] [PubMed] [Google Scholar]
- 3.Souza MC, Cruz OG, Vasconcelos AG. Factors associated with disease-specific survival of patients with non-small cell lung cancer. J Bras Pneumol. 2016;42:317–25. doi: 10.1590/S1806-37562015000000069. [DOI] [PMC free article] [PubMed] [Google Scholar]
- 4.Bao W, Greenwold MJ, Sawyer RH. Expressed miRNAs target feather related mRNAs involved in cell signaling, cell adhesion and structure during chicken epidermal development. Gene. 2016;591:393–402. doi: 10.1016/j.gene.2016.06.027. [DOI] [PMC free article] [PubMed] [Google Scholar]
- 5.Peterson SM, Thompson JA, Ufkin ML, Sathyanarayana P, Liaw L, Congdon CB. Common features of microRNA target prediction tools. Front Genet. 2014;5:23. doi: 10.3389/fgene.2014.00023. [DOI] [PMC free article] [PubMed] [Google Scholar]
- 6.Shenoy A, Blelloch RH. Regulation of microRNA function in somatic stem cell proliferation and differentiation. Nat Rev Mol Cell Biol. 2014;15:565–76. doi: 10.1038/nrm3854. [DOI] [PMC free article] [PubMed] [Google Scholar]
- 7.Li S, Ma Y, Hou X, Liu Y, Li K, Xu S, et al. MiR-185 acts as a tumor suppressor by targeting AKT1 in non-small cell lung cancer cells. Int J Clin Exp Pathol. 2015;8:11854–62. [PMC free article] [PubMed] [Google Scholar]
- 8.Ma N, Zhang W, Qiao C, Luo H, Zhang X, Liu D, et al. The tumor suppressive role of miRNA-509-5p by targeting FOXM1 in non-small cell lung cancer. Cell Physiol Biochem. 2016;38:1435–46. doi: 10.1159/000443086. [DOI] [PubMed] [Google Scholar]
- 9.Seol HS, Akiyama Y, Shimada S, Lee HJ, Kim TI, Chun SM, et al. Epigenetic silencing of microRNA-373 to epithelial-mesenchymal transition in non-small cell lung cancer through IRAK2 and LAMP1 axes. Cancer Lett. 2014;353:232–41. doi: 10.1016/j.canlet.2014.07.019. [DOI] [PMC free article] [PubMed] [Google Scholar]
- 10.Yan GR, Xu SH, Tan ZL, Liu L, He QY. Global identification of miR-373-regulated genes in breast cancer by quantitative proteomics. Proteomics. 2011;11:912–20. doi: 10.1002/pmic.201000539. [DOI] [PubMed] [Google Scholar]
- 11.Koo CX, Kobiyama K, Shen YJ, LeBert N, Ahmad S, Khatoo M, et al. RNA polymerase III regulates cytosolic RNA:DNA hybrids and intracellular microRNA expression. J Biol Chem. 2015;290:7463–73. doi: 10.1074/jbc.M115.636365. [DOI] [PMC free article] [PubMed] [Google Scholar]
- 12.Gouge J, Satia K, Guthertz N, Widya M, Thompson AJ, Cousin P, et al. Redox signaling by the RNA polymerase III TFIIBrelated factor Brf2. Cell. 2015;163:1375–87. doi: 10.1016/j.cell.2015.11.005. [DOI] [PMC free article] [PubMed] [Google Scholar]
- 13.Saxena A, Ma B, Schramm L, Hernandez N. Structure-function analysis of the human TFIIB-related factor II protein reveals an essential role for the C-terminal domain in RNA polymerase III transcription. Mol Cell Biol. 2005;25:9406–18. doi: 10.1128/MCB.25.21.9406-9418.2005. [DOI] [PMC free article] [PubMed] [Google Scholar]
- 14.Lu M, Tian H, Yue W, Li L, Li S, Qi L, et al. Overexpression of TFIIB-related factor 2 is significantly correlated with tumor angiogenesis and poor survival in patients with esophageal squamous cell cancer. Med Oncol. 2013;30:553. doi: 10.1007/s12032-013-0553-4. [DOI] [PubMed] [Google Scholar]
- 15.Cabarcas S, Schramm L. RNA polymerase III transcription in cancer: the BRF2 connection. Mol Cancer. 2011;10:47. doi: 10.1186/1476-4598-10-47. [DOI] [PMC free article] [PubMed] [Google Scholar]
- 16.Lu M, Tian H, Yue W, Li L, Li S, Qi L, et al. TFIIB-related factor 2 over expression is a prognosis marker for early-stage nonsmall cell lung cancer correlated with tumor angiogenesis. PLoS One. 2014;9:e88032. doi: 10.1371/journal.pone.0088032. [DOI] [PMC free article] [PubMed] [Google Scholar]
- 17.Lockwood WW, Chari R, Coe BP, Thu KL, Garnis C, Malloff CA, et al. Integrative genomic analyses identify BRF2 as a novel lineage-specific oncogene in lung squamous cell carcinoma. PLoS Med. 2010;7:e1000315. doi: 10.1371/journal.pmed.1000315. [DOI] [PMC free article] [PubMed] [Google Scholar]
- 18.Wrona A, Jassem J. The new TNM classification in lung cancer. Pneumonol Alergol Pol. 2010;78:407–17. [PubMed] [Google Scholar]
- 19.Gallagher MF, Heffron CC, Laios A, O'Toole SA, Ffrench B, Smyth PC, et al. Suppression of cancer stemness p21-regulating mRNA and microRNA signatures in recurrent ovarian cancer patient samples. J Ovarian Res. 2012;5:2. doi: 10.1186/1757-2215-5-2. [DOI] [PMC free article] [PubMed] [Google Scholar]
- 20.Wang S, Ma G, Zhu H, Lv C, Chu H, Tong N, et al. miR-107 regulates tumor progression by targeting NF1 in gastric cancer. Sci Rep. 2016;6:36531. doi: 10.1038/srep36531. [DOI] [PMC free article] [PubMed] [Google Scholar]
- 21.Eyking A, Reis H, Frank M, Gerken G, Schmid KW, Cario E. MiR-205 and miR-373 are associated with aggressive human mucinous colorectal cancer. PLoS One. 2016;11:e0156871. doi: 10.1371/journal.pone.0156871. [DOI] [PMC free article] [PubMed] [Google Scholar]
- 22.Zhang Y, Zhao FJ, Chen LL, Wang LQ, Nephew KP, Wu YL, et al. MiR-373 targeting of the Rab22a oncogene suppresses tumor invasion and metastasis in ovarian cancer. Oncotarget. 2014;5:12291–303. doi: 10.18632/oncotarget.2577. [DOI] [PMC free article] [PubMed] [Google Scholar]
- 23.Tanaka T, Arai M, Wu S, Kanda T, Miyauchi H, Imazeki F, et al. Epigenetic silencing of microRNA-373 plays an important role in regulating cell proliferation in colon cancer. Oncol Rep. 2011;26:1329–35. doi: 10.3892/or.2011.1401. [DOI] [PubMed] [Google Scholar]
- 24.Chen Y, Luo J, Tian R, Sun H, Zou S. miR-373 negatively regulates methyl-CpG-binding domain protein 2 (MBD2) in hilar cholangiocarcinoma. Dig Dis Sci. 2011;56:1693–701. doi: 10.1007/s10620-010-1481-1. [DOI] [PubMed] [Google Scholar]
- 25.Voorhoeve PM, le Sage C, Schrier M, Gillis AJ, Stoop H, Nagel R, et al. A genetic screen implicates miRNA-372 and miRNA-373 as oncogenes in testicular germ cell tumors. Adv Exp Med Biol. 2007;604:17–46. doi: 10.1007/978-0-387-69116-9_2. [DOI] [PubMed] [Google Scholar]
- 26.Wang Z, Wu YL, Zhang GC, Zhou Q, Xu CR, Guo AL. EGFR/KRAS mutations and gefitinib therapy in Chinese NSCLC patients. Onkologie. 2008;31:174–8. doi: 10.1159/000116736. [DOI] [PubMed] [Google Scholar]
- 27.Jing SY, Jing SQ, Liu LL, Xu LF, Zhang F, Gao JL. Downexpression of miR-373 predicts poor prognosis of glioma and could be a potential therapeutic target. Eur Rev Med Pharmacol Sci. 2017;21:2421–5. [PubMed] [Google Scholar]
- 28.Eichelser C, Flesch-Janys D, Chang-Claude J, Pantel K, Schwarzenbach H. Deregulated serum concentrations of circulating cell-free microRNAs miR-17, miR-34a, miR-155, and miR-373 in human breast cancer development and progression. Clin Chem. 2013;59:1489–96. doi: 10.1373/clinchem.2013.205161. [DOI] [PubMed] [Google Scholar]
- 29.Koo J, Cabarcas-Petroski S, Petrie JL, Diette N, White RJ, Schramm L. Induction of proto-oncogene BRF2 in breast cancer cells by the dietary soybean isoflavone daidzein. BMC Cancer. 2015;15:905. doi: 10.1186/s12885-015-1914-5. [DOI] [PMC free article] [PubMed] [Google Scholar]
- 30.Papiewska-Pajak I, Kowalska MA, Boncela J. Expression and activity of SNAIL transcription factor during epithelial to mesenchymal transition (EMT) in cancer progression. Postepy Hig Med Dosw (Online) 2016;70:968–80. doi: 10.5604/17322693.1219401. [DOI] [PubMed] [Google Scholar]
- 31.Gravdal K, Halvorsen OJ, Haukaas SA, Akslen LA. A switch from E-cadherin to N-cadherin expression indicates epithelial to mesenchymal transition and is of strong and independent importance for the progress of prostate cancer. Clin Cancer Res. 2007;13:7003–11. doi: 10.1158/1078-0432.CCR-07-1263. [DOI] [PubMed] [Google Scholar]
- 32.Wang Y, Shi J, Chai K, Ying X, Zhou BP. The role of Snail in EMT and tumorigenesis. Curr Cancer Drug Targets. 2013;13:963–72. doi: 10.2174/15680096113136660102. [DOI] [PMC free article] [PubMed] [Google Scholar]
- 33.Tian Y, Lu M, Yue W, Li L, Li S, Gao C, et al. TFIIB-related factor 2 is associated with poor prognosis of nonsmall cell lung cancer patients through promoting tumor epithelial-mesenchymal transition. Biomed Res Int. 2014;2014:530786. doi: 10.1155/2014/530786. [DOI] [PMC free article] [PubMed] [Google Scholar]


