

Abstract
Spouses influence each other’s psychological functioning and quality of life. To explore whether this interdependence continues after a person becomes widowed, we tested whether deceased spouses’ characteristics were associated with their widowed partners’ later quality of life using couples drawn from a multinational sample of aging adults. Independent subsamples (ns = 221 and 325) were assessed before and after a spouse’s death. Regressions revealed that deceased partners’ quality of life prior to their death positively predicted their spouses’ quality of life after the partners’ death, even when we controlled for spouses’ prior quality of life to account for environmental factors shared within couples. Further, widowed participants’ quality of life was lower than nonwidowed couples’ 2 years before and after their partners’ death, but was equivalent 4 years prior. Finally, the strength of the association between partners’ earlier quality of life and participants’ later quality of life did not differ between widowed and nonwidowed participants. These findings suggest that interdependence in quality of life continues after one’s partner has passed away.
Keywords: quality of life, widowhood, interdependence, continuing bonds, attachment
Death ends a life, but it does not end a relationship, which struggles on in the survivor’s mind toward some resolution.
—Robert Anderson (1968, p. 5)
A key tenet of both attachment and interdependence theories is that adults’ psychological and physiological functioning affects (and is affected by) their partners’ psychology and physiology (Lewis et al., 2006; Rholes & Simpson, 2004; Sbarra & Hazan, 2008). Older adults’ quality of life, for example, is dependent not only on their own psychological functioning and physical health, but also on that of their spouse (Bourassa, Memel, Woolverton, & Sbarra, 2015a; Walker, Luszcz, Gerstorf, & Hoppmann, 2011). One interesting but unexplored question is whether interdependence continues once one of the partners in a marriage passes away. Bereavement involves a reorganization of internal working models of attachment to accommodate the loss (Shear & Shair, 2005). This reorganization could involve the deceased partner, who may serve as a source of symbolic support after his or her death (Mikulincer & Shaver, 2008). The characteristics of deceased spouses could affect the reorganization of attachment during the grieving process, affecting surviving spouses’ well-being as a result. Critically, do characteristics of the deceased prior to their death continue to influence their spouses after their death?
Quality of Life and Widowhood
Bereavement is associated with a variety of poor psychological and health outcomes, including increased risk for early death (Moon, Kondo, Glymour, & Subramanian, 2011), increased systemic inflammation and hypothalamic-pituitary-adrenal dysregulation (O’Connor, Wellisch, Stanton, Olmstead, & Irwin, 2012; Schultze-Florey et al., 2012), depression (Sasson & Umberson, 2014), and decreased quality of life (Grimby, 1993). These negative effects, however, can precede the death of a partner. Vable, Subramanian, Rist, and Glymour (2015) found that people near widowhood had higher levels of depression and less mobility than those who did not become widowed, even when they accounted for widows and widowers’ demographics and physical health.
Examining the impact of stressful events, such as the loss of a spouse, on quality of life is an important public-health concern. Higher quality of life corresponds with better health (Steptoe, Demakakos, De Oliveira, & Wardle, 2012), better sleep (Steptoe, O’Donnell, Marmot, & Wardle, 2008), and lower mortality (Netuveli, Pikhart, Bobak, & Blane, 2012; Steptoe & Wardle, 2012). Quality of life is a particularly important outcome for widows and widowers, as they have faced a profound stressor and have often lost a significant source of coping and support. There are well-established dyadic effects in couples’ quality of life over time (Bookwala & Schulz, 1996; Bourassa et al., 2015a; Walker et al., 2011). Positive emotions—one aspect of quality of life—are linked to lower distress in bereavement (Shear & Shair, 2005), which makes quality of life a promising construct for exploring whether characteristics of deceased partners affect surviving spouses after the partners’ death.
One way surviving spouses can reorganize their attachment to a lost partner is through continuing bonds with their partner and updating cognitive representations of their partner’s characteristics (Field, 2006; Klass, Silverman, & Nickman, 1996). Continuing bonds can be adaptive, such as when surviving spouses recreate a secure psychological attachment to their partner’s memory, or can be maladaptive, such as when the bereaved cannot find meaning in the loss (Field, Gao, & Paderna, 2005). The psychological characteristics of the deceased, such as their quality of life, may affect whether ongoing attachment might act as a psychological resource for surviving spouses to call on. For example, the positive affect a deceased partner formerly displayed in stressful situations might serve as a source of symbolic support for the surviving spouse.
Finally, if interdependence in quality of life persists despite the loss of a partner, questions remain as to how this effect might compare with interdependence among people who do not lose their spouse (Vable et al., 2015). Do near-widowhood effects extend to quality of life? Are the dyadic effects observed among the bereaved as strong as the established concordance in quality of life among couples in which both partners are still alive?
The Present Study
We used data from the multinational, representative Study of Health, Ageing and Retirement in Europe (SHARE) to explore dyadic effects of quality of life among married couples as a predictor of later quality of life after one of the partners is widowed. Three primary hypotheses guided this investigation. First, among married couples in which one person subsequently died, we expected both partners’ predeath quality of life would predict the spouse’s quality of life after the partner’s death (Hypothesis 1). Second, we expected that the near-widowhood effect (Vable et al., 2015) would be conceptually replicated in our widowed sample, such that the quality of life of widowed participants before their spouse’s death would be lower than the quality of life of nonwidowed participants (Hypothesis 2). Finally, we expected the association of partners’ predeath quality of life and the surviving spouses’ later quality of life would be weaker among widowed couples, compared with nonwidowed couples whose quality of life was measured at the same two time points (Hypothesis 3).
Method
Participants
The SHARE data set that we used for this study currently contains data from four waves: three panel waves (2004, 2006, and 2010) and one dealing with retrospective life histories (2008; Börsch-Supan et al., 2013). Participants were selected from 18 European Union countries (Austria, Belgium, Czech Republic, Denmark, Estonia, France, Germany, Greece, Hungary, Ireland, Italy, The Netherlands, Poland, Portugal, Sweden, Slovenia, Spain, Switzerland) and Israel, with 152,871 completed interviews and 86,290 unique participants primarily 50 years of age or older. Participants from earlier waves were contacted for participation in subsequent waves, and the average retention rate of the study for the first four waves was 81%. For participants who passed away, a proxy respondent completed an end-of-life questionnaire regarding their death and retrospective measures of their health-care use.
From the original SHARE sample of 86,290 people, we excluded 53,985 because they participated in only a single wave of data collection. Of those excluded, 70.43% were newly recruited into the study and assessed only at Time 4. Of the remaining 29,555 participants who had data from two waves, 20,449 completed assessments at Wave 1 and Wave 2, whereas 18,289 completed assessments at Wave 2 and Wave 4. Of the 20,449 participants who completed Waves 1 and 2, 10,830 had complete married-partner data, which equated to 5,415 couples. Of these married couples, 221 experienced the death of their spouse between Waves 1 and 2 (the Waves 1-2 subsample). Of the 18,289 participants who completed assessments at Wave 2 and Wave 4, 9,936 had complete married-partner data, which equated to 4,968 couples. Of these married couples, 325 experienced the death of their spouse between Waves 2 and 4 (the Waves 2-4 subsample). Both subsamples of couples completed initial (Time 1) assessments, after which one member of the couple passed away before the next assessment. The surviving member of the dyad then completed a second assessment (Time 2; i.e., after the spouse’s death). The widowed participants thus consisted of 546 couples, drawn from the two subsamples, in which one partner died between Time 1 and Time 2. The selection and exclusion criteria ensured that the two widowed subsamples were independent.
Finally, to compare the widowed subsample with couples in which both members of the dyad remained alive, we selected 10,697 participants who had completed the Wave 1, Wave 2, and Wave 4 assessments. Of these 10,697 participants, 5,132 had complete data across the assessments, which resulted in a final sample of 2,566 married couples, with participants designated randomly as the partner or the surviving participant. Table 1 displays the descriptive statistics for all participants.
Table 1.
Descriptive Statistics for Widowed and Nonwidowed Participants
| Variable | Widowed (n = 546) |
Nonwidowed (n = 2,566) |
|---|---|---|
| Time 0 quality of life (12–48) | 37.41 (6.21) | 38.05 (5.70) |
| Time 1 quality of life (12–48) | 35.53 (6.83) | 38.40 (5.78) |
| Time 2 quality of life (12–48) | 35.09 (6.96) | 38.36 (5.93) |
| Partner Time 1 quality of life (12–48) | 35.18 (6.49) | 38.52 (5.72) |
| Depression (1–12) | 2.81 (2.48) | 2.01 (2.01) |
| Age (years) | 70.02 (9.51) | 61.90 (8.47) |
| Partner age (years) | 72.08 (9.44) | 61.90 (8.54) |
| Income percentile (rescaled: 1–10) | 5.26 (2.49) | 6.17 (2.62) |
| Years of education | 9.20 (4.17) | 10.89 (4.41) |
| Years married | 44.62 (11.58) | 36.00 (11.01) |
| Gender (% women) | 68.68 | 50.00 |
| Partner health (1–5) | 3.78 (1.05) | — |
| Time prior to death | 2.45 (1.89) | — |
| Time after death | 1.27 (0.83) | — |
| Length of time partner was ill prior to death (1–4) | 2.82 (1.27) | — |
| Hours of help needed daily (0–24) | 12.53 (9.02) | — |
| Time 2 social engagement (0–3) | 0.87 (1.43) | — |
Note: Except as noted, the table shows mean values. Standard deviations are given in parentheses. For widowed couples, “partner” refers to the deceased partner; for nonwidowed couples, one member was randomly designated as the participant and one as the partner. All variables were assessed at Time 1, unless otherwise indicated. Time prior to death is the length of time between the Time 1 assessment and the partner’s death, whereas time after the partner’s death is the time between death and the participant’s Time 2 assessment.
Measures
Demographic variables
SHARE assessed a variety of demographic variables, including both partners’ age, gender, and years of education; years the couple was married; and household income percentile. Years of marriage and household income percentile were equal within couples.
End-of-life variables
When members of SHARE passed away, a proxy respondent was contacted to conduct an end-of-life assessment. In the current study, we used several proxy responses, including the hours of help needed in daily activities per day (0 to 24), the length of time the participant was ill before death (coded from 1, less than 1 month, to 4, 1 year or more), and the month and year of participants’ death. Two variables measured the time between (a) the widowed partners’ Time 1 interview date and the spouse’s death and (b) the spouse’s death and the widowed partners’ Time 2 interview date. Both variables were calculated using the month and years of death to account for the fact that surviving spouses were widowed for different lengths of time between assessments.
Quality of life
Quality of life was measured at each time point using 12 items of the CASP-19 (Hyde, Wiggins, Higgs, & Blane, 2003), a scale developed specifically for use in assessing quality of life, life satisfaction, and well-being in aging populations, which shows concurrent validity with similar measures. The scale assesses the domains of control, autonomy, self-realization, and pleasure (hence the initials CASP) with four to five Likert-scale items in each of the four domains, for a total of 19 items (e.g., “I look forward to each day”). The CASP-19 shows predictive power based on contextual factors that impact well-being, such as health and marital problems (Blane, Higgs, Hyde, & Wiggins, 2004), and has shown adequate internal reliability. All four subdomains load on a single latent factor of quality of life (Wiggins, Higgs, Hyde, & Blane, 2004). The SHARE data set uses a subset of 12 of these items that show more robust statistical-measurement properties, as determined through exploratory and confirmatory factor analyses (Wiggins, Netuveli, Hyde, Higgs, & Blane, 2008). Response choices were coded from 1 to 4 and resulted in a final shorted scale with a range from 12 to 48, with higher scores representing higher quality of life. The subscale showed adequate internal consistency across the entire sample at both Time 1 (α = .75) and Time 2 (α = .77).
Physical health
Deceased partners’ physical health prior to their passing was measured at Time 1 using a 5-point Likert-scale item that asked how they would rate their health on a scale from excellent to very poor. Participants were randomly assigned to receive the question either at the beginning or end of the broader physical-health questionnaire to account for response biasing. Scores were coded such that higher scores denoted lower self-perceived physical health. In general, self-perceived health is considered a valid measure of physical health among aged adults and is predictive of future health problems and mortality (Idler & Benyamini, 1997).
Depressive symptoms
Depressive symptoms were measured using the EURO-D, a self-report measure originally designed to assess the presence of depressive symptoms in participants from the European Union (Castro-Costa et al., 2007; Prince et al., 1999). The scale uses 12 binary yes/no items (e.g., “Have you been sad recently?” and “Have you cried recently?”). The scale has an established clinical cutoff (≥ 4) and had acceptable internal reliability in the current sample (α = .69). We accounted for depressive symptoms in the current study because depression is linked to quality-of-life outcomes in medical populations, such as people with diabetes (Goldney, Philips, Fisher, & Wilson, 2004) and cancer (Visser & Smets, 1998).
Social engagement
Social engagement was measured using a sum score of participants’ self-reported participation across four domains of social activities over the month previous to the assessment. The categories were how often they had participated in (a) voluntary or charity work, (b) sports or a social or other kind of club, (c) activities of a religious organization, and (d) activities involving a political or community organization. Scores in each domain ranged from 0, no participation, to 3, participation every week or more. Scores at Wave 4 consisted of participants’ self-reported social participation over the previous year, rather than the previous month, and were recoded to match the monthly frequencies used in Wave 1 and Wave 2, as discussed in further detail in Bourassa, Memel, Woolverton, and Sbarra (2015b).
Data analysis
The four waves of SHARE assessments allowed for two independent subsamples: (a) couples married at Wave 1 with one partner passing away between Waves 1 and 2 (Waves 1-2 subsample), and (b) couples married at Wave 2 with one partner passing away between Waves 2 and 4 (Waves 2-4 subsample). In addition, the nonwidowed subsample consisted of participants who did not lose their partner from Wave 1 to Wave 4. It is important to note that the overall time between the assessments in the two widowed samples was 2 years and 4 years, respectively. Membership in either the Wave 1 or Wave 2 sample was statistically controlled for in all analyses.
We evaluated our first hypothesis by testing whether deceased partners’ Time 1 quality of life predicted surviving spouses’ Time 2 quality of life. We first conducted analyses using only the hypothesized variables of interest (deceased partner quality of life at Time 1 as a predictor of surviving spouse’s quality of life at Time 2, controlling for the surviving spouse’s quality of life at Time 1) and subsample membership. We then integrated a number of possible covariates as alternative predictors: surviving spouses’ Time 1 age, gender, education, and depressive symptoms; years of marriage; partners’ age and self-rated health; daily hours devoted to partner care prior to death; time the partner was ill prior to death; length of time since the surviving spouse was assessed prior to the partner’s death; and length of time the surviving spouse was assessed after the partner’s death, as well as Time 2 social engagement. In addition, we examined whether membership in a specific subsample was predictive by testing either for moderation by sample membership and quality of life or for a main effect of subsample membership, as appropriate. If the effect of subsample membership was nonsignificant and small in size, this provided evidence that any results in the combined sample replicated across both independent subsamples.
For the second hypothesis, we used regression to examine the mean difference between widowed and nonwidowed participants’ Time 1 and Time 2 quality of life to determine whether the groups differed on their absolute quality of life. Time 1 age, gender, education, income, depressive symptoms, and partner age were included as potential alternative predictors. In addition, we used Wave 1 quality-of-life scores (Time 0) for participants in the Waves 2-4 subsample to test whether differences existed approximately 2 years prior to Wave 2. Because of the timing of the assessments, this was not possible with the Waves 1-2 subsample.
For the third hypothesis, we evaluated whether there were differences between widowed and nonwidowed samples in the strength of the association between Time 1 quality of life and Time 2 quality of life. We conducted a regression analysis using the hypothesized variables of interest (participant and partner quality of life as a predictor of later quality of life) and widowed status (widowed or not widowed) as a moderator of the relationship between partner quality of life and later participant quality of life. We added Time 1 age, gender, education, income, depressive symptoms, and partner age as covariates.
For all regressions, values were standardized to represent the change in the dependent variables, in standard-deviation units, predicted by a 1 standard-deviation change in the independent variables. The values were calculated using the formula β = b × SD(x)/SD(y) for continuous predictors, and β = b/SD(y) for dichotomous predictors, which is described in further detail in Muthén and Muthén (2012). All models were run in Mplus (Version 7.2; Muthén & Muthén, 2012) using simultaneous regression and full-information maximum-likelihood (FIML) estimation for missing data. FIML is a missing-data technique that produces result similar to those yielded by multiple imputation (Graham, 2009). FIML produces less biased estimates compared with listwise and pairwise deletion, similar response-pattern imputation in Monte Carlo simulations, and unbiased estimates when data is missing completely at random or missing at random (Enders & Bandalos, 2001).1
Results
Table 1 displays descriptive statistics for the participants in the current study for all variables as estimated using FIML. Tables 2 and 3 provide correlations for all variables included in the study, for widowed and nonwidowed participants, respectively. Initial (Time 1) quality of life was correlated among couples in both the widowed (r = .61) and nonwidowed subsamples (r = .56). Note that throughout the Results section, for widowed couples, “partner” refers to the deceased partner, and “participant” refers to the surviving spouse; for nonwidowed couples, one member was randomly designated as the participant and one as the partner.
Table 2.
Correlations Between Variables in the Widowed Subsample
| Variable | 1 | 2 | 3 | 4 | 5 | 6 | 7 | 8 | 9 | 10 | 11 | 12 | 13 | 14 | 15 | 16 |
|---|---|---|---|---|---|---|---|---|---|---|---|---|---|---|---|---|
| 1. Time 2 quality of life | — | |||||||||||||||
| 2. Time 1 quality of life | .61 | — | ||||||||||||||
| 3. Partner quality of life | .46 | .60 | — | |||||||||||||
| 4. Partner health | −.17 | −.27 | −.50 | — | ||||||||||||
| 5. Gender | −.03 | −.07 | −.11 | −.04 | — | |||||||||||
| 6. Age | −.20 | −.06 | −.09 | .12 | −.19 | — | ||||||||||
| 7. Time after death | .08 | −.07 | −.09 | .10 | −.00 | −.03 | — | |||||||||
| 8. Time prior to death | −.09 | .03 | .13 | −.06 | −.03 | −.02 | −.60 | — | ||||||||
| 9. Years married | −.14 | −.07 | −.09 | .08 | −.03 | .72 | .01 | −.02 | — | |||||||
| 10. Length of partner illness | .05 | −.10 | −.09 | .20 | −.06 | −.05 | .08 | −.09 | −.06 | — | ||||||
| 11. Help needed | −.11 | .04 | .05 | −.06 | .06 | −.08 | .02 | .03 | −.05 | −.04 | — | |||||
| 12. Partner age | −.22 | −.13 | −.18 | .12 | .12 | .82 | −.01 | −.03 | .67 | −.08 | −.05 | — | ||||
| 13. Education | .42 | .38 | .30 | −.13 | −.14 | −.20 | .03 | −.01 | −.22 | .05 | −.01 | −.25 | — | |||
| 14. Income percentile | .20 | .11 | .13 | −.04 | .04 | −.19 | .01 | .04 | −.17 | .06 | .08 | −.18 | .33 | — | ||
| 15. Depression | −.42 | −.62 | −.37 | .24 | .12 | .09 | .09 | −.03 | .11 | .13 | −.02 | .14 | −.25 | −.02 | — | |
| 16. Social engagement | .10 | .04 | .05 | −.02 | .08 | −.09 | −.01 | −.01 | .03 | −.10 | .02 | .05 | −.06 | .09 | .14 | — |
| 17. Subsample | −.01 | .07 | .17 | −.04 | −.07 | −.01 | −.06 | .72 | −.02 | −.12 | −.04 | −.05 | .03 | −.01 | −.08 | −.06 |
Note: All variables measured participants’ characteristics unless otherwise noted. See Table 1 for more information about the variables.
Table 3.
Correlations Between Variables in the Nonwidowed Subsample
| Variable | 1 | 2 | 3 | 4 | 5 | 6 | 7 | 8 | 9 |
|---|---|---|---|---|---|---|---|---|---|
| 1. Time 2 quality of life | — | ||||||||
| 2. Time 1 quality of life | .64 | — | |||||||
| 3. Partner quality of life | .45 | .56 | — | ||||||
| 4. Depression | −.37 | −.38 | −.27 | — | |||||
| 5. Age | −.16 | −.12 | −.09 | .02 | — | ||||
| 6. Partner age | −.15 | −.11 | −.08 | .08 | .83 | — | |||
| 7. Income percentile | .18 | .18 | .20 | −.09 | −.31 | −.32 | — | ||
| 8. Education | .25 | .27 | .25 | −.16 | −.19 | −.22 | .35 | — | |
| 9. Gender | −.02 | −.01 | .04 | .21 | −.16 | .18 | −.02 | −.08 | — |
| 10. Years married | −.14 | −.13 | −.08 | .08 | .71 | .72 | .31 | −.25 | .03 |
Note: All variables measured participants’ characteristics unless otherwise noted. See Table 1 for more information about the variables.
Hypothesis 1
Main results
To test Hypothesis 1, we first examined the association between deceased partners’ Time 1 quality of life and surviving spouses’ Time 2 quality of life for widowed participants (Model 1; n = 546). We controlled for the surviving spouses’ Time 1 quality of life and accounted for subsample membership. In Model 1, widowed participants’ Time 1 quality of life predicted their Time 2 quality of life, β = 0.51, 95% confidence interval (CI) = [0.42, 0.60], p < .001. Deceased partners’ quality of life also predicted widowed participants’ later quality of life, β = 0.16, 95% CI = [0.05, 0.26], p = .003. Both partners’ and surviving spouses’ quality of life prior to the partners’ death was included to account for a variety of plausible environmental factors shared among couples (e.g., geography, housing, family support). As a result, the association of the two partners’ quality of life before the partner’s death and widowed participant’s quality of life after the partner’s death is independent of these possible alternative predictors of quality of life.
To further test these associations, we then included a number of relevant covariates as additional alternative predictors for the associations observed in Model 1. The augmented model (Model 2) again evidenced a significant association between widowed participants’ Time 1 and Time 2 quality of life, β = 0.44, 95% CI = [0.33, 0.55], p < .001, as well as the deceased partners’ Time 1 quality of life and widowed participants’ Time 2 quality of life, β = 0.17, 95% CI = [0.07, 0.28], p = .002. Notably, the association of interest remained comparable with Model 1 results after the covariates were added. In addition, we investigated the interaction of subsample membership and partner quality of life as a predictor of participants’ Time 2 quality of life to explore the similarity in the association between the independent subsamples. The effect size of the interaction was small in both models (Model 1: β = −0.01; Model 2: β = −0.00), which suggests that the observed results were equivalent in both subsamples. We also ran the models independently within each subsample, and the association of deceased partners’ Time 1 quality of life and surviving spouses’ Time 2 quality of life was replicated independently in both subsamples (Waves 1-2: β = 0.18; Waves 2-4: β = 0.17). The full results of Models 1 and 2 are presented in Table 4, and the results of Model 2 are shown visually in Figure 1.
Table 4.
Results of the Models Predicting Participants’ Time 2 Quality of Life
| Model and predictor | β | 95% CI | b |
|---|---|---|---|
| Model 1 | |||
| Quality of life | 0.51** | [0.41, 0.61] | 0.51** |
| Partner quality of life | 0.16** | [0.06, 0.28] | 0.17** |
| Subsample | −0.07 | [−0.15, 0.01] | −1.01 |
| Subsample × Partner Quality of Life | −0.01 | [−0.09, 0.08] | −0.01 |
| Model 2 | |||
| Quality of life | 0.44** | [0.33, 0.55] | 0.45** |
| Partner quality of life | 0.17** | [0.07, 0.28] | 0.18** |
| Depression | −0.08 | [−0.17, 0.02] | −0.22 |
| Partner health | 0.06 | [−0.03, 0.14] | 0.37 |
| Age | −0.20* | [−0.36, –0.04] | −0.15* |
| Partner age | 0.03 | [−0.12, 0.17] | 0.02 |
| Income percentile | 0.07 | [−0.01, 0.14] | 0.18 |
| Education | 0.15** | [0.06, 0.23] | 0.25** |
| Years married | 0.07 | [−0.04, 0.18] | 0.04 |
| Time prior to death | −0.02 | [−0.21, 0.18] | −0.09 |
| Time after death | 0.08 | [−0.04, 0.23] | 0.83 |
| Length of partner’s illness | 0.08* | [0.01, 0.15] | 0.44* |
| Help needed | −0.15** | [−0.25, –0.05] | −0.12** |
| Gender | 0.02 | [−0.07, 0.10] | 0.24 |
| Time 2 social engagement | 0.04 | [−0.03, 0.11] | 0.19 |
| Subsample | −0.05 | [−0.20, 0.10] | −0.70 |
| Subsample × Partner Quality of Life | −0.00 | [−0.08, 0.08] | −0.00 |
Note: All predictors were assessed at Time 1 unless otherwise noted. Subsample membership was contrast-coded for whether widowed participants were in the Waves 1-2 or Waves 2-4 subsample. See Table 1 for more information about the variables. CI = confidence interval.
p < .05. **p < .01.
Fig. 1.
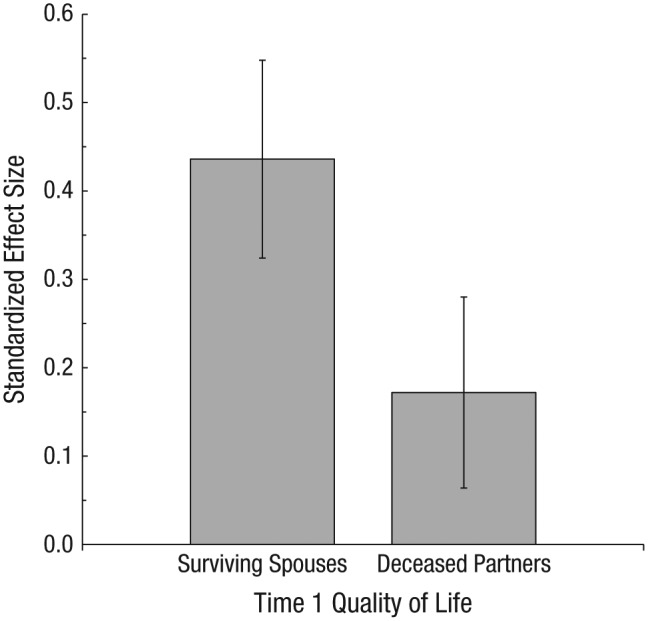
Standardized mean effect size from Model 2 for surviving spouses’ and partners’ Time 1 quality of life as a predictor of participants’ Time 2 quality of life for the widowed subsample. Values shown are from Model 2, which included surviving spouses’ Time 1 age, gender, education, and depressive symptoms; years of marriage; partners’ age and self-rated health; daily hours devoted to partner care prior to death; time the partner was ill prior to death; length of time since the surviving spouse was assessed prior to the partner’s death; and length of time the surviving spouse was assessed after the partner’s death, as well as Time 2 social engagement. Error bars represent 95% confidence intervals.
Accounting for differences in time prior to the partner’s death
Although including surviving spouses’ Time 1 quality of life as a predictor accounted for the effects of environmental factors shared among spouses, an additional concern was whether differences in the time between the Time 1 assessment and the death of partners may have affected the strength of the association between deceased partners’ quality of life and surviving spouses’ Time 2 quality of life. It is possible that additional shared time as a couple between the Time 1 assessment and the partner’s death could result in stronger interdependent effects. Therefore, we ran two analyses that included the interaction between partners’ quality of life and the time between the Time 1 assessment and the partners’ death to explore this possibility.
First, we entered this interaction in the original model for Hypothesis 1, which included the relevant covariates. One statistical issue we encountered, however, was multicollinearity between sample membership and time between the Time 1 assessment and the partners’ death (r = .72), due in large part to the lengths of time between Time 1 and Time 2 varying systematically between the two subsamples. In the previous analysis, the Subsample × Partner Quality of Life interaction was nonsignificant and small in size. Therefore, we ran our analysis including the Time to Death × Partner Quality of Life interaction without including the highly correlated Subsample × Partner Quality of Life interaction term. The Time to Death × Partner Quality of Life interaction was nonsignificant and small in size, β = −0.07, 95% CI = [−0.15, 0.01], p = .071, which suggests that the association of partners’ Time 1 quality of life and participants’ Time 2 quality of life did not differ based on the amount of time between the Time 1 assessment and the death.
Second, we also ran the regression model for Hypothesis 1 including only surviving spouses whose partner passed away within 1.5 years of the next assessment. In this subsample, the strength of the association between partner Time 1 quality of life and surviving spouse Time 2 quality of life was stronger than in the overall sample (β = 0.20) though nonsignificant because of the smaller sample size (n = 50). These two additional analyses provide evidence that differences in the amount of shared time between the initial assessment and death does not attenuate the association of partner’s Time 1 quality of life as a predictor of widowed participants’ Time 2 quality of life.
Hypothesis 2
To test Hypothesis 2, we examined differences in absolute quality of life between married participants who became widowed and nonwidowed participants using multiple regression with Time 1 age, gender, education, income, depressive symptoms, and partner age included as covariates.2 As predicted, widowed participants had significantly lower levels of both Time 1 quality of life, β = −0.23, 95% CI = [−0.33, −0.13], p < .001, and Time 2 quality of life, β = −0.24, 95% CI = [−0.34, −0.13], p < .001. The effect of subsample membership was small at both Time 1 and Time 2 (βs = 0.01 and −0.02, respectively), which suggests that the observed results were equivalent in both subsamples. In addition, we tested whether this difference in absolute quality-of-life level extended to the Wave 1 assessment in the Waves 2-4 subsample, for which there was an earlier assessment (Time 0) available. Two years prior to Time 1, widowed participants did not show significantly lower levels of quality of life compared with nonwidowed participants, β = −0.01, 95% CI = [−0.06, 0.05], p > .250. The results suggest that the differences in absolute quality of life between spouses who will become widowed in the future extend to Time 1 (mean time to partners’ death = 3.18 years), but not Time 0 (2 years earlier than the mean time to partners’ death). Full results are presented in Table 5 and illustrated in Figure 2.
Table 5.
Results of the Models Comparing Quality of Life Among Widowed and Nonwidowed Participants
| Sample and predictor | β | 95% CI | b |
|---|---|---|---|
| Outcome: Time 1 quality of life | |||
| Full sample | |||
| Widowed status | −0.24** | [−0.33, –0.13] | −1.39** |
| Depression | −0.41** | [−0.44, –0.38] | −1.17** |
| Age | −0.01 | [−0.08, 0.07] | −0.01 |
| Partner age | −0.01 | [−0.09, 0.06] | −0.01 |
| Income | 0.06** | [0.02, 0.09] | 0.13** |
| Education | 0.20** | [0.17, 0.24] | 0.28** |
| Years married | −0.01 | [−0.06, 0.05] | −0.00 |
| Gender | 0.07** | [0.03, 0.11] | 0.83** |
| Subsample | 0.01 | [−0.03, 0.05] | 0.14 |
|
| |||
| Outcome: Time 2 quality of life | |||
| Full sample | |||
| Widowed status | −0.24** | [−0.33, –0.14] | −1.44** |
| Depression | −0.35** | [−0.39, –0.32] | −1.02** |
| Age | −0.11** | [−0.19, –0.03] | −0.07** |
| Partner age | −0.03 | [−0.11, 0.05] | −0.02 |
| Income | 0.07** | [0.04, 0.11] | 0.13** |
| Education | 0.19** | [0.15, 0.22] | 0.26** |
| Years married | 0.06* | [0.01, 0.11] | 0.03* |
| Gender | 0.05* | [0.01, 0.09] | 0.62* |
| Subsample | −0.02 | [−0.06, 0.02] | −0.22 |
|
| |||
| Outcome: Time 0 quality of life | |||
| Waves 2-4 subsample | |||
| Widowed status | 0.01 | [−0.06, 0.05] | −0.09 |
| Depression | −0.42** | [−0.46, –0.39] | −1.20** |
| Age | 0.01 | [−0.08, 0.10] | 0.01 |
| Partner age | 0.04 | [−0.06, 0.13] | 0.02 |
| Income | 0.11** | [0.06, 0.15] | 0.23** |
| Education | 0.19** | [0.14, 0.23] | 0.24** |
| Years married | −0.02 | [−0.08, 0.04] | −0.01 |
| Gender | 0.09** | [0.04, 0.14] | 1.02** |
Note: All variables assessed participants’ characteristics unless otherwise noted. See Table 1 for more information about the variables. Subsample membership was contrast-coded for whether widowed participants were in the Waves 1-2 or Waves 2-4 subsample. CI = confidence interval.
p < .05. **p < .01.
Fig. 2.
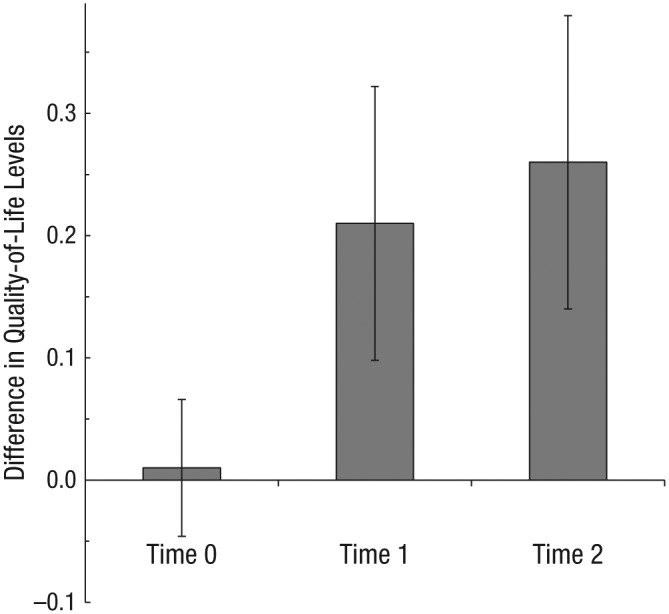
Mean difference in standardized effects for absolute quality-of-life level between nonwidowed and widowed participants. Results are shown for the Waves 2-4 subsample at Time 0 (2 years prior to Time 1), as well as from the two subsamples combined at Time 1 (before partners’ death) and Time 2 (after partners’ death). The model included Time 1 age, gender, education, income, depressive symptoms, and partner age as covariates. All effects were negative but are presented here as positive for ease of interpretation. Error bars represent 95% confidence intervals.
Hypothesis 3
To test Hypothesis 3, we examined whether there were differences between widowed and nonwidowed participants in the association of partners’ Time 1 quality of life and participants’ Time 2 quality of life. To test this, we used multiple regression with the interaction of widowed status and partners’ Time 1 quality of life as a predictor of later quality of life above and beyond the main effects of Time 1 partner and participant quality of life and widowed status. We also included relevant covariates, statistically accounting for Time 1 age, gender, education, income, depressive symptoms, and partner age.3 The Partners’ Time 1 Quality of Life × Widowed Status interaction did not significantly predict participants’ Time 2 quality of life (n = 3,113), β = −0.01, 95% CI = [−0.19, 0.17], p > .250. The association was nonsignificant, in spite of the large sample, and small in size (β = −0.01). The results suggest that the effect of partners’ Time 1 quality of life on participants’ quality of life at Time 2 are comparable between nonwidowed and widowed participants. The effect of subsample interaction was also small (β = −0.01), which suggests that the observed results were equivalent in both widowed subsamples. Full results of both models are presented in Table 6 and illustrated in Figure 3.
Table 6.
Results of the Moderation Model Predicting Participants’ Time 2 Quality of Life
| Predictor | β | 95% CI | b |
|---|---|---|---|
| Widowed status (moderator) | −0.01 | [−0.22, 0.19] | −0.21 |
| Quality of life | 0.48** | [0.45, 0.52] | 0.50** |
| Partner quality of life | 0.12** | [0.08, 0.16] | 0.12** |
| Partner Quality of Life × Widowed Status | −0.01 | [−0.21, 0.20] | −0.00 |
| Depression | −0.13** | [−0.16, –0.09] | −0.37** |
| Age | −0.11** | [−0.17, –0.04] | −0.07** |
| Partner age | −0.02 | [−0.08, 0.05] | −0.01 |
| Income percentile | 0.03* | [0.00, 0.06] | 0.08* |
| Education | 0.06** | [0.03, 0.09] | 0.09** |
| Years married | 0.05* | [0.01, 0.09] | 0.03* |
| Gender | 0.00 | [−0.03, 0.04] | 0.05 |
| Subsample | −0.02 | [−0.23, 0.18] | −0.34 |
| Partner Quality of Life × Subsample | −0.01 | [−0.21, 0.20] | −0.00 |
Note: See Table 1 for more information about the variables. Subsample membership was contrast-coded for whether widowed participants were in the Waves 1-2 or Waves 2-4 subsample. CI = confidence interval.
p < .05. **p < .01.
Fig. 3.
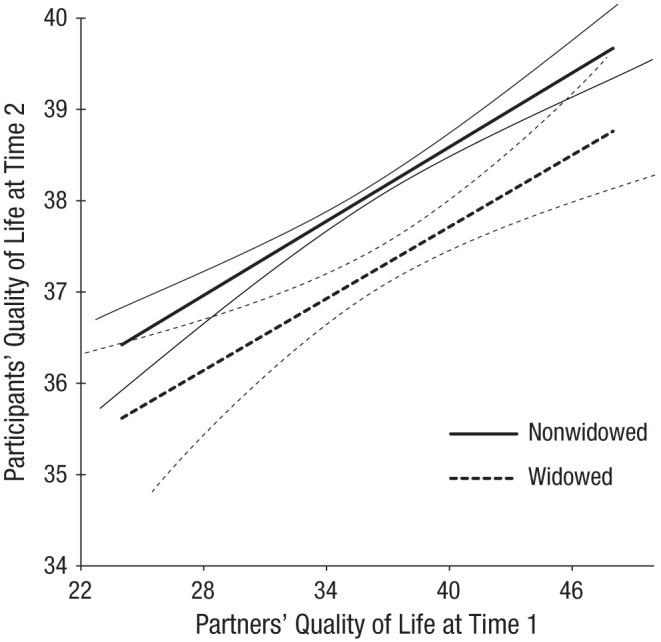
Participants’ predicted quality of life at Time 2 as a function of partners’ quality of life at Time 1, separately for the widowed and nonwidowed subsamples. This analysis accounted for Time 1 age, gender, education, income, depressive symptoms, and partner age. The thin lines flanking each regression line indicate 95% confidence intervals.
Discussion
Using a multinational longitudinal sample of aging adults, we determined that deceased partners’ quality of life prior to their death predicted their widowed spouses’ later quality of life. In addition, surviving spouses had lower quality of life both before and after their partner’s death compared with nonwidowed people. Finally, the strength of independence in couples’ quality of life was equivalent between widowed and nonwidowed participants. Attachment and interdependence theories predict dyadic effects in couples’ psychology and physiology (Lewis et al., 2006; Rholes & Simpson, 2004; Sbarra & Hazan, 2008), though these effects would hold only if the couples have ongoing interactions. In the current study, our findings suggest that dyadic effects of quality of life continue after one’s partner passes away. This effect is more than simply the effect of the association between widowed participants’ current quality of life and their prior quality of life, as including widowed participants’ prior quality of life accounts for multiple factors of a couples’ shared life (e.g., family support, housing) that might affect surviving spouses’ quality of life. Although marriages may “end” in a literal sense, the distal effects of the individual characteristics of deceased partners continue to predict their surviving spouse’s well-being.
Although we used data from a longitudinal, multinational sample and therefore could not explicitly test the psychological mechanisms of action, there are at least two plausible pathways through which deceased partners’ characteristics might affect surviving spouses’ later quality of life. Attachment theory hypothesizes that the internal working model of the spousal relationship must be reorganized after a spouse’s death, and recalling positive memories of the deceased may aid in this process by creating a potential source of symbolic support. For example, having a deceased partners with higher prior quality of life may result in a more positive internal working model of the deceased, and such a model may act as a psychological resource for surviving spouses to draw on to improve their later quality of life.
Second, having a partner with higher quality of life prior to death might better enable surviving spouses to make meaning of their partner’s death. Meaning-making attenuates the association of risk factors for distress and consequent bereavement complication in bereaved people (Neimeyer, Baldwin, & Gillies, 2006) and can make losing an attachment figure less threatening (Sbarra & Hazan, 2008). In addition, the circumstances of death can affect bereavement outcomes. For example, spouses adjust better to bereavement when death is supported by hospice care (Bradley et al., 2004). If deceased partners’ quality of life affects surviving spouses’ ability to make meaning of the death, this would in turn affect surviving spouses’ later quality of life by reducing their distress levels following their partner’s passing.
We also found that surviving spouses’ absolute quality-of-life level was significantly lower than that of nonwidowed people, both prior to and after becoming widowed. This finding conceptually replicates the findings reported by Vable et al. (2015) and extends these results to quality of life. Interestingly, the lower levels of quality of life were present among widowed participants approximately 3, but not 5, years prior to their partners’ death. One factor that might account for this difference is the effect of caregiving on quality of life (Ho, Chan, Woo, Chong, & Sham, 2009), as widowed participants may be more likely to have been caregivers for their partners. However, the support for this explanation in the data is mixed: Relatively few people reported acting as a caregiver at Time 1 in the widowed (7.9%) or the nonwidowed (7.0%) samples. More reported hours of daily caregiving prior to deceased partners’ death, however, predicted lower later quality of life for surviving spouses. Regardless, these results point to a window of increased risk for lower quality of life in bereaved spouses that occurs prior to their partners’ death.
Finally, contrary to our third hypothesis, there was no difference in the association of partners’ prior quality of life and their spouses’ later quality of life between the widowed and nonwidowed participants. The strength of the association was such that surviving spouses whose deceased partner’s Time 1 quality of life was 1 standard deviation above the mean (~6.5 points) evidenced Time 2 quality of life equivalent to that of nonwidowed participants whose partner had an average Time 1 quality of life, despite the group-level differences in Time 2 quality of life. Although these results may suggest equivalent partner effects among widowed and nonwidowed people, it seems likely that the mechanisms of action for the two groups are different. Reorganization of attachment to the deceased or meaning-making around the death may affect widowed people’s quality of life, but for those who remain married, ongoing dyadic processes likely mediate interdependence in quality of life.
The implications of the current research are twofold. First, these findings suggest that researchers exploring recovery following spousal bereavement should also consider how characteristics of the deceased partner may affect surviving spouses’ outcomes. It is well established that surviving spouses’ preloss characteristics have effects on their recovery after losing a spouse (Boerner, Wortman, & Bonanno, 2005; Bonanno et al., 2002). Relatively less research has explored the ongoing effects that prior relationships exert through cognitive or emotional links to past partners after those relationships have physically ended. It is possible that the importance of ongoing interdependence following literal separation exists among other types of close relationships.
Second, interventions targeting end-of-life quality of life may have positive effects on individuals close to the person receiving care. Psychosocial interventions targeting family members of people suffering from chronic or terminal illness have better health outcomes for the patient and better psychological outcomes for both the patient and family compared with individual medical care for the patient (Martire, Lustig, Schulz, Miller, & Helgeson, 2004). Psychosocial interventions targeting patients may reap benefits for surviving partners. The current study is not an experimental intervention, however, and we therefore cannot make causal claims regarding effects on widowed spouses’ quality of life.
The findings from this study should be considered in light of its limitations. First, despite the inclusion of a wide array of possible variables from both members of couples, it is possible that our models excluded predictors that may better explain the variation between partners’ prior quality of life and participants’ later quality of life. Quality of life may serve only as a proxy for other meaningful variables that affect surviving spouses’ later quality of life. Second, we control for alternative explanations in our analyses, such as environmental factors shared among couples and differences in the length of time between the initial assessment and the death. However, statistical control is not equivalent to experimental control of possible third-variable explanations. Third, although the widowed subsamples were drawn from a representative, multinational sample, it is possible that becoming widowed differentially affected the makeup of the sample in a way that precludes generalizing the study’s results. Finally, because the sample was made up of adults over the age of 50, it is possible this effect does not generalize to people who become widowed under the age of 50.
Conclusion
In the present study, we examined whether deceased partners’ quality of life predicted their widowed spouses’ quality of life after the partners’ death, as well as differences in absolute levels of quality of life between nonwidowed people and widowed people before and after their spouse’s death. Partners’ predeath quality of life predicted their spouses’ later quality of life after their passing. People who became widowed had lower absolute levels of quality of life—both before and after their partners’ death—compared with people who remained married. Finally, the strength of the association between partners’ earlier quality of life and their spouse’s later quality of life was not significantly different for widowed compared with nonwidowed people. In sum, the results provide evidence that interdependence among married couples’ quality of life extends beyond the death of one’s partner.
We also ran all models using listwise deletion to confirm that FIML did not bias parameter estimates. All substantive results held in these analyses.
We also ran the analyses for Hypothesis 2 without covariates and all substantive results were replicated.
We also ran the analyses for Hypothesis 3 without covariates and all substantive results were replicated.
Footnotes
Declaration of Conflicting Interests: The authors declared that they had no conflicts of interest with respect to their authorship or the publication of this article.
Funding: This research used data from Study of Health, Ageing and Retirement in Europe (SHARE) Waves 1, 2, and 4 (DOIs: 10.6103/SHARE.w1.260, 10.6103/SHARE.w2.260, 10.6103/SHARE.w4.111, respectively). The SHARE data collection has been primarily funded by the European Commission Fifth Framework Programme (QLK6-CT-2001-00360), Sixth Framework Programme (SHARE-I3: RII-CT-2006-062193, COMPARE: CIT5-CT-2005-028857), and Seventh Framework Programme (SHARE-PREP: No. 211909, SHARE-LEAP: No. 227822, SHARE M4: No. 261982). Additional funding from the German Ministry of Education and Research, the U.S. National Institute on Aging (U01_AG09740-13S2, P01_AG005842, P01_AG08291, P30_AG12815, R21_AG025169, Y1-AG-4553-01, IAG_BSR06-11, OGHA_04-064), and from various national funding sources is gratefully acknowledged (see www.share-project.org).
References
- Anderson R. (1968). I never sang for my father. New York, NY: Random House. [Google Scholar]
- Blane D., Higgs P., Hyde M., Wiggins R. D. (2004). Life course influences on quality of life in early old age. Social Science & Medicine, 58, 2171–2179. doi: 10.1016/j.socscimed.2003.08.028 [DOI] [PubMed] [Google Scholar]
- Boerner K., Wortman C. B., Bonanno G. A. (2005). Resilient or at risk? A 4-year study of older adults who initially showed high or low distress following conjugal loss. The Journals of Gerontology, Series B: Psychological Sciences & Social Sciences, 60, 67–73. doi: 10.1093/geronb/60.2.P67 [DOI] [PubMed] [Google Scholar]
- Bonanno G. A., Wortman C. B., Lehman D. R., Tweed R. G., Haring M., Sonnega J., . . . Nesse R. M. (2002). Resilience to loss and chronic grief: A prospective study from preloss to 18-months postloss. Journal of Personality and Social Psychology, 83, 1150–1164. doi: 10.1037/0022-3514.83.5.1150 [DOI] [PubMed] [Google Scholar]
- Bookwala J., Schulz R. (1996). Spousal similarity in subjective well-being: The Cardiovascular Health Study. Psychology and Aging, 11, 582–590. doi: 10.1037/0882-7974.11.4.582 [DOI] [PubMed] [Google Scholar]
- Börsch-Supan A., Brandt M., Hunkler C., Kneip T., Korbmacher J., Malter F., . . . Zuber S. (2013). Data Resource Profile: The Survey of Health, Ageing and Retirement in Europe (SHARE). International Journal of Epidemiology, 42, 992–1001. doi: 10.1093/ije/dyt088 [DOI] [PMC free article] [PubMed] [Google Scholar]
- Bourassa K. J., Memel M., Woolverton C., Sbarra D. A. (2015. a). A dyadic approach to health, cognition, and quality of life in aging adults. Psychology and Aging, 30, 449–461. [DOI] [PubMed] [Google Scholar]
- Bourassa K. J., Memel M., Woolverton C., Sbarra D. A. (2015. b). Social participation predicts cognitive functioning in aging adults over time: Comparisons with physical health, depression, and physical activity. Aging & Mental Health. Advance online publication. doi: 10.1080/13607863.2015.1081152 [DOI] [PubMed] [Google Scholar]
- Bradley E. H., Prigerson H., Carlson M. D., Cherlin E., Johnson-Hurzeler R., Kasl S. V. (2004). Depression among surviving caregivers: Does length of hospice enrollment matter? American Journal of Psychiatry, 161, 2257–2262. doi: 10.1176/appi.ajp.161.12.2257 [DOI] [PubMed] [Google Scholar]
- Castro-Costa E., Dewey M., Stewart R., Banerjee S., Huppert F., Mendonca-Lima C., . . . Prince M. (2007). Prevalence of depressive symptoms and syndromes in later life in ten European countries: The SHARE study. The British Journal of Psychiatry, 191, 393–401. doi: 10.1192/bjp.bp.107.036772 [DOI] [PubMed] [Google Scholar]
- Enders C. K., Bandalos D. L. (2001). The relative performance of full information maximum likelihood estimation for missing data in structural equation models. Structural Equation Modeling, 8, 430–457. doi: 10.1207/S15328007SEM0803_5 [DOI] [Google Scholar]
- Field N. P. (2006). Unresolved grief and continuing bonds: An attachment perspective. Death Studies, 30, 739–756. doi: 10.1080/07481180600850518 [DOI] [PubMed] [Google Scholar]
- Field N. P., Gao B., Paderna L. (2005). Continuing bonds in bereavement: An attachment theory based perspective. Death Studies, 29, 277–299. doi: 10.1080/07481180590923689 [DOI] [PubMed] [Google Scholar]
- Goldney R. D., Phillips P. J., Fisher L. J., Wilson D. H. (2004). Diabetes, depression, and quality of life: A population study. Diabetes Care, 27, 1066–1070. doi: 10.2337/diacare.27.5.1066 [DOI] [PubMed] [Google Scholar]
- Graham J. W. (2009). Missing data analysis: Making it work in the real world. Annual Review of Psychology, 60, 549–576. doi: 10.1146/annurev.psych.58.110405.085530 [DOI] [PubMed] [Google Scholar]
- Grimby A. (1993). Bereavement among elderly people: Grief reactions, post-bereavement hallucinations and quality of life. Acta Psychiatrica Scandinavica, 87, 72–80. doi: 10.1111/j.1600-0447.1993.tb03332.x [DOI] [PubMed] [Google Scholar]
- Ho S. C., Chan A., Woo J., Chong P., Sham A. (2009). Impact of caregiving on health and quality of life: A comparative population-based study of caregivers for elderly persons and noncaregivers. The Journals of Gerontology, Series A: Biological Sciences & Medical Sciences, 64, 873–879. doi: 10.1093/gerona/glp034 [DOI] [PubMed] [Google Scholar]
- Hyde M., Wiggins R. D., Higgs P., Blane D. B. (2003). A measure of quality of life in early old age: The theory, development and properties of a needs satisfaction model (CASP-19). Aging & Mental Health, 7, 186–194. doi: 10.1080/1360786031000101157 [DOI] [PubMed] [Google Scholar]
- Idler E. L., Benyamini Y. (1997). Self-rated health and mortality: A review of twenty-seven community studies. Journal of Health and Social Behavior, 38, 21–37. [PubMed] [Google Scholar]
- Klass D., Silverman P. R., Nickman S. (Eds.). (1996). Continuing bonds: New understandings of grief. New York, NY: Taylor & Francis. [Google Scholar]
- Lewis M. A., McBride C. M., Pollak K. I., Puleo E., Butterfield R. M., Emmons K. M. (2006). Understanding health behavior change among couples: An interdependence and communal coping approach. Social Science & Medicine, 62, 1369–1380. doi: 10.1016/j.socscimed.2005.08.006 [DOI] [PubMed] [Google Scholar]
- Martire L. M., Lustig A. P., Schulz R., Miller G. E., Helgeson V. S. (2004). Is it beneficial to involve a family member? A meta-analysis of psychosocial interventions for chronic illness. Health Psychology, 23, 599–611. doi: 10.1037/0278-6133.23.6.599 [DOI] [PubMed] [Google Scholar]
- Mikulincer M., Shaver P. R. (2008). An attachment perspective on bereavement. In Stroebe M. S., Hansson R. O., Schut H., Stroebe W. (Eds.), Handbook of bereavement research and practice (pp. 87–112). Washington, DC: American Psychological Association. [Google Scholar]
- Moon J. R., Kondo N., Glymour M. M., Subramanian S. V. (2011). Widowhood and mortality: A meta-analysis. PLoS ONE, 6(8), Article e23465. doi: 10.1371/journal.pone.0023465 [DOI] [PMC free article] [PubMed] [Google Scholar]
- Muthén L. K., Muthén B. O. (2012). Mplus user’s guide (7th ed.). Los Angeles, CA: Author. [Google Scholar]
- Neimeyer R. A., Baldwin S. A., Gillies J. (2006). Continuing bonds and reconstructing meaning: Mitigating complications in bereavement. Death Studies, 30, 715–738. doi: 10.1080/07481180600848322 [DOI] [PubMed] [Google Scholar]
- Netuveli G., Pikhart H., Bobak M., Blane D. (2012). Generic quality of life predicts all-cause mortality in the short term: Evidence from British Household Panel Survey. Journal of Epidemiology & Community Health, 66, 962–966. doi: 10.1136/jech-2011-200310 [DOI] [PubMed] [Google Scholar]
- O’Connor M.-F., Wellisch D. K., Stanton A. L., Olmstead R., Irwin M. R. (2012). Diurnal cortisol in complicated and non-complicated grief: Slope differences across the day. Psychoneuroendocrinology, 37, 725–728. doi: 10.1016/j.psyneuen.2011.08.009 [DOI] [PMC free article] [PubMed] [Google Scholar]
- Prince M. J., Reischies F., Beekman A. T., Fuhrer R., Jonker C., Kivela S. L., . . . Copeland J. R. (1999). Development of the EURO-D scale—A European, Union initiative to compare symptoms of depression in 14 European centres. The British Journal of Psychiatry, 174, 330–338. doi: 10.1192/bjp.174.4.330 [DOI] [PubMed] [Google Scholar]
- Rholes W., Simpson J. A. (2004). Adult attachment: Theory, research, and clinical implications. New York, NY: Guilford Publications. [Google Scholar]
- Sasson I., Umberson D. J. (2014). Widowhood and depression: New light on gender differences, selection, and psychological adjustment. The Journals of Gerontology, Series B: Psychological Sciences & Social Sciences, 69, 135–145. doi: 10.1093/geronb/gbt058 [DOI] [PMC free article] [PubMed] [Google Scholar]
- Sbarra D. A., Hazan C. (2008). Coregulation, dysregulation, self-regulation: An integrative analysis and empirical agenda for understanding adult attachment, separation, loss, and recovery. Personality and Social Psychology Review, 12, 141–167. doi: 10.1177/1088868308315702 [DOI] [PubMed] [Google Scholar]
- Schultze-Florey C. R., Martínez-Maza O., Magpantay L., Breen E. C., Irwin M. R., Gündel H., O’Connor M.-F. (2012). When grief makes you sick: Bereavement induced systemic inflammation is a question of genotype. Brain, Behavior, and Immunity, 26, 1066–1071. doi: 10.1016/j.bbi.2012.06.009 [DOI] [PMC free article] [PubMed] [Google Scholar]
- Shear K., Shair H. (2005). Attachment, loss, and complicated grief. Developmental Psychobiology, 47, 253–267. doi: 10.1002/dev.20091 [DOI] [PubMed] [Google Scholar]
- Steptoe A., Demakakos P., De Oliveira C., Wardle J. (2012). Distinctive biological correlates of positive psychological well-being in older men and women. Psychosomatic Medicine, 74, 501–508. doi: 10.1097/PSY.0b013e31824f82c8 [DOI] [PubMed] [Google Scholar]
- Steptoe A., O’Donnell K., Marmot M., Wardle J. (2008). Positive affect, psychological well-being, and good sleep. Journal of Psychosomatic Research, 64, 409–415. doi: 10.1016/j.jpsychores.2007.11.008 [DOI] [PubMed] [Google Scholar]
- Steptoe A., Wardle J. (2012). Enjoying life and living longer. Archives of Internal Medicine, 172, 273–275. doi: 10.1001/archinternmed.2011.1028 [DOI] [PubMed] [Google Scholar]
- Vable A. M., Subramanian S. V., Rist P. M., Glymour M. M. (2015). Does the “widowhood effect” precede spousal bereavement? Results from a nationally representative sample of older adults. The American Journal of Geriatric Psychiatry, 23, 283–292. doi: 10.1016/j.jagp.2014.05.004 [DOI] [PMC free article] [PubMed] [Google Scholar]
- Visser M. R. M., Smets E. M. A. (1998). Fatigue, depression and quality of life in cancer patients: How are they related? Supportive Care in Cancer, 6, 101–108. doi: 10.1007/s005200050142 [DOI] [PubMed] [Google Scholar]
- Walker R., Luszcz M., Gerstorf D., Hoppmann C. (2011). Subjective well-being dynamics in couples from the Australian longitudinal study of aging. Gerontology, 57, 153–160. doi: 10.1159/000318633 [DOI] [PubMed] [Google Scholar]
- Wiggins R. D., Higgs P. F. D., Hyde M., Blane D. B. (2004). Quality of life in the third age: Key predictors of the CASP-19 measure. Ageing & Society, 24, 693–708. doi: 10.1017/S0144686X04002284 [DOI] [Google Scholar]
- Wiggins R. D., Netuveli G., Hyde M., Higgs P., Blane D. (2008). The evaluation of a self-enumerated scale of quality of life (CASP-19) in the context of research on ageing: A combination of exploratory and confirmatory approaches. Social Indicators Research, 89, 61–77. doi: 10.1007/s11205-007-9220-5 [DOI] [Google Scholar]