

Abstract
Objective
Drowsy driving is a significant cause of traffic accidents and fatalities. While previous reports have shown an association between race and drowsy driving, the reasons for this disparity remain unclear.
Study design
A cross-sectional analysis of responses from 193,776 white, black, and Hispanic adults participating in the US Behavioral Risk Factor Surveillance System from 2009–2012 who answered a question about drowsy driving.
Measurements
Drowsy driving was defined as self-reporting an episode of falling asleep while driving in the past 30 days. All analyses were adjusted for age, sex, and medical comorbidities. Subsequent modeling evaluated the impact of accounting for differences in healthcare access, alcohol consumption, risk-taking behaviors, and sleep quality on the race – drowsy driving relationship.
Results
After adjusting for age, sex, and medical comorbidities, the odds ratio (OR) for drowsy driving was 2.07 (95% CI [1.69–2.53]) in blacks and 1.80 (95% CI [1.51-2.15]) in Hispanics, relative to whites. Accounting for healthcare access, alcohol use, and risk-taking behaviors had little effect on these associations. Accounting for differences in sleep quality resulted in a modest reduction in the OR for drowsy driving in blacks (OR=1.55, 95% CI [1.27–1.89]) but not Hispanics (OR = 1.74, 95% CI [1.45–2.08]).
Conclusion
US blacks and Hispanics have approximately twice the risk of drowsy driving compared to whites. Differences in sleep quality explained some of this disparity in blacks but not in Hispanics. Further research to understand the root causes of these disparities is needed.
Keywords: Drowsy driving, racial disparities, motor vehicle accidents, population health, daytime sleepiness
Introduction
Drowsy driving is an important cause of traffic accidents and traffic fatalities, and is associated with a large financial cost. The National Highway Traffic Safety Administration estimates there are 83,000 motor vehicle accidents and 886 deaths annually in the United States at least in part attributable to drowsy driving, defined as driving while “drowsy, sleepy, asleep, or fatigued.”1 However, due to underreporting, the prevalence is almost certainly greater, with credible estimates as high as 328,000 crashes and 6,400 deaths annually.2 Overall, sleepiness is a factor in 2.2–19% of crashes resulting in a fatality or hospitalization.1,3–5 The economic burden is high; analyses suggest drowsy driving-related crashes resulted in total costs of $15.9 billion in the US in the year 2000.6
There is a significant racial disparity in drowsy driving-related crashes. Compared to whites, racial minorities in the US are more than twice as likely to be in an accident caused by sleepiness.7 Blacks and Hispanics also have a higher prevalence of falling asleep while driving than whites. Previous analyses of data from the Behavioral Risk Factor Surveillance System (BRFSS) have reported an age-adjusted prevalence of falling asleep while driving in the past 30 days of 3.2% in whites, 6.1% in blacks, and 5.9% in Hispanics.8 This analysis was limited to only 2009 and 2010 and did not explore potential causes of the disparities.
The determinants of the drowsy driving disparity remain poorly described, though several mechanisms have been proposed.9 There is evidence that both daytime sleepiness and short sleep duration are strongly associated with drowsy driving in the general population.3,10–12 US blacks, in particular, tend to report more daytime sleepiness than US whites, and both blacks and Hispanics have increased prevalence of short sleep duration.13–18 These disparities in sleep health may be additionally compounded by reduced access to healthcare, which is more likely to be reported by blacks and Hispanics compared to whites.19,20 Without regular access to medical care, signs and symptoms of sleep disorders such as sleep apnea that are known contributors to drowsy driving risk21 may not be evaluated, delaying diagnosis and treatment. Reduced access to medical care may also lead to fewer opportunities to receive counselling from a healthcare professional on healthy sleep habits or to be advised against drowsy driving. Differences in alcohol use may be another mechanism contributing to drowsy driving disparities as alcohol acts synergistically with sleepiness via psychomotor depressant effect to increase the risk of falling asleep while driving, and also exacerbates preexisting sleep disorders in afflicted individuals.22–25 Finally, differences in risk taking behaviors may be a potential explanation for disparities in drowsy driving. Persons with higher risk tolerance or lower perception of the risk of drowsy driving are likely more willing to drive despite overwhelming fatigue.26,27
We sought to better understand the association between race and prevalence of drowsy driving in a nationally representative population. We hypothesized that the elevated risk for drowsy driving in US minority populations would be explained, at least in part, by differences in access to healthcare, alcohol use, risk-taking behavior, and sleep characteristics.
Participants and Methods
Study population
The BRFSS is an annual telephone survey of US adults conducted by the Centers for Disease Control and Prevention (CDC) and administered by the states. Potential participants are selected by random dialing using stratified sampling of landline phone numbers. In addition, since 2011, cellular phone numbers have been included in sampling. After a standardized set of questions asked of all respondents, states can use any of several optional modules covering specific topics not included in the core component. Of interest to this investigation, states could include a module on “Inadequate Sleep” from 2009 to 2012, which asked participants about sleep behaviors and characteristics including drowsy driving. The module was asked of respondents in 23 states, the District of Columbia, and Puerto Rico. Data from Puerto Rico were excluded as this analysis focuses on minorities living in the mainland US. Some jurisdictions chose to use the module in multiple years, for a total of 35 state-year administrations.
The study protocol was reviewed by the University of Pittsburgh Institutional Review Board and deemed exempt from human subject research review requirements due to the use of de-identified public data.
Study measures
Our primary exposure was self-reported race and ethnicity. Respondents were asked if they were of Hispanic ethnicity and then to select the best descriptor for their race. Due to the relatively low number of respondents reporting race and ethnicity other than Hispanic, non-Hispanic white, and non-Hispanic black, we chose to limit our cohort to individuals in one of these three categories.
Our primary outcome variable was the response to the question, “During the past 30 days, have you ever nodded off or fallen asleep, even just for a brief moment, while driving?” Possible responses were “yes,” “no,” “don’t drive,” “don’t have a license,” or otherwise refused. Individuals who did not answer “yes” or “no” were excluded.
Covariates
Demographic data including age (categorized as 18–24, 25–34, 35–44, 45–54, 55–64, 65–74, ≥75 years), sex, height, weight, and smoking status (any current smoking vs. no current smoking) were obtained by self-report. Body mass index (BMI) was calculated as the ratio of weight to the square of height and categorized as <18.5, 18.5–25.0, 25.0–30.0, 30.0–35.0, 35.0–40.0, or >40.0 kg/m2. Self-report of physician diagnoses of coronary artery disease and diabetes were also obtained. Mental health was assessed by asking respondents how many days of the previous 30 did they feel their mental health was not good and categorized as 0, 1–7, 8–29, or 30 days. Healthcare access was quantified using a question on current health insurance status (insured vs. uninsured) and a question on whether the respondent had avoided being seen by a doctor in the previous 12 months due to cost (yes/no). Alcohol use was quantified by asking the number of alcoholic drinks consumed per month (categorized as 0, 1–29, or >30 drinks per month) and whether the respondent had engaged in binge drinking (≥5 drinks per occasion for men; ≥4 drinks per occasion for women) in the past month (yes/no). Risk-taking behavior was quantified using a question on frequency of driving after having too much to drink in the past 30 days (categorized as never, 1, or ≥2 occasions), and a question on frequency of using seatbelts (categorized as always, almost always, or less than almost always). The risk-taking behavior assessment questions were both available only in 2010 and 2012, comprising 13 of the 35 state-year administrations. Four questions that addressed sleep characteristics and symptoms were used as an assessment of sleep quality: the number of days in the past 30 respondents had found themselves unintentionally falling asleep during the day (categorized as 0, 1–6, or ≥7 days), the number of days in the past 30 that they did not feel they got enough sleep (categorized as 0, 1–6, or ≥7 days), the average amount of sleep they typically get per day (categorized as <5, 5, 6, 7, 8, or ≥ 9 hours), and if they snore (yes/no).
Statistical analyses
Preliminary analyses stratifying data by state and year did not show significant interaction by state or by year on the relationship between race and drowsy driving. As a result, data across states and years were combined for analytic purposes. All analyses were weighted to account for the complex survey design of the BRFSS using sampling weights provided by the CDC.28 BRFSS weights are intended to account for non-response bias in certain difficult to reach or under-surveyed populations in order to generalize survey responses to that state’s entire population. All reported percentages and other analyses utilize sampling weights to reflect results for the entire population.
Baseline characteristics in racial groups and among those reporting drowsy driving or not were compared using ANOVA or chi-squared tests. Multivariable logistic regression was used to assess the association between race and drowsy driving after adjustment for potential mediators using a series of 6 models. The baseline model included state, year, age, sex, coronary artery disease, diabetes, BMI, mental health, and smoking as covariates. Model 2 additionally included measures of access to healthcare (health insurance status and whether cost had precluded the respondent from seeing a physician). Model 3 added measures of alcohol use (drinks per day and binge drinking) to the baseline model. Model 4 added measures of risk-taking behaviors (seatbelt use and drinking and driving) to the baseline model. Analyses for this model were restricted to only the years 2010 and 2012 as data were not available for 2009 and 2011. Model 5 added measures of sleep quality (daytime sleepiness, insufficient sleep, sleep duration, and snoring) to the baseline model. Two fully adjusted models were generated, one that included all covariates except risk taking behaviors (seatbelt use and drinking while driving) using data from all survey years (Model 6), and a second including all covariates in Models 2–5, restricted to years 2010 and 2012. Stratified analyses were undertaken by sleep characteristics to examine the consistency of the race – drowsy driving relationship across sleep characteristics adjusting for state, year, age, sex, coronary artery disease, diabetes, BMI, mental health, and smoking. All analyses were conducted in SAS version 9.4 (SAS Institute, Cary, NC).
Results
A total of 219,324 adults were administered the Inadequate Sleep module across the 35 state-year administrations. As shown in Figure 1, 16,950 respondents were excluded due to a race and ethnicity other than white, black, or Hispanic, and 7,910 were excluded due to reporting that they did not drive. A further 688 did not respond to the drowsy driving question and were also excluded, leaving 193,776 individuals whose data were used in this analysis. These individuals were 87.3% white, 6.7% black, and 6.0% Hispanic with median age 44 years (IQR 32–58) and 61.2% women.
Figure 1.
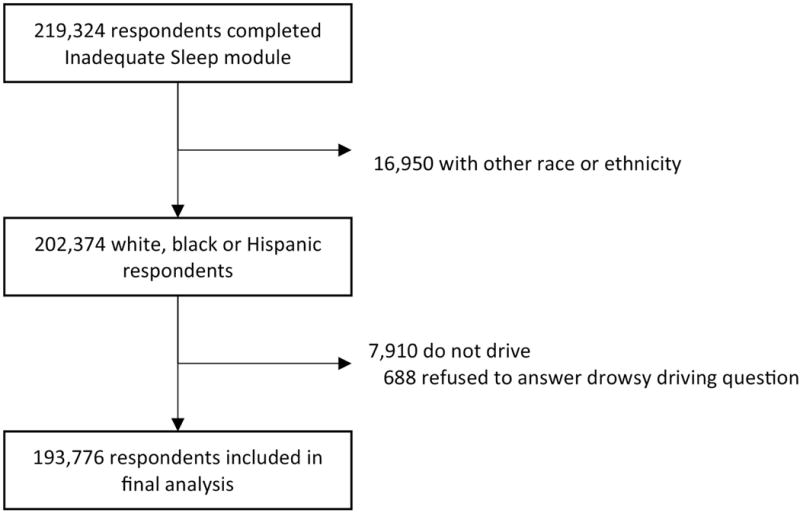
Summary of Behavioral Risk Factor Surveillance System respondents included in analysis.
Differences in access to healthcare, alcohol use, risk-taking behaviors, and sleep characteristics by race are shown in Table 1. Whites were more likely to report drinking ≥30 drinks per month, and whites and Hispanics were more likely to report recent binge drinking than blacks. Blacks and Hispanics, conversely, were more likely to report being uninsured or to have a financial barrier to healthcare than whites. Daytime somnolence, insufficient sleep, and sleep duration all differed significantly across racial groups. In particular, the proportion of individuals who reported no days with daytime somnolence in the prior month was 67.4% in whites as compared to 50.5% in blacks and 59.5% in Hispanics. Similarly, the proportion who reported 5 or fewer hours of sleep was 9.1% in whites compared to 19.6% in blacks and 10.9% in Hispanics. In contrast, the prevalence of snoring did not differ significantly by racial/ethnic group.
Table 1.
Demographic, health, and financial characteristics by race in the Behavioral Risk Factor Surveillance System 2009–2012.
| White | Black | Hispanic | p-value | |
|---|---|---|---|---|
| Lacked health coverage in last 12 months, % | 9.8 | 18.8 | 33.1 | <0.001 |
| Did not see doctor due to cost, % | 11.1 | 20.2 | 25.9 | <0.001 |
| Alcoholic drinks per month, % | <0.001 | |||
| 0 drinks | 39.3 | 55.7 | 54.1 | |
| 1–29 drinks | 45.3 | 36.3 | 34.3 | |
| ≥30 drinks | 15.3 | 7.9 | 11.7 | |
| Binge drinking in past month, % | 16.8 | 9.5 | 17.7 | <0.001 |
| Drinking and driving in past 30 days, %a | 0.795 | |||
| 0 instances | 96.3 | 96.3 | 95.7 | |
| 1 instance | 2.1 | 1.5 | 2.2 | |
| ≥ 2 instances | 1.6 | 2.2 | 2.1 | |
| Seatbelt use, % a | <0.001 | |||
| Always | 87.4 | 86.6 | 91.9 | |
| Almost always | 8.1 | 7.5 | 4.8 | |
| Sometimes, seldom, or never | 4.6 | 5.9 | 3.3 | |
| Daytime somnolence (number of days per last 30), % | <0.001 | |||
| 0 days | 67.4 | 50.5 | 59.7 | |
| 1–7 days | 24.1 | 33.5 | 31.4 | |
| >7 days | 8.5 | 16.0 | 8.9 | |
| Insufficient sleep (number of days per last 30), % | <0.001 | |||
| 0 days | 28.9 | 29.9 | 31.2 | |
| 1–7 days | 34.1 | 32.5 | 36.4 | |
| >7 days | 37.0 | 37.6 | 32.5 | |
| Average sleep duration (hours/night), % | <0.001 | |||
| <5 hours | 2.5 | 6.2 | 2.8 | |
| 5 hours | 6.6 | 13.4 | 8.1 | |
| 6 hours | 24.1 | 28.9 | 22.9 | |
| 7 hours | 32.7 | 19.4 | 29.0 | |
| 8 hours | 24.8 | 20.4 | 25.6 | |
| ≥9 hours | 9.3 | 11.7 | 11.6 | |
| Report snoring, % | 50.6 | 50.9 | 49.0 | 0.118 |
Results based on N=193,776 individual respondents generalized to the underlying populations of participating states from the 35 state-year administrations of the Inadequate Sleep module of the Behavioral Risk Factor Surveillance System (BRFSS) surveys in the years 2009–2012.
Data available only from the 2010 and 2012 BRFSS survey administrations (N=75,072)
The overall prevalence of falling asleep while driving in the past 30 days was 4.1%, with a significantly higher prevalence in blacks (6.6%, 95% CI [5.6%-7.6%]) and Hispanics (6.6%, 95% CI [5.8%-7.4%]) than whites (3.0%, 95% CI [2.8%-3.2%]). As shown in Table 2, those who reported drowsy driving were younger, more likely to be male, and have a greater BMI. They were also much more likely to report daytime somnolence, fewer than 7 hours of sleep per night, and more frequent days with inadequate sleep.
Table 2.
Demographic, financial, alcohol use, risk-taking and sleep characteristics by drowsy driving status in the Behavioral Risk Factor Surveillance System 2009–2012.
| Reported falling asleep while driving | Did not report falling asleep while driving | p-value | |
|---|---|---|---|
| Age, years, median (IQR) | 38.8 (29.8–48.7) | 44.4 (32.4–57.9) | <0.001 |
| Female, % | 38.1 | 51.6 | <0.001 |
| Body mass index, kg/m2, median (IQR) | 27.5 (24.4–32.0) | 26.6 (23.5–30.4) | <0.001 |
| Coronary artery disease, % | 3.5 | 3.7 | 0.769 |
| Diabetes, % | 8.8 | 8.1 | 0.448 |
| Current every day smoking, % | 13.4 | 16.1 | 0.010 |
| Days in the past 30 with not good mental health, % | <0.001 | ||
| 0 days | 48.2 | 65.5 | |
| 1–7 days | 26.9 | 21.3 | |
| 8–29 days | 17.3 | 8.8 | |
| 30 days | 7.6 | 4.4 | |
| Lacked health coverage in last 12 months, % | 20.6 | 15.4 | <0.001 |
| Did not see doctor due to cost, % | 26.1 | 14.6 | <0.001 |
| Alcoholic drinks per month, % | 0.555 | ||
| 0 drinks | 42.1 | 43.9 | |
| 1–29 drinks | 43.3 | 42.2 | |
| >30 drinks | 14.6 | 13.9 | |
| Binge drinking in past month, % | 23.0 | 16.1 | <0.001 |
| Drinking and driving in past 30 days, %a | 0.351 | ||
| 0 instances | 94.7 | 96.3 | |
| 1 instance | 2.5 | 2.1 | |
| ≥ 2 instances | 2.7 | 1.6 | |
| Seatbelt use, %a | <0.001 | ||
| Always | 79.1 | 88.3 | |
| Almost always | 13.4 | 7.3 | |
| Sometimes, seldom, or never | 7.6 | 4.3 | |
| Daytime somnolence (number of days per last 30), % | <0.001 | ||
| 0 days | 27.0 | 66.0 | |
| 1–7 days | 45.3 | 25.6 | |
| >7 days | 27.7 | 8.4 | |
| Insufficient sleep (number of days per last 30), % | <0.001 | ||
| 0 days | 11.4 | 30.3 | |
| 1–7 days | 29.2 | 34.7 | |
| >7 days | 59.4 | 35.0 | |
| Average sleep duration (hours/night), % | <0.001 | ||
| <5 hours | 6.8 | 2.7 | |
| 5 hours | 15.2 | 7.1 | |
| 6 hours | 34.3 | 23.8 | |
| 7 hours | 24.0 | 31.1 | |
| 8 hours | 14.3 | 25.1 | |
| ≥ 9 hours | 5.4 | 10.2 | |
| Report snoring, % | 63.3 | 49.7 | <0.001 |
Results based on N=193,776 individual respondents (of whom 5,208 reported falling asleep while driving) generalized to the underlying populations of participating states from the 35 state-year administrations of the Inadequate Sleep module of the Behavioral Risk Factor Surveillance System (BRFSS) surveys in the years 2009–2012. IQR = interquartile range.
Data available only from the 2010 and 2012 BRFSS survey administrations (N=75,072)
After accounting for age, sex, state, year, and medical comorbidity, the odds of drowsy driving was 2.07- fold greater in blacks (95% CI [1.69–2.53]) and 1.80-fold greater in Hispanics (95% CI [1.51–2.15]) compared to whites (Table 3). Accounting for differences in barriers to healthcare, alcohol use, and risk-taking behaviors had very little effect on these point estimates. In contrast, accounting for sleep characteristics reduced the odds ratio of drowsy driving in blacks versus whites by approximately 25%. On the other hand, accounting for sleep characteristics had little effect on the elevated odds ratio of drowsy driving among Hispanics compared to whites.
Table 3.
The association between race and drowsy driving: the Behavioral Risk Factor Surveillance System, 2009–2012.
| White | Black | Hispanic | |
|---|---|---|---|
| OR | OR (95% CI) | OR (95% CI) | |
| Base model: Demographics and comorbiditiesa | 1.0 | 2.07 (1.69, 2.53) | 1.80 (1.51, 2.15) |
| Model 2: Base model plus economic barriers to careb | 1.0 | 2.03 (1.65, 2.49) | 1.77 (1.47, 2.11) |
| Model 3: Base model plus alcohol usec | 1.0 | 2.11 (1.72, 2.59) | 1.81 (1.51, 2.16) |
| Model 4: Base model plus risky behaviord, e | 1.0 | 2.15 (1.58, 2.94) | 1.72 (1.28, 2.32) |
| Model 5: Base model plus sleep characteristicsf | 1.0 | 1.55 (1.27, 1.89) | 1.74 (1.45, 2.08) |
| Full model | |||
| Model 6: Base model plus Models 2, 3, and 5 | 1.0 | 1.57 (1.28, 1.91) | 1.73 (1.44, 2.09) |
Odds ratio for self-reported instances of failing asleep while driving by race obtained from logistic regression modeling. CI = confidence interval.
Adjusted for age, sex, state, year, body mass index, coronary disease, diabetes, smoking, and mental health impairment bBase model plus adjustment for health insurance status, and financial barrier to seeing a physician
Base model plus adjustment for number of drinks per month and recent binge drinking
Base model plus adjustment for seatbelt use and recent drinking and driving
Restricted to years 2010 and 2012 only (N=74,907)
Base model plus adjustment for daytime somnolence, days in last 30 with inadequate sleep, sleep duration, and snoring
After adjustment for all potential mediators available in all years (Model 6), racial disparities in drowsy driving persisted with an odds ratio of 1.57 (95% CI [1.28–1.91]) in blacks and 1.73 (95% CI [1.44–2.09]) in Hispanics compared to whites. Limiting analysis to only 2010 and 2012 and accounting for risk taking behavior similarly revealed no substantial change in the odds ratios for drowsy driving beyond the effect seen with adjustment for sleep characteristics in blacks.
Figure 2 shows the estimated mean prevalence of drowsy driving stratified by sleep characteristics. The prevalence of drowsy driving was lower in whites compared to blacks and Hispanics within each stratum of daytime somnolence, inadequate sleep, sleep duration, and snoring. Figure 3 confirms in analyses adjusting for age, sex, state, year, and comorbidities that the risk of drowsy driving is greater in blacks and Hispanics compared to whites in each stratum of sleep quality assessment.
Figure 2.
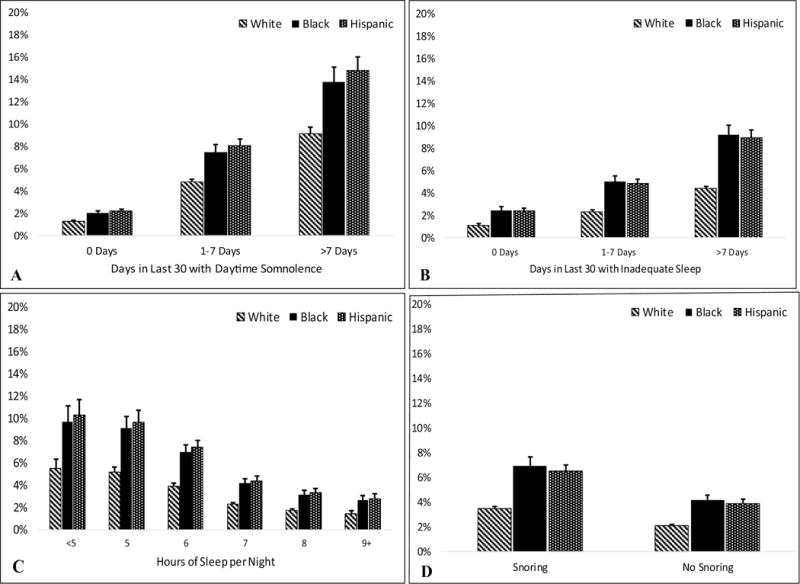
Prevalence of falling asleep while driving by sleep characteristics and race: the Behavioral Risk Factor Surveillance System, 2009–2012.
Mean prevalence (with 95% confidence intervals) of falling asleep while driving in the past 30 days. All estimates are adjusted for age, sex, state, survey year, body mass index, coronary disease, diabetes, smoking, and mental health impairment. A: Stratified by number of days in the past 30 with excessive daytime somnolence; B: stratified by number of days in the past 30 with inadequate sleep; C: stratified by self-reported average sleep duration; D: stratified by self-reported snoring status.
Figure 3.
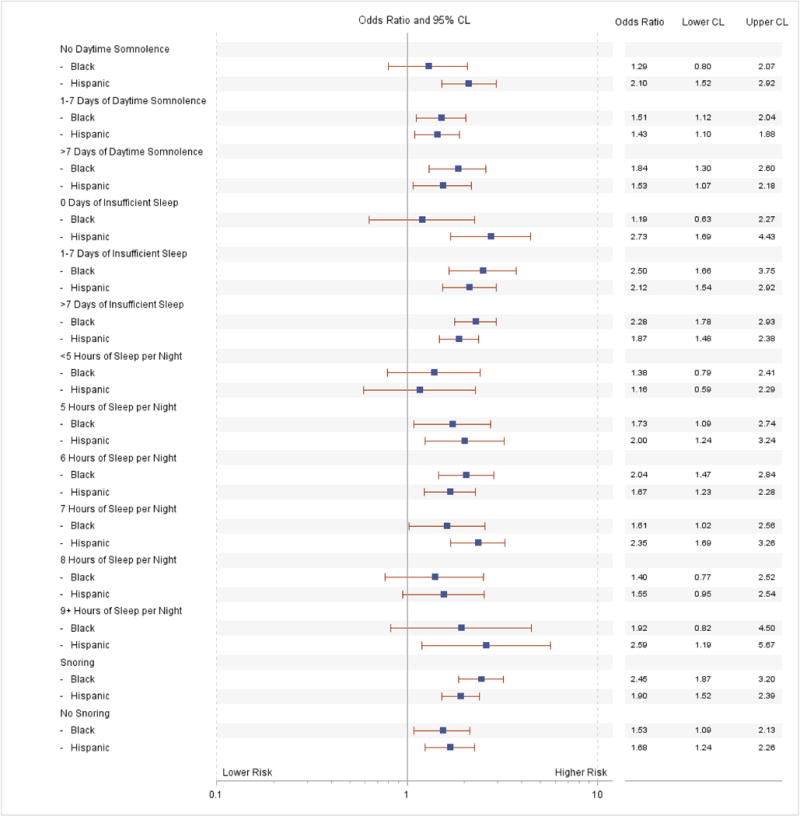
Adjusted odds of drowsy driving by race, stratified by sleep characteristics: the Behavioral Risk Factor Surveillance System, 2009–2012.
All models adjusted for age, sex, state, year, body mass index, coronary disease, diabetes, smoking, and mental health impairment. All odds ratios estimated with whites as the referent population. Lower CL = lower 95% confidence limit; upper CL = upper 95% confidence limit.
Discussion
Racial minorities in the United States suffer poorer outcomes across a broad range of health conditions and diseases.20 One such condition is in risk of drowsy driving and motor vehicle crashes related to fatigue, where consistently highly rates in racial minorities have been identified.7,8 In this work, we explored potential explanatory mechanisms for the racial differences in drowsy driving risk. We found that after adjustment for comorbidities, access to healthcare, alcohol use, and risk-taking behavior, the estimated odds of falling asleep while driving for blacks and Hispanics compared to whites did not change, suggesting these factors do not substantially contribute to the identified disparity. Adjustment for sleep quality, however, does reduce the association between drowsy driving and black race, suggesting deficits in sleep quality may partially mediate the relationship.
Racial disparities in sleep health are well described, with a known elevated burden of poor sleep in US blacks and Hispanics.9,18,29 Given the associations between adverse sleep characteristics such as daytime sleepiness and short sleep duration with drowsy driving,30,31 the size of the residual racial disparity after adjustment for sleep quality is surprising, particularly in Hispanics. This substantial residual effect of race on drowsy driving risk after full adjustment can be attributed to the combination of societal, genetic, and physical characteristics which differ, on average, between racial groups in the United States, minus those factors for which we have accounted for as covariates in our modeling. We suggest, then, that poorer sleep health appears to partially explain the disparity in blacks but not in Hispanics, while the other proposed mediators do not contribute importantly in explaining the observed disparities.
Overall, the prevalence of falling asleep while driving in this investigation was 4.1%, which is similar to previously reported figures.31–33 The BRFSS asked patients to self-report instances of actually falling asleep while driving in the past 30 days. Other investigations have found, for example, that the prevalence of driving while excessively tired (without requiring that respondent actually fell asleep) over a 12-month period is 51%, and that 1% of American motorists have been involved in an automobile crash attributed to falling asleep at the wheel in their lifetimes.34 Consistent with prior research, we found that male gender, obesity, and snoring were associated with drowsy driving.8,35 The association between male gender and drowsy driving is well described, and may be due in part to increased risk-taking driving behavior in men.36 Our finding of an association between increased BMI and drowsy driving is potentially explained through mediation by obstructive sleep apnea (OSA). The increased prevalence of snoring in those reporting drowsy driving supports this hypothesis. Alternatively, the association between BMI and drowsy driving may be explained by the generalized inflammatory state associated with obesity resulting in excessive daytime sleepiness.37 Obesity as a marker of excess nutrition may also serve as a surrogate for increased intake of certain nutrients associated with hypersomnolence.38 Further research is needed to better define the causes of this association.
Daytime somnolence is strongly associated with drowsy driving10 and was explicitly asked in BRFSS (“During the past 30 days, for about how many days did you find yourself unintentionally falling asleep during the day?”). Patients reporting daytime somnolence to their physician may be referred for medical sleep evaluation, however both blacks and Hispanics have notably lower rates of referral to sleep centers and lower rates of completed consultation for patients who have been referred.39 This difference is especially notable as there is general recognition of the increased burden of sleep disorders such as OSA among blacks in particular, perhaps due to delayed diagnosis and treatment.9 The increased prevalence and severity of sleep disorders in blacks may explain the partial attenuation of drowsy driving odds seen after accounting for differences in sleep characteristics. Less data are available regarding the burden of sleep disorders in Hispanic populations. However, it is generally known that Hispanics have a higher prevalence of obesity and are more likely to report snoring than whites, though the rate of OSA in Hispanics may be similar to or perhaps slightly higher than that in whites.9
Somewhat surprisingly, other factors such as economic barriers to healthcare or alcohol use did not appear to account for any of the racial differences observed in our analyses. Drowsy driving is more common among those who report having had a health insurance lapse in the previous 12 months (20.6% vs 15.4%) and reporting financial barriers to seeing a physician (26.1% vs 14.6%). It is possible that the questions used do not adequately assess health care access. This seems unlikely as both BRFSS questions have been shown to correlate with income and are responsive to changes in the local and national health insurance marketplaces in ways consistent with other survey instruments.40,41 Perhaps racial differences in referral and treatment rates for sleep disorders are not as well predicted by economic barriers to care as is generally assumed, or that economic barriers to care are not the most important contributors to the well-described unhealthy sleep behaviors associated with lower socioeconomic status.
Alcohol use exacerbates OSA both by increasing the frequency of respiratory events and by increasing the duration of events.23 Though blacks and Hispanics typically have lower absolute rates of alcohol use than whites, those who do drink suffer from higher rates of negative social and health-related consequences than whites.42–44 Accounting for both quantity of alcohol use and binge drinking does not appear to explain the elevated risk of drowsy driving in minorities.
There may be multiple explanations for the residual elevated odds of drowsy driving in US blacks and Hispanics. We do not have data for driving routines and behaviors. One could imagine that at-risk sleep behaviors such as short sleep duration may be of more consequence in longer commute times or off-hours shift work, which would compound the risk of drowsy driving posed by both those factors alone. One hypothesis is that social and economic forces prevent people from living within close commuting distance to their workplace or compel people to accept a job with suboptimal shift timing. In exploratory analyses, we did not find any relationship between metropolitan location (urban, inner suburban, outer suburban, or rural) and drowsy driving prevalence. Metropolitan location is a crude measure, however, and likely cannot be used to approximate the complex relationship between wealth, neighborhood characteristics, and the legacy of discriminatory housing policy that explains where people reside within the United States.45 Use of more robust measures of neighborhood characteristics, perhaps linking BRFSS to Geographic Information System mapping, may be an avenue for further research. Still, it is possible that unaccounted for differences in total miles driven, highway infrastructure (lighting, rumble strip installation), and timing of driving can all contribute to drowsy driving risk. Unfortunately, data on commuting distances or other measures of amount of driving done as well as job shifts or other measures of timing of driving were not assessed in the BRFSS.
Our study has several limitations. First, we assumed uniformity of data across the study years despite a changing healthcare landscape, especially on questions of access to health insurance. However, subjects evaluated during our study years of 2009–2012 would not yet have been affected by the 2010 Patient Protection and Affordable Care Act, as key provisions of the law which expanded health insurance access did not go into effect until 2014. Second, the self-reported nature of our covariates and outcome may lead to measurement error. Participants not under routine care of a physician, perhaps due to poor healthcare access, may under-report comorbidities due to under-diagnosis. Of some concern is that some respondents would not be willing to disclose dangerous or possibly illegal behavior to a government-sponsored interviewer, which would lead to an underestimate of drowsy driving. Differential self-report in drowsy driving by race with systematic under-reporting by whites would lead to an artificial findings of elevated minority risk of drowsy driving. However, our finding of similar rates of self-reported drinking and driving by race when prior studies of objective crash data have demonstrated increased risk in blacks and Hispanics46,47 suggests underreporting of drinking and driving is greater in minorities. If this pattern translates to drowsy driving, our findings may understate the magnitude of the actual disparity between white and minority drivers. Additionally, while sleep duration is typically self-reported in epidemiologic cohorts due to the ease and cost-effectiveness of data collection, its accuracy against objectively measured sleep duration using polysomnography or actigraphy is considered to be fair at best. Agreement of self-report and objective sleep time measurement to within an hour was only approximately 80% in one study; another investigation found the standard deviation for the difference between the two measurements to be 77.9 minutes.48,49 Finally, although snoring is clearly associated with OSA, the use of self-reported snoring to assume OSA status is problematic, with a generally high sensitivity but a specificity of only 27–46%.50
Despite these limitations, this study has notable strengths. We analyzed data from a very large, nationally representative survey and were able to use survey weights to account for under-sampling of notoriously difficult to survey populations, including the young and the economically disadvantaged. The CDC provides a standardized Spanish version of the questionnaire, which reduces concerns about data comparability across participants who primarily speak English versus Spanish. The sample size also allowed for meaningful subgroup analysis by sleep characteristics (Figure 3), showing a persistent disparity in drowsy driving prevalence and confirming again that differences in drowsy driving cannot be attributed solely to differences in sleep disturbances.
Conclusions
Drowsy driving is a significant public health concern, and current guidelines stress the importance of identification of individuals at risk. In this study, we found that US blacks and Hispanics have roughly twice the prevalence of falling asleep while driving compared to whites, and this disparity was not explained by differences in access to healthcare, alcohol consumption, or tolerance for risk-taking. Accounting for differences in sleep characteristics explained approximately 25% of the disparity in drowsy driving between blacks and whites but did not explain the disparity in Hispanics. Our findings support the need for more detailed investigations into the risk factors for drowsy driving and the impact of these risk factors in contributing to racial disparities in motor vehicle crash risk. Additionally, given our finding of differential contributors to drowsy driving risk in blacks and Hispanics, further research is needed to better understand differences in drowsy driving risk factors between these groups, including cultural factors such as attitudes and beliefs about sleep and fatigue. Finally, our findings argue for greater public health efforts aimed at minority populations on the dangers of drowsy driving and appropriate avoidance measures.
Acknowledgments
This work was supported by NIH T32 HL083825, T32 HL082610, and K24 HL127307.
Abbreviations
- BMI
Body mass index
- BRFSS
Behavioral Risk Factor Surveillance System
- CDC
Centers for Disease Control and Prevention
- OSA
Obstructive sleep apnea
Footnotes
Publisher's Disclaimer: This is a PDF file of an unedited manuscript that has been accepted for publication. As a service to our customers we are providing this early version of the manuscript. The manuscript will undergo copyediting, typesetting, and review of the resulting proof before it is published in its final citable form. Please note that during the production process errors may be discovered which could affect the content, and all legal disclaimers that apply to the journal pertain.
Conflict of interest statement: The authors have no significant competing interests to declare.
References
- 1.National Highway Traffic Safety Administration. Traffic Safety Facts: Droswy Driving. Natinal Highw Traffic Saf Adm. 2011 Mar;854:1–3. http://www-nrd.nhtsa.dot.gov/pubs/811449.pdf. [Google Scholar]
- 2.Tefft BC, AAA Foundation for Traffic Safety . Prevalence of Motor Vehicle Crashes Involving Drowsy Drivers, United States, 2009–2013. Washington, DC: 2014. [Google Scholar]
- 3.Connor J, Norton R, Ameratunga S, et al. Driver sleepiness and risk of serious injury to car occupants: population based case control study. BMJ. 2002;324(7346):1125. doi: 10.1136/bmj.324.7346.1125. [DOI] [PMC free article] [PubMed] [Google Scholar]
- 4.Horne JA, Reyner LA. Sleep related vehicle accidents. BMJ. 1995;310(6979):565–567. doi: 10.1136/bmj.310.6979.565. [DOI] [PMC free article] [PubMed] [Google Scholar]
- 5.Sagberg F. Road accidents caused by drivers falling asleep. Accid Anal Prev. 1999;31(6):639–649. doi: 10.1016/S0001-4575(99)00023-8. [DOI] [PubMed] [Google Scholar]
- 6.Sassani A, Findley LJ, Kryger M, Goldlust E, George C, Davidson TM. Reducing motor-vehicle collisions, costs, and fatalities by treating obstructive sleep apnea syndrome. Sleep. 2004;27(3):453–458. doi: 10.1164/rccm2102028. [DOI] [PubMed] [Google Scholar]
- 7.Powell NB, Schechtman KB, Riley RW, Guilleminault C, Chiang RP, Weaver EM. Sleepy driver near-misses may predict accident risks. Sleep. 2007;30(3):331–342. doi: 10.1093/sleep/30.3.331. [DOI] [PubMed] [Google Scholar]
- 8.Wheaton AG, Chapman DP, Presley-Cantrell LR, Croft JB, Roehler DR. Drowsy Driving — 19 States and the District of Columbia, 2009–2010. MMWR Morb Mortal Wkly Rep. 2013;61(51):1033–1037. http://www.ncbi.nlm.nih.gov/pubmed/23282860. [PubMed] [Google Scholar]
- 9.Dudley KA, Patel SR. Disparities and genetic risk factors in obstructive sleep apnea. Sleep Med. 2016;18:96–102. doi: 10.1016/j.sleep.2015.01.015. [DOI] [PMC free article] [PubMed] [Google Scholar]
- 10.Arita A, Sasanabe R, Hasegawa R, et al. Risk factors for automobile accidents caused by falling asleep while driving in obstructive sleep apnea syndrome. Sleep Breath. 2015;19(4):1229–1234. doi: 10.1007/s11325-015-1145-7. [DOI] [PMC free article] [PubMed] [Google Scholar]
- 11.Robb G, Sultana S, Ameratunga S, Jackson R. A systematic review of epidemiological studies investigating risk factors for work-related road traffic crashes and injuries. Inj Prev. 2008;14(1):51–58. doi: 10.1136/ip.2007.016766. [DOI] [PubMed] [Google Scholar]
- 12.Lardelli-Claret P, Luna-Del-Castillo JDD, Jiménez-Moleón JJ, et al. Association of main driver-dependent risk factors with the risk of causing a vehicle collision in Spain, 1990–1999. Ann Epidemiol. 2003;13(7):509–517. doi: 10.1016/S1047-2797(03)00003-6. [DOI] [PubMed] [Google Scholar]
- 13.Baron KG, Liu K, Chan C, Shahar E, Hasnain-Wynia R, Zee P. Race and Ethnic Variation in Excessive Daytime Sleepiness: The Multi-Ethnic Study of Atherosclerosis. Behav Sleep Med. 2010;8(4):231–245. doi: 10.1080/15402002.2010.509247. [DOI] [PubMed] [Google Scholar]
- 14.Whinnery J, Jackson N, Rattanaumpawan P, Grandner MA. Short and Long Sleep Duration Associated with Race/Ethnicity, Sociodemographics, and Socioeconomic Position. Sleep. 2014;37(3):601–611. doi: 10.5665/sleep.3508. [DOI] [PMC free article] [PubMed] [Google Scholar]
- 15.Hayes AL, Spilsbury JC, Patel SR. The Epworth score in African American populations. J Clin Sleep Med. 2009;5(4):344–348. [PMC free article] [PubMed] [Google Scholar]
- 16.Carnethon MR, De Chavez PJ, Zee PC, et al. Disparities in sleep characteristics by race/ethnicity in a population-based sample: Chicago Area Sleep Study. Sleep Med. 2016;18:50–55. doi: 10.1016/j.sleep.2015.07.005. [DOI] [PMC free article] [PubMed] [Google Scholar]
- 17.Walsemann KM, Ailshire JA, Fisk CE, Brown LL. Do gender and racial/ethnic disparities in sleep duration emerge in early adulthood? Evidence from a longitudinal study of U.S. adults. Sleep Med. 2017;36:133–140. doi: 10.1016/j.sleep.2017.03.031. [DOI] [PMC free article] [PubMed] [Google Scholar]
- 18.Williams NJ, Grandne MA, Snipes A, et al. Racial/ethnic disparities in sleep health and health care: importance of a sociocultural context. Sleep Heal. 2015;1(1):28–35. doi: 10.1016/j.sleh.2014.12.004.Racial/ethnic. [DOI] [PMC free article] [PubMed] [Google Scholar]
- 19.Redline S, Tishler PV, Hans MG, Tosteson TD, Strohl KP, Spry K. Racial differences in sleep-disordered breathing in African-Americans and Caucasians. Am J Respir Crit Care Med. 1997;155(1):186–192. doi: 10.1164/ajrccm.155.1.9001310. [DOI] [PubMed] [Google Scholar]
- 20.Agency for Healthcare Research and Quality. 2015 National Healthcare Quality and Disparities Report and 5th Anniversary Update on the National Quality Strategy. 2016 http://www.ahrq.gov/sites/default/files/wysiwyg/research/findings/nhqrdr/nhqdr15/2015nhqdr.pdf.
- 21.Tregear S, Reston J, Schoelles K, Phillips B. Obstructive sleep apnea and risk of motor vehicle crash: Systematic review and meta-analysis. J Clin Sleep Med. 2009;5(6):573–581. [PMC free article] [PubMed] [Google Scholar]
- 22.Berry RB, Bonnet MH, Light RW. Effect of Ethanol on the Arousal Response to Airway Occlusion during Sleep in Normal Subjects. Am Rev Respir Dis. 1992;145:445–452. doi: 10.1164/ajrccm/145.2_Pt_1.445. [DOI] [PubMed] [Google Scholar]
- 23.Scrima L, Broudy M, Nay K, Cohn M. Increased severity of obstructive sleep apnea after bedtime alcohol ingestion: diagnostic potential and proposed mechanism of action. Sleep. 1982;5(4):318–328. doi: 10.1093/sleep/5.4.318. [DOI] [PubMed] [Google Scholar]
- 24.Barrett PR, Horne JA, Reyner LA. Early evening low alcohol intake also worsens sleepiness-related driving impairment. Hum Psychopharmacol. 2005;20(4):287–290. doi: 10.1002/hup.691. [DOI] [PubMed] [Google Scholar]
- 25.Vakulin A, Baulk SD, Catcheside PG, Antic NA, Van Den Heuvel CJ. Effects of Alcohol and Sleep Restriction on Simulated Driving Performance in Untreated Patients With Obstructive Sleep Apnea. Ann Intern Med. 2009;151:447–455. doi: 10.7326/0003-4819-151-7-200910060-00005. [DOI] [PubMed] [Google Scholar]
- 26.Watling CN, Armstrong KA, Obst PL, Smith SS. Continuing to drive while sleepy: The influence of sleepiness countermeasures, motivation for driving sleepy, and risk perception. Accid Anal Prev. 2014;73:262–268. doi: 10.1016/j.aap.2014.09.021. [DOI] [PubMed] [Google Scholar]
- 27.Wheaton AG, Shults RA, Chapman DP, Ford ES, Croft JB. Drowsy Driving and Risk Behaviors — 10 States and Puerto Rico, 2011–2012. MMWR Morb Mortal Wkly Rep. 2014;63(26):557–562. doi:mm6326a3 [pii] [PMC free article] [PubMed] [Google Scholar]
- 28.Centers for Disease Control and Prevention. Behavioral Risk Factor Surveillance System Overview: 2012 BRFSS. https://www.cdc.gov/brfss/annual_data/2012/pdf/overview_2012.pdf. Published 2013. Accessed February 23, 2018.
- 29.Hale L, Do DP. Racial differences in self-reports of sleep duration in a population-based study. Sleep. 2007;30(9):1096–1103. doi: 10.1093/sleep/30.9.1096. [DOI] [PMC free article] [PubMed] [Google Scholar]
- 30.Stutts JC, Wilkins JW, Osberg JS, Vaughn BV. Driver risk factors for sleep-related crashes. Accid Anal Prev. 2003;35(3):321–331. doi: 10.1016/S0001-4575(02)00007-6. [DOI] [PubMed] [Google Scholar]
- 31.Abe T, Komada Y, Inoue Y. Short Sleep Duration, Snoring and Subjective Sleep Insufficiency Are Independent Factors Associated with both Falling Asleep and Feeling Sleepiness while Driving. Intern Med. 2012;51(23):3253–3260. doi: 10.2169/internalmedicine.51.7518. [DOI] [PubMed] [Google Scholar]
- 32.Masa JF, Rubio M, Findley LJ, et al. Habitually sleepy drivers have a high frequency of automobile crashes associated with respiratory disorders during sleep. Am J Respir Crit Care Med. 2000;162(4 I):1407–1412. doi: 10.1164/ajrccm.162.4.9907019. [DOI] [PubMed] [Google Scholar]
- 33.Maia Q, Grandner MA, Findley J, Gurubhagavatula I. Short and long sleep duration and risk of drowsy driving and the role of subjective sleep insufficiency. Accid Anal Prev. 2013;59:618–622. doi: 10.1016/j.aap.2013.07.028. [DOI] [PMC free article] [PubMed] [Google Scholar]
- 34.Drobnich D. A National Sleep Foundation’s conference summary: the National Summit to Prevent Drowsy Driving and a new call to action. Ind Health. 2005;43(1):197–200. doi: 10.2486/indhealth.43.197. [DOI] [PubMed] [Google Scholar]
- 35.McKnight-Eily L, Liu Y, Wheaton A, et al. Unhealthy sleep-related behaviors–12 States, 2009. MMWR Morb Mortal Wkly Rep. 2011;60(8):233–238. [PubMed] [Google Scholar]
- 36.Gwyther H, Holland C. The effect of age, gender and attitudes on self-regulation in driving. Accid Anal Prev. 2012;45:19–28. doi: 10.1016/j.aap.2011.11.022. [DOI] [PubMed] [Google Scholar]
- 37.Vgontzas AN, Bixler EO, Chrousos GP. Obesity-related sleepiness and fatigue: The role of the stress system and cytokines. Ann N Y Acad Sci. 2006;1083:329–344. doi: 10.1196/annals.1367.023. [DOI] [PubMed] [Google Scholar]
- 38.Grandner MA, Jackson N, Gerstner JR, Knutson KL. Sleep symptoms associated with intake of specific dietary nutrients. J Sleep Res. 2014;23(1):22–34. doi: 10.1111/jsr.12084. [DOI] [PMC free article] [PubMed] [Google Scholar]
- 39.Jean-Louis G, von Gizycki H, Zizi F, Dharawat A, Lazar JM, Brown CD. Evaluation of sleep apnea in a sample of black patients. J Clin Sleep Med. 2008;4(5):421–425. [PMC free article] [PubMed] [Google Scholar]
- 40.Griffith K, Evans L, Bor J. The affordable care act reduced socioeconomic disparities in health care access. Health Aff. 2017;36(8):1503–1510. doi: 10.1377/hlthaff.2017.0083. [DOI] [PMC free article] [PubMed] [Google Scholar]
- 41.Sommers BD, Maylone B, Blendon RJ, John Orav E, Epstein AM. Three-year impacts of the affordable care act: Improved medical care and health among low-income adults. Health Aff. 2017;36(6):1119–1128. doi: 10.1377/hlthaff.2017.0293. [DOI] [PubMed] [Google Scholar]
- 42.Zemore SE, Ye Y, Mulia N, Martinez P, Jones-Webb R, Karriker-Jaffe K. Poor, persecuted, young, and alone: Toward explaining the elevated risk of alcohol problems among Black and Latino men who drink. Drug Alcohol Depend. 2016;163:31–39. doi: 10.1016/j.celrep.2016.01.043.Improved. [DOI] [PMC free article] [PubMed] [Google Scholar]
- 43.Hasin DS, Stinson FS, Ogburn E, Grant BF. Prevalence, Correlates, Disability, and Comorbidity of DSM-IV Alcohol Abuse and Dependence in the United States. Arch Gen Psychiatry. 2007;64(7):830–842. doi: 10.1001/archpsyc.64.7.830. [DOI] [PubMed] [Google Scholar]
- 44.Mulia N, Ye Y, Greenfield TK, Zemore SE. Disparities in alcohol-related problems among white, black, and hispanic Americans. Alcohol Clin Exp Res. 2009;33(4):654–662. doi: 10.1111/j.1530-0277.2008.00880.x. [DOI] [PMC free article] [PubMed] [Google Scholar]
- 45.Williams DR. Race, Socioeconomic Status, and Health The Added Effects of Racism and Discrimination. Ann N Y Acad Sci. 1999;896(1):173–188. doi: 10.1111/j.1749-6632.1999.tb08114.x. [DOI] [PubMed] [Google Scholar]
- 46.Torres P, Romano E, Voas RB, de la Rosa M, Lacey JH. The relative risk of involvement in fatal crashes as a function of race/ethnicity and blood alcohol concentration. J Saf Res. 2014;48:95–101. doi: 10.1016/j.jsr.2013.12.005. [DOI] [PMC free article] [PubMed] [Google Scholar]
- 47.NHTSA Technical Report. Race and Ethnicity in Fatal Motor Vehicle Traffic Crashes 1999 – 2004. 2006 [Google Scholar]
- 48.Girschik J, Fritschi L, Heyworth J, Waters F. Validation of self-reported sleep against actigraphy. Jounral Epidemiol. 2012;22(5):462–468. doi: 10.2188/jea.JE20120012. [DOI] [PMC free article] [PubMed] [Google Scholar]
- 49.Zinkhan M, Berger K, Hense S, et al. Agreement of different methods for assessing sleep characteristics: A comparison of two actigraphs, wrist and hip placement, and self-report with polysomnography. Sleep Med. 2014;15(9):1107–1114. doi: 10.1016/j.sleep.2014.04.015. [DOI] [PubMed] [Google Scholar]
- 50.Myers KA, Mrkobrada M, Simel DL. Does This Patient Have Obstructive Sleep Apnea? JAMA J Am Med Assoc. 2013;310(7):731–741. doi: 10.1001/jama.2013.276185. [DOI] [PubMed] [Google Scholar]