

Abstract
Background
Aim was to analyze the expression of different cancer testis antigens (CTA) and to assess its prognostic value in salivary gland carcinomas.
Methods
Patients with salivary gland carcinomas diagnosed 1994 to 2010 were included. Baseline characteristics, pathohistological, clinical, and outcome data were assessed. Tissue microarrays were constructed and immunohistochemistry for different CTA (NY‐ESO1, NY‐BR1, MAGE A1, MAGE A3, MAGE A4, MAGE C1/CT7, and MAGE C2/CT10) was performed. CTA expression was assessed and statistically correlated with pathological and outcome data.
Results
Expression rates of CTA in salivary gland tumors ranged from 0% to 40%. MAGE A4 expression was associated with a lower tumor grade tumor grading (P = .017), and a favorable recurrence‐free (P = .003), disease‐specific (P = .046) and overall survival (P = .028).
Conclusions
MAGE A4 is a highly significant prognostic marker in salivary gland carcinoma; its expression is associated with low‐grade histology, a low rate of distant metastasis and a favorable survival.
Level of Evidence
4
Keywords: Cancer testis antigen, salivary gland carcinoma, prognostic marker, outcome, MAGE A4
INTRODUCTION
Cancer testis antigens (CTAs) are a family of more than 204 immunogenic proteins, which are expressed in various malignant tumors, but usually not in normal tissue except testis, placenta, or fetal tissues.1, 2, 3 Short peptide segments of CTAs are presented on the human leukocyte antigen (HLA) receptor and recognized by cytotoxic T lymphocytes, inducing cellular and humoral immune responses and tumor rejection.1, 2, 3, 4, 5
The relevance of CTAs as prognostic biomarkers has been demonstrated in many malignant tumors such as breast, lung, thyroid, and head and neck squamous cell carcinoma.1, 6, 7, 8 In contrast, there are only few studies investigating the role of CTAs in salivary gland carcinomas.2, 3, 4 Most of these investigated the role of CTAs as diagnostic markers in a relatively small number of patients and did not focus on prognostic relevance of CTAs.2, 3, 4 Another study analyzed the promoting effect of the CTA XAGE‐1b on proliferation and metastasis of adenoid cystic carcinoma (ACC) tumor cells in vitro and in a mouse model.9
Since salivary gland carcinomas and breast cancer show histopathological similarities and CTAs have been shown to have prognostic relevance with regard to the latter, we hypothesized the existence of a relationship between the expression of CTA and the prognosis in salivary gland carcinomas.10 Therefore, aim of this study was to investigate the expression of various CTAs in different salivary gland carcinomas. The latter could improve a future, patient‐tailored treatment according to the predicted patterns of aggressiveness.
MATERIALS AND METHODS
Patients
The study protocol obtained approval by the local ethics committee (KEK‐ZH‐Nr. 2010‐0206/0). All patients with malignant tumors of the salivary glands diagnosed and treated between January 1, 1994 and December 31, 2010 (17 years) were included in this study. Exclusion criteria were incomplete data sets and poor tissue quality or quantity to perform further analysis. All medical charts were retrospectively reviewed for the following parameters: age at initial diagnosis, sex, tumor entity, and localization, TNM classification, Union for International Cancer Control (UICC)/American Joint Committee on Cancer stages, tumor grading, resection margins, extracapsular spread of lymph node metastasis, perineural invasion, blood and lymphatic vessel invasion, recurrence and survival. The histopathological slides were all reviewed by an experienced head and neck pathologist (M.R.). Unfortunately, there is no commonly accepted grading system for the different tumor types, so we used the grading system according to Brandwein et al.11 for mucoepidermoid carcinoma (MEC) and the grading system according to Szanto et al.12 for acinic cell carcinoma (AcCC). All other subtypes were graded according to their similarity to their normal counterpart tissue, the grade of anaplasia and pleomorphism, the amount of vascular and perineural invasion, and their mitotic activity. Patients included in this study were treated surgically and with postoperative radiation therapy in case of T≥3, N≥2a, high‐grade histology, close or positive margins, and/or extracapsular spread of lymph node metastasis. Recurrence‐free survival (RFS) was defined as the length of time after primary treatment, in which a patient survived without any signs of cancer. Disease‐specific survival (DSS) and overall survival (OS) were defined as the time period from the last day of therapy to death from disease or any cause, respectively. Posttreatment follow‐up examinations were all performed at the Department of Otorhinolaryngology, Head and Neck Surgery, University Hospital of Zurich and consisted of clinical examinations and routine use of ultrasonography, MRI and/or PET‐CT. The disease status and survival parameters of all patients were routinely documented in the patient chart. Standardized follow up time in patients with salivary gland carcinomas is 10 years.
Tissue Microarray Construction/Immunohistochemistry
Antibody staining protocols have been developed in our laboratory. Our scoring algorithms of all CTA have been used in more than 2500 malignant tumors and been reported in previous publications.13, 14, 15, 16, 17, 18, 19, 20, 21, 22 We used sections of a previously described tissue microarray (TMA)23 for this study. In brief, two core tissue biopsies (diameter, 0.6 mm; length, 3–4 mm) were taken from a morphologically representative region of interest of the paraffin “donor” blocks and arrayed precisely into a new “recipient” paraffin block using a stereomicroscope and the Beecher TMA instrument (Beecher Instruments, Sun Prairie, Wisconsin, U.S.A.).24 The newly constructed blocks were cut into 3.0 μm sections and used for further analysis.
CTA immunohistochemistry was performed on automated, biotin‐free staining systems according to the manufacturers' instructions as followed: NY‐ESO1 (clone E978, mouse, monoclonal; dilution 1:10; Zymed Laboratories Inc., San Francisco, California, U.S.A.), NY‐BR1 (clone NY‐BR1, mouse, monoclonal, dilution 1:200; ThermoFisher Scientific, Waltham, Massachusetts, U.S.A.), MAGE‐A4 (polyclonal antibody aa24–38, rabbit, dilution 1:50; Lifespan Biosciences Inc., Seattle, Washington, U.S.A.), MAGE‐C1/CT7 (clone CT7–33, mouse, monoclonal, dilution 1:80; DAKO; Glostrup, Denmark) and MAGE‐C2/CT10 (polyclonal antibody, rabbit, dilution 1:500; ProteinTech Group, Inc., Chicago, Illinois, U.S.A.) on Ventana Benchmark System (Ventana Medical Systems, Tucson, Arizona, U.S.A.), and MAGE‐A1 (clone MA454, mouse, monoclonal, dilution 1:200; Abnova Corporation, Taipei, Taiwan) and MAGE‐A3 (recombinant reverse chimeric antibody 21B4rc antibody, dilution 1:5000; CT Atlantic, Schlieren, Switzerland) on the Bond Max System (Leica, Mannheim, Germany). To ensure specificity, controls were included in all staining runs.
The percentage of positive cells (PP) was analyzed independently by two different authors (M.R. and D.V.), who were both blinded for the pathoclinical and outcome data, by manual counting of cytoplasmic stained tumor cells and all tumor cells of a tissue core, respectively. PP for multiple cores from each patient was averaged and rounded to the nearest whole number. Patient‐level averages were used in the analysis.
Statistics
Descriptive statistics were used. Statistical differences among baseline characteristics were assessed using analysis of variance (ANOVA) and chi‐square tests. The cutoff point between positivity and negativity for the different CTAs was defined by receiver operator characteristics (ROC). The relationship between the CTA expression and the TNM classification, the UICC staging, the tumor grading, the presence of lymphatic vessel, blood vessel or perineural invasion, the presence of lymph node metastasis, extracapsular spread of lymph node metastasis, local recurrence and distant metastasis was analyzed using cross tabulation and chi‐square test. Variables such as TNM, UICC, or tumor grading were used in its nondichotomized form. A Kaplan‐Meier survival analysis with calculation of log rank statistics was performed to compare recurrence‐free survival (RFS), DSS, and OS. Cox proportional hazard model was used to relate risk factors to RFS, DSS, and OS. SPSS statistics (IBM Corp; Armonk, New York, U.S.A.), version 20, was used for statistical analysis. P‐values <.05 were considered statistically significant.
RESULTS
Altogether, 167 patients with malignant salivary gland tumors were identified. Mean age of these patients was 57.2 ± 18.9 years (mean ± standard deviation, range 8–95 years). Eighty‐three patients were female (49.7%) and 84 were male (50.3%). Tumors were in the parotid gland in 118 cases (70.6%), in the submandibular gland in 18 cases (10.8%), in the sublingual gland in one case (0.6%), and in other/accessory salivary glands in 30 patients (18.0%). Due to missing data and/or inadequate tissue, 10 patients (6.0%) with malignant tumors of the salivary glands (7 with ACC, 2 with AcCC, and 1 with MEC) had to be excluded from further analysis. Mean follow‐up was 68.9 months (95% CI 60.2–77.7 months, range 0–271 months).
The tumors of the remaining 157 patients (94.0%) had mean and median percentage of stained cells as shown in Table 1. ROC analysis was performed to assess the median's quality to serve as a “cutoff value”, distinguishing between “positivity” and “negativity” for the different CTAs. Since the median of the percentage of stained cells was 0 and results were rounded to whole numbers, the “cutoff value” was set to ≥1% and any specific staining was considered to be significant. The expression of NY‐ESO1, NY‐BR1, MAGE‐A1, MAGE‐C2/CT10, MAGE‐A4 (Fig. 1) and MAGE‐C1/CT7 in relation to the different tumor entities is depicted in Table 2. While MAGE‐C2/CT10 and MAGE‐A4 were expressed in a relevant fraction of 20% to 40% of the analyzed salivary gland tumors, the prevalence was about half as much in NY‐ESO1 and MAGE‐A3 and only minimal in NY‐BR1, MAGE‐A1, and MAGE‐C1/CT7.
Table 1.
The Different CTA and the Fraction of Stained Cells in Salivary Gland Carcinomas.
| Stained cells (%) | ||
|---|---|---|
| Mean ± SD | Median (min–max) | |
| NY‐ESO1 | 0.54 ± 3.25 | 0 (0–37) |
| NY‐BR1 | 1.33 ± 9.81 | 0 (0–87) |
| MAGE A3 | 7.22 ± 22.26 | 0 (0–99) |
| MAGE A1 | 1.80 ± 10.89 | 0 (0–97) |
| MAGE C2/CT10 | 4.90 ± 12.83 | 0 (0–84) |
| MAGE A4 | 3.84 ± 11.92 | 0 (0–92) |
| MAGE C1/CT7 | 1.28 ± 8.84 | 0 (0–86) |
CTA = cancer testis antigen; max = maximum; min = minimum; SD = standard deviation.
Figure 1.
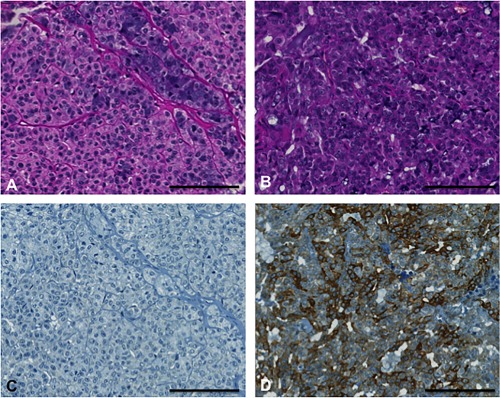
Hematoxylin and eosin stains (A and B) and MAGE A4 immunohistochemical stains (C and D) of two different acinic cell carcinomas. The left one demonstrates MAGE A4 negativity and the right one positivity. Scale bar 100 μm.
Table 2.
CTA Expression and the Different Entities of Salivary Gland Carcinomas.
| NY‐ESO1 | NY‐BR1 | MAGE A3 | MAGE A1 | MAGE C2/CT10 | MAGE A4 | MAGE C1/CT7 | |
|---|---|---|---|---|---|---|---|
| Acinic cell carcinoma, AcCC (n = 26) | 2 (7.7%) | 2 (7.7%) | 3 (10.7%) | 1 (3.6%) | 9 (32.1%) | 14 (50.0%) | 0 |
| Mucoepidermoid carcinoma, MEC (n = 35) | 9 (25.7%) | 0 | 4 (12.9%) | 1 (2.9%) | 11 (32.4%) | 9 (25.7%) | 2 (5.7%) |
| Adenoid cystic carcinoma, ACC (n = 29) | 1 (3.5%) | 1 (3.5%) | 5 (17.3%) | 1 (3.5%) | 7 (24.1%) | 3 (10.3%) | 0 |
| Polymorphous low‐grade adenocarcinoma (n = 29) | 0 | 0 | 0 | 0 | 2 (28.6%) | 2 (28.6%) | 0 |
| Epithelial‐myoepithelial carcinoma (n = 11) | 1 (9.1%) | 0 | 1 (9.1%) | 0 | 5 (45.5%) | 3 (27.2%) | 0 |
| Basal cell adenocarcinoma (n = 3) | 1 (33.3%) | 0 | 0 | 0 | 1 (33.3%) | 1 (33.3%) | 0 |
| Cystadenocarcinoma (n = 1) | 0 | 0 | 0 | 0 | 1 (100.0%) | 1 (100.0%) | 0 |
| Oncocytic carcinoma (n = 2) | 1 (50.0%) | 0 | 0 | 0 | 0 | 1 (50.0%) | 0 |
| Salivary duct carcinoma (n = 10) | 2 (20.0%) | 0 | 2 (20.0%) | 0 | 5 (50.0%) | 1 (10.0%) | 1 (10.0%) |
| Adenocarcinoma NOS (n = 12) | 1 (8.3%) | 0 | 1 (8.3%) | 0 | 2 (16.7%) | 5 (41.7%) | 1 (8.3%) |
| Myoepithelial carcinoma (n = 2) | 0 | 0 | 1 (50.0%) | 1 (50.0%) | 0 | 0 | 0 |
| Carcinoma ex pleomorphic adenoma (n = 10) | 2 (20.0%) | 0 | 1 (10.0%) | 0 | 3 (30.0%) | 1 (10.0%) | 1 (10.0%) |
| Carcinomsarcoma (n = 1) | 0 | 0 | 0 | 0 | 0 | 0 | 0 |
| Squamous cell carcinoma (n = 2) | 0 | 0 | 1 (50.0%) | 1 (50.0%) | 0 | 0 | 0 |
| Small cell carcinoma (n = 2) | 0 | 0 | 1 (50.0%) | 0 | 1 (50.0%) | 0 | 0 |
| Large cell carcinoma (n = 1) | 0 | 0 | 0 | 0 | 0 | 0 | 1 (100.0%) |
| Lymphoepithelial carcinoma (n = 1) | 0 | 0 | 0 | 0 | 0 | 0 | 0 |
CTA expression in salivary gland tissue was defined as ≥ 1% of the cells with immunolabeling.
CTA = cancer testis antigen.
The correlation of baseline characteristics and pathological data (Table 3) of malignant salivary gland neoplasms with CTA expression revealed significant relationships with tumor grading for MAGE‐A1 and –A4 (Table 4). While positivity for MAGE‐A4 was associated with a lower tumor grading (P = .017), expression of MAGE‐A1 was present in tumors with high‐grade histology (P = .025). Furthermore, the rate of distant metastasis was significantly higher in patients with negativity for MAGE‐A4, compared with MAGE‐A4 positive tumors (P = .003). For both CTAs (MAGE‐A1 and –A4), no further correlations with pathological data or baseline characteristics were found, as well as for the other CTAs.
Table 3.
Pathological Baseline Characteristics of Patients with Malignant Salivary Gland Tumors (n = 157).
| Pathological characteristic | Number of patients (%) |
|---|---|
| T1 | 34 (21.6%) |
| T2 | 40 (25.5%) |
| T3 | 40 (25.5%) |
| T4a | 20 (12.7%) |
| T4b | 2 (1.3%) |
| Tx | 21 (13.4%) |
| N0 | 64 (40.8%) |
| N1 | 6 (3.8%) |
| N2a | 8 (5.1%) |
| N2b | 27 (17.2%) |
| N2c | 0 |
| N3 | 0 |
| Nx | 52 (33.1%) |
| ECS | 21 (13.4%) |
| M1 | 33 (21.0%) |
| G1 | 61 (38.8%) |
| G2 | 32 (20.4%) |
| G3 | 64 (40.8%) |
| Pn1 | 77 (49.0%) |
| L1 | 41 (26.1%) |
| V1 | 18 (11.5%) |
ECS = extracapsular spread (of lymph node metastasis); G = histological grading; L = lymphatic vessel invasion; M= distant metastasis; N = lymph node metastasis; n/a = not available; Pn = perineural invasion; T = T‐classification; V = blood vessel invasion.
Table 4.
CTA Expression Versus Pathological Baseline Parameters (P‐values).
| NY‐ESO1 | NY‐BR1 | MAGE A3 | MAGE A1 | MAGE C2/CT10 | MAGE A4 | MAGE C1/CT7 | |
|---|---|---|---|---|---|---|---|
| T | .721 | .504 | .587 | .448 | .552 | .396 | .272 |
| G | .706 | .432 | .906 | .025a | 1.000 | .017a | .087 |
| Pn | .474 | 1.000 | .638 | .697 | .394 | .147 | 1.000 |
| L | .786 | .167 | .596 | .112 | .700 | .839 | 1.000 |
| V | .473 | .308 | .473 | 1.000 | 1.000 | .159 | .141 |
| N | .558 | .560 | .559 | 1.000 | .838 | .378 | .078 |
| ECS | .398 | .488 | .607 | .488 | 1.000 | 1.000 | 1.000 |
| M | .376 | .112 | .572 | 1.000 | .094 | .003a | .344 |
*Statistical significance P < .05 (Fisher's Exact and Chi‐Square Test).
ECS = extracapsular spread (of lymph node metastasis); G = histological grading; L = lymphatic vessel invasion; M = distant metastasis; N = lymph node metastasis; Pn = perineural invasion; T = T‐classification; V = blood vessel invasion.
Overall mean estimated RFS was 121.2 months (95% CI 105.5–137.0 months), DSS 225.7 months (95% CI 208.5–242.9 months), and OS 174.0 months (95% CI 152.4–195.5 months). Both UICC stage and tumor grading had a highly significant impact on RFS (Fig. 2A, 2B), DSS (Fig. 3A, 3B), and OS (Fig. 4A, 4B). In line with the findings for MAGE‐A4 stated above, patients with MAGE‐A4 expression showed a significantly better RFS (P = .003, Fig. 5), DSS (P = .046, Fig. 6), and OS (P = .028, Fig. 7). Subgroup analysis among the different tumor entities could not attribute these findings to certain tumor types or find an overrepresentation of certain tumor types in the fraction of MAGE‐A4 positive or negative tumors. Evaluation of RFS, DSS, and OS separately for each different tumor type did not reveal statistically significant results. Cox proportional hazard regression analysis identified UICC stage as an independent risk factor for RFS, DSS, and OS, hazard radio (HR) 2.246, (95% CI 1.554–3.246), P < .001 for RFS; HR 3.273 (95% CI 1.362–7.868), P = .008 for DSS; HR 1.706 (95% CI 1.249–2.331), P = .001 for OS). Tumor grading and MAGE A4 status were not independent from each other (Table 5).
Figure 2.
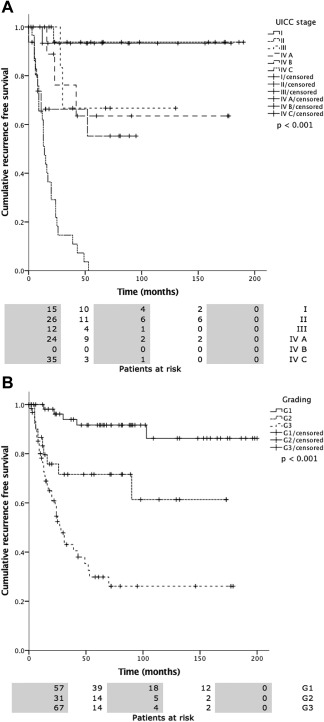
2A, 2B. Recurrence free survival (RFS) versus UICC stage (a) and tumor grading (b). Statistical analysis both revealed statistically significant differences (P < .0001).
Figure 3.
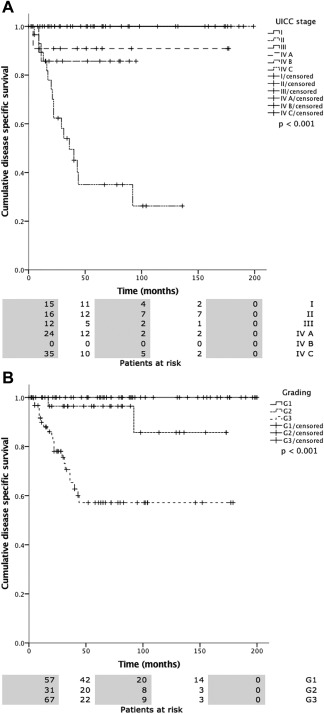
3A, 3B. Disease specific survival (DSS) versus UICC stage (a) and tumor grading (b). Statistical analysis both revealed statistically significant differences (P < .0001).
Figure 4.
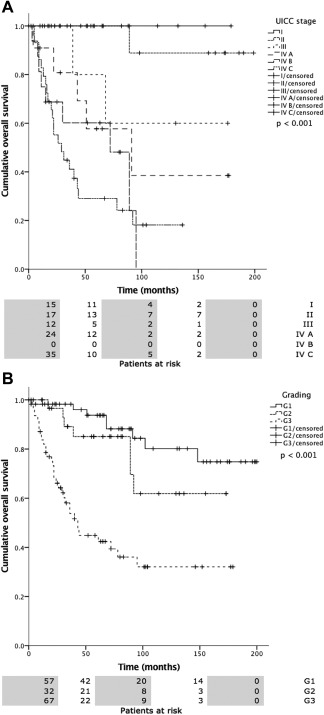
4A, 4B. Overall survival (OS) versus UICC stage (a) and tumor grading (b). Statistical analysis both revealed statistically significant differences (P < .0001).
Figure 5.
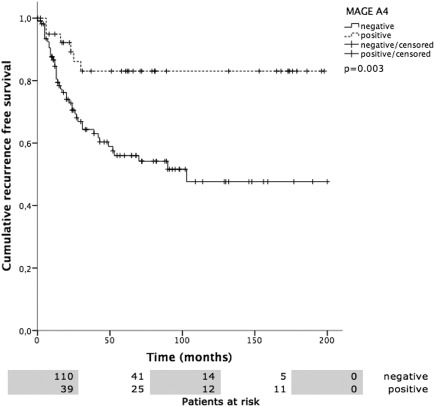
Recurrence free survival (RFS) versus MAGE‐A4 positivity. Patients with MAGE‐A4 positivity showed a mean RFS of 167.5 ± 11.4 months, MAGE‐A4 negative patients 112.2 ± 10.0 months (P = .003).
Figure 6.
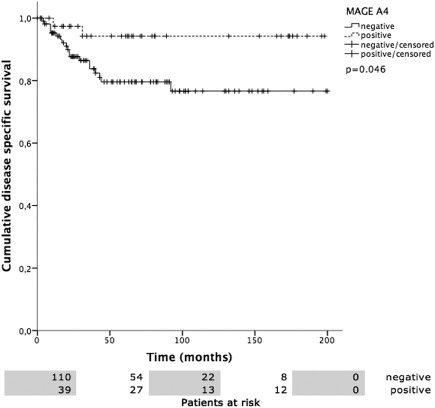
MAGE‐A4 positivity versus disease specific survival (DSS). DSS was 187.8 ± 7.0 months in MAGE‐A4 positive and 160.8 ± 8.1 months in MAGE‐A4 negative patients (P = .046).
Figure 7.
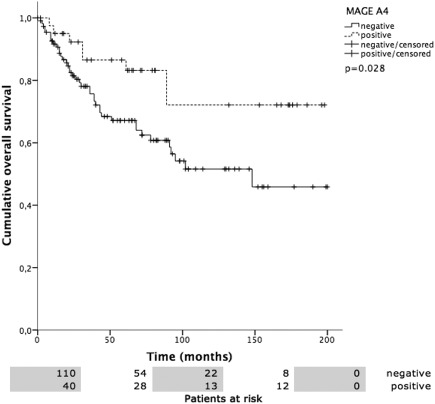
MAGE‐A4 versus overall survival (OS). OS was 157.5 ± 12.6 months in MAGE‐A4 positive patients compared to 121.4 ± 9.3 months in negative patients (P = .028).
Table 5.
Cox Proportional Hazard Regression Analysis for RFS, DSS, and OS in Relation to UICC Stage, Tumor Grading and MAGE A4 Status.
| Covariate | HR (95% CI) | P‐value | |
|---|---|---|---|
| RFS | UICC | 2.246 (1.554–3.246) | <.001 |
| G | 1.074 (0.567–2.036) | .827 | |
| MAGE A4 | 0.867 (0.346–2.175) | .761 | |
| DSS | UICC | 3.273 (1.362–7.868) | .008 |
| G | 2.964 (0.663–13.252) | .155 | |
| MAGE A4 | 1.424 (0.290–6.988) | .663 | |
| OS | UICC | 1.706 (1.249–2.331) | .001 |
| G | 1.570 (0.834–2.955) | .162 | |
| MAGE A4 | 1.055 (0.403–2.758) | .914 |
P‐value <.05 considered significant.
CI = confidence interval; DSS = disease specific survival; G = tumor grading; HR = hazard ratio; MAGE A4 = MAGE A4 status; OS = overall survival; RFS = recurrence free survival; UICC = UICC staging.
Expression of MAGE‐C1 and MAGE‐A1 had an inverse effect on survival, resulting in a significantly worse OS (P = .003) and RFS (P = .023), respectively. The low number of MAGE‐A1 and MAGE–C1 positive tumors made subgroup analysis nonfeasible. There were no further significant correlations of CTA expression with outcome parameters.
DISCUSSION
To our knowledge, this is the first study analyzing the value of CTAs in a large number of salivary gland carcinomas and the only study correlating CTAs expression with pathological data and outcome parameters. We report the following major findings:
The prevalence of CTA expression in malignant salivary gland tumors is low to moderate and ranges from 0% to 40%.
Expression of MAGE‐A4 is associated with low‐grade tumor histology and a favorable outcome. The negative prognostic value of MAGE‐C1 and MAGE‐A1 has to be interpreted carefully since both biomarkers show low expression rates.
CTAs were reported to be highly specific for malignant tumors and silent in benign neoplasms and normal tissue.2, 3, 9, 25 Therefore, authors suggested that CTAs might be useful in differential diagnosis of salivary gland tumors, eg, to distinguish ACC from pleomorphic adenoma (PA).2 In 58 patients whose tissue was analyzed by Park et al.,2 MAGE‐A4 expression was detected in 94% of the patients with ACC and in only 3% of the patients with PA.2 Liu et al.3 observed a prevalence of 50% and 61% for MAGE‐A1 and MAGE‐A3 expression, respectively, in their 18 patients with salivary gland carcinomas and no presence of CTAs in the 19 patients with nonmalignant salivary gland tissue. The group of Nagel et al.,4 on the other hand, observed low overall expression rates (12.5% for MAGE 1 and 8.75% for MAGE 3, respectively, in malignant salivary gland tumors) and therefore concluded the usefulness of CTAs as diagnostic markers in salivary gland tumors to be low. Based on our data, we agree with the latter author's statement due to low to moderate expression rates.
CTA and especially overexpression of the MAGE A family is generally associated with advanced tumor stage, high‐grade histology, and reduced survival.1, 5, 7, 26, 27, 28, 29 It is hypothesized that MAGE alters p53 function and inhibits DNA‐damage induced apoptosis, resulting in tumor progression, treatment resistance, and worse outcome.1, 7, 27 However, in the context of salivary gland carcinomas, there is a lack of studies considering the correlation of CTA expression with pathological and outcome data. Only Liu et al.3 stated a potential relationship of MAGE‐A1 and MAGE‐A3 with poor differentiation and metastasis. In head and neck squamous cell carcinoma, overexpression of MAGE‐A3 and MAGE‐A4 was associated with poor survival, while MAGE‐A1, MAGE‐C1/CT7, MAGE‐C2/CT10, and NY‐ESO1 did not show any correlation with outcome.7, 27, 28 A prognostic relevance could be attributed to three of the CTA, which were analyzed in our study: MAGE‐A1, MAGE‐C1, and MAGE‐A4. The negative predictive role of MAGE‐A1 and MAGE‐C1 on survival, however, must be interpreted carefully since both CTA show low expression rates of 4.5% and 3.8%, respectively, in malignant salivary gland tumors. On the other hand, MAGE‐A4 is expressed more frequently in better differentiated tumors. Subsequently, it is a positive prognostic factor, which is (independently of the tumor entity) associated with a favorable RFS, DSS, and OS. These findings, which are contrary to results of the groups mentioned above, could be explained by the results of Peikert et al.30 and Nagao et al.31 These authors analyzed the role of MAGE‐A4 in non‐small cell lung cancer and hypothesized that it could function as tumor suppressor protein and induce apoptosis of tumor cells via the caspase pathway and p53‐dependent and p53‐independent mechanisms. It was furthermore observed that MAGE‐A4 is able to inactivate the oncoprotein gankyrin,31 which has negative prognostic implications in tumors such as hepatocellular carcinoma, ovarian cancer, non‐small cell lung cancer and sarcoma.31, 32, 33, 34 Since our work did not include an analysis of the molecular pathways associated with CTA expression and the mechanisms stated above were not studied in salivary gland carcinomas, a comprehensive explanation of our findings is not possible at this point. Future studies should clarify the role of CTAs in salivary gland carcinomas, especially the function of MAGE‐A1, MAGE‐C1, and MAGE‐A4.
The value of cancer testis antigens as diagnostic markers in salivary gland carcinomas is limited due to overall low to moderate expression rates. MAGE‐A4, on the other hand, figures as a positive prognostic biomarker, which is associated with low‐grade tumor histology, a low rate of distant metastasis and a favorable survival, and could improve a further, patient‐tailored treatment according to the predicted patterns of aggressiveness. The molecular mechanisms of this surprising result, however, remain to be elucidated in detail and evaluated by further studies.
We would like to express our gratitude to Dr. Claudia Sandra Weber, MD, who contributed significantly to build up the clinical database of patients with salivary gland carcinomas.
BIBLIOGRAPHY
- 1. Li X, Hughes SC, Wevrick R. Evaluation of melanoma antigen (MAGE) gene expression in human cancers using The Cancer Genome Atlas. Cancer Genet 2015;208:25–34. [DOI] [PubMed] [Google Scholar]
- 2. Park JH, Do NY, Han SI, Lim SC. Usefulness of the melanoma antigen gene (MAGE) in making the differential diagnosis between pleomorphic adenoma and adenoid cystic carcinoma. J Otolaryngol Head Neck Surg 2012;41:20–29. [PubMed] [Google Scholar]
- 3. Liu J, Wang G, Okutomi T, Chen Z. Expression of MAGE‐A1 and MAGE‐A3 genes in human salivary gland carcinomas. Chin Med J (Engl) 2003;116:897–900. [PubMed] [Google Scholar]
- 4. Nagel H, Laskawi R, Eiffert H, Schlott T. Analysis of the tumour suppressor genes, FHIT and WT‐1, and the tumour rejection genes, BAGE, GAGE‐1/2, HAGE, MAGE‐1, and MAGE‐3, in benign and malignant neoplasms of the salivary glands. Mol Pathol 2003;56:226–231. [DOI] [PMC free article] [PubMed] [Google Scholar]
- 5. Bhan S, Chuang A, Negi SS, Glazer CA, Califano JA. MAGEA4 induces growth in normal oral keratinocytes by inhibiting growth arrest and apoptosis. Oncol Rep 2012;28:1498–1502. [DOI] [PubMed] [Google Scholar]
- 6. Zamunér FT, Karia BT, de Oliveira CZ, Santos CR, Carvalho AL, Vettore AL. A comprehensive expression analysis of cancer testis antigens in head and neck squamous cell carcinoma revels MAGEA3/6 as a marker for recurrence. Mol Cancer Ther 2015;14:828–834. [DOI] [PubMed] [Google Scholar]
- 7. Laban S, Atanackovic D, Luetkens T, et al. Simultaneous cytoplasmic and nuclear protein expression of melanoma antigen‐A family and NY‐ESO‐1 cancer‐testis antigens represents an independent marker for poor survival in head and neck cancer. Int J Cancer 2014;135:1142–1152. [DOI] [PubMed] [Google Scholar]
- 8. Montoro JR, Mamede RC, Neder Serafini L, et al. Expression of cancer‐testis antigens MAGE‐A4 and MAGE‐C1 in oral squamous cell carcinoma. Head Neck 2012;34:1123–1128. [DOI] [PubMed] [Google Scholar]
- 9. Zhou B, Li T, Liu Y, Zhu N. Promoting effects on the proliferation and metastasis of ACC tumor cell with XAGE‐1b overexpression. Oncol Rep 2013;30:2323–2335. [DOI] [PubMed] [Google Scholar]
- 10. Triantafyllou A, Hunt JL, Devaney KO, Ferlito A. A perspective of comparative salivary and breast pathology. Part I: microstructural aspects, adaptations and cellular events. Eur Arch Otorhinolaryngol 2014;271:647–663. [DOI] [PubMed] [Google Scholar]
- 11. Brandwein MS, Ferlito A, Bradley PJ, Hille JJ, Rinaldo A. Diagnosis and classification of salivary neoplasms: pathologic challenges and relevance to clinical outcomes. Acta Otolaryngol 2002;122:758–764. [PubMed] [Google Scholar]
- 12. Szanto PA, Luna MA, Tortoledo ME, White RA. Histologic grading of adenoid cystic carcinoma of the salivary glands. Cancer 1984;54:1062–1069. [DOI] [PubMed] [Google Scholar]
- 13. Bode PK, Thielken A, Brandt S, et al. Cancer testis antigen expression in testicular germ cell tumorigenesis. Mod Pathol 2014;27:899–905. [DOI] [PubMed] [Google Scholar]
- 14. Zimmermann AK, Imig J, Klar A, et al. Expression of MAGE‐C1/CT7 and selected cancer/testis antigens in ovarian borderline tumours and primary and recurrent ovarian carcinomas. Virchows Arch 2013;462:565–574. [DOI] [PubMed] [Google Scholar]
- 15. Curioni‐Fontecedro A, Nuber N, Mihic‐Probst D et al. Expression of MAGE‐C1/CT7 and MAGE‐C2/CT10 predicts lymph node metastasis in melanoma patients. PLoS One 2011;6:e21418. [DOI] [PMC free article] [PubMed] [Google Scholar]
- 16. Nuber N, Curioni‐Fontecedro A, Matter C, et al. Fine analysis of spontaneous MAGE‐C1/CT7‐specific immunity in melanoma patients. Proc Natl Acad Sci U S A 2010;107:15187–15192. [DOI] [PMC free article] [PubMed] [Google Scholar]
- 17. Riener MO, Wild PJ, Soll C, et al. Frequent expression of the novel cancer testis antigen MAGE‐C2/CT‐10 in hepatocellular carcinoma. Int J Cancer 2009;124:352–357. [DOI] [PubMed] [Google Scholar]
- 18. Theurillat JP, Ingold F, Frei C, et al. NY‐ESO‐1 protein expression in primary breast carcinoma and metastases: correlation with CD8+ T‐cell and CD79a+ plasmacytic/B‐cell infiltration. Int J Cancer 2007;120:2411–2417. [DOI] [PubMed] [Google Scholar]
- 19. Theurillat JP, Zürrer‐Härdi U, Varga Z, et al. Distinct expression patterns of the immunogenic differentiation antigen NY‐BR‐1 in normal breast, testis and their malignant counterparts. Int J Cancer 2008;122:1585–1591. [DOI] [PubMed] [Google Scholar]
- 20. Tinguely M, Jenni B, Knights A, et al. MAGE‐C1/CT‐7 expression in plasma cell myeloma: sub‐cellular localization impacts on clinical outcome. Cancer Sci 2008;99:720–725. [DOI] [PMC free article] [PubMed] [Google Scholar]
- 21. Varga Z, Theurillat JP, Filonenko V, et al. Preferential nuclear and cytoplasmic NY‐BR‐1 protein expression in primary breast cancer and lymph node metastases. Clin Cancer Res 2006;12:2745–2751. [DOI] [PubMed] [Google Scholar]
- 22. von Boehmer L, Keller L, Mortezavi A, et al. MAGE‐C2/CT10 protein expression is an independent predictor of recurrence in prostate cancer. PLoS One 2011;6:e21366. [DOI] [PMC free article] [PubMed] [Google Scholar]
- 23. Rössle M, Cathomas G, Bonapace L, et al. Interleukin‐33 expression indicates a favorable prognosis in malignant salivary gland tumors. Int J Surg Pathol 2016;24:394–400. [DOI] [PubMed] [Google Scholar]
- 24. Storz‐Schweizer M, Moch H. Tissue microarrays and biomarker validation In: L C, DY Z, eds. Molecular Genetic Pathology. Bern: Humana Press, 2008:133–140. [Google Scholar]
- 25. Piotti KC, Scognamiglio T, Chiu R, Chen YT. Expression of cancer/testis (CT) antigens in squamous cell carcinoma of the head and neck: evaluation as markers of squamous dysplasia. Pathol Res Pract 2013;209:721–726. [DOI] [PubMed] [Google Scholar]
- 26. Figueiredo DL, Mamede RC, Spagnoli GC, et al. High expression of cancer testis antigens MAGE‐A, MAGE‐C1/CT7, MAGE‐C2/CT10, NY‐ESO‐1, and gage in advanced squamous cell carcinoma of the larynx. Head Neck 2011;33:702–707. [DOI] [PubMed] [Google Scholar]
- 27. Cuffel C, Rivals JP, Zaugg Y, et al. Pattern and clinical significance of cancer‐testis gene expression in head and neck squamous cell carcinoma. Int J Cancer 2011;128:2625–2634. [DOI] [PubMed] [Google Scholar]
- 28. Ries J, Mollaoglu N, Vairaktaris E, Neukam FW, Nkenke E. Diagnostic and therapeutic relevance of NY‐ESO‐1 expression in oral squamous cell carcinoma. Anticancer Res 2009;29:5125–5130. [PubMed] [Google Scholar]
- 29. Pastorcic‐Grgic M, Sarcevic B, Dosen D, Juretic A, Spagnoli GC, Grgic M. Prognostic value of MAGE‐A and NY‐ESO‐1 expression in pharyngeal cancer. Head Neck 2010;32:1178–1184. [DOI] [PubMed] [Google Scholar]
- 30. Peikert T, Specks U, Farver C, Erzurum SC, Comhair SA. Melanoma antigen A4 is expressed in non‐small cell lung cancers and promotes apoptosis. Cancer Res 2006;66:4693–4700. [DOI] [PubMed] [Google Scholar]
- 31. Nagao T, Higashitsuji H, Nonoguchi K, et al. MAGE‐A4 interacts with the liver oncoprotein gankyrin and suppresses its tumorigenic activity. J Biol Chem 2003;278:10668–10674. [DOI] [PubMed] [Google Scholar]
- 32. Wang WP, Yan XL, Li WM, et al. Clinicopathologic features and prognostic implications of Gankyrin protein expression in non‐small cell lung cancer. Pathol Res Pract 2015;211:939–947. [DOI] [PubMed] [Google Scholar]
- 33. Chen J, Bai M, Ning C, et al. Gankyrin facilitates follicle‐stimulating hormone‐driven ovarian cancer cell proliferation through the PI3K/AKT/HIF‐1α/cyclin D1 pathway. Oncogene 2016;35:2506–2517. [DOI] [PubMed] [Google Scholar]
- 34. Hwang JA, Yang HM, Hong DP, et al. Gankyrin is a predictive and oncogenic factor in well‐differentiated and dedifferentiated liposarcoma. Oncotarget 2014;5:9065–9078. [DOI] [PMC free article] [PubMed] [Google Scholar]