

Abstract
Background
Knowledge of children’s foot shape is essential for podiatric healthcare and footwear design. Differences in foot shapes relative to sex and age were demonstrated among white children; however, no study has examined the foot characteristics of Asian children according to sex and age. This study aimed to analyze the age- and sex-associated differences in foot measurements in Chinese children.
Material/Methods
We recruited 1240 boys and 1303 girls from China as participants for the present study. Foot dimensions were recorded by a video filming system, and 12 foot-shape measurements were acquired. One-way ANOVA was used to calculated the changes in measurements with age for boys and girls. Scores were analyzed as raw and normalized to foot length using the independent-samples t test.
Results
Most measurements increased significantly at 7–8 and 8–9 years for girls and 8–9 and 10–11 years for boys. Arch height, instep length, and heel width showed greatest increases for both sexes ages 7–12 years (P<0.05). Sex differences in measurements mainly occurred at 8, 9, and 11 years. When we analyzed the normalized measurements of the same age children, instep length, heel width, ball girth, and instep girth were significantly different between boys and girls (P<0.05).
Conclusions
Sex- and age-associated differences were identified in the foot morphology of the Chinese school-aged children in this study. These differences should be considered when making clinical decisions about normal foot development and manufacturing shoes for Chinese school children.
MeSH Keywords: Age Factors, Child, Foot, Growth
Background
The foot is a complex structure with 26 bones, 33 joints and related muscles, tendons, and ligaments. The complex structure contributes to the overall foot shape [1,2]. Human foot shape is associated with some intrinsic and extrinsic factors, such as age and sex [3–5], race [6], body weight [7,8] and shoe-wearing habits [9,10].
Foot shape changes with age from childhood to adolescence. Müller found that foot length increased from 13.1±0.8 cm at 1 year old to 24.4±1.5 cm at 13 years old; the foot width increased from 5.7±0.4 cm at 1 year old to 8.9±0.6 cm at the oldest [11]. Onodera found that 3–4-year-old children showed a high prevalence of low arches, while the longitudinal arch acquired an adult-like shape progressively among 4–5-year-old children [12].
Children’s feet also show differences between boys and girls in foot shape development. Waseda et al. found that a child’s foot length grows rapidly from age 6 years and nearly reached a plateau at 13 years in girls and 14 years in boys. The navicular height in boys increased from age 6 to 13 years. In girls, the navicular height increased from age 8 to 13. In boys, the arch height ratio (AHR (%)=navicular height×100/Foot length) was almost flat until age 11 years, but increased at age 11–13 years. In girls, the arch height ratio was almost flat until 10 years old, but increased at age 10–12 years [13].
Furthermore, there may be ethnic difference in foot shape. Hawes found that the East Asian’s forefoot is broader than that in their white counterparts [14]. Kouchi et al. found that Mongoloid populations have a wider foot compared to Caucasoid and Australian populations, and East Asian populations have a shorter foot length compared to Southeast Asians and Africans [15]. Sacco revealed anthropometric differences in foot width between German and Brazilian children [6]. A number of studies have investigated age- and sex-related differences in foot anthropometry in Spain [5], Germany [11], Japan [13] and Italy [16].
There is still scant published information on the anthropometric characteristics of Chinese children’s feet. Therefore, the present study collected three-dimensional data on feet and analyzed the differences between Chinese boys and girls.
Material and Methods
Participants
In this study, stratified sampling was used to select samples in 7 regions in China: North China, Southern China, East China, Central China, Southwest China, Northwest China, and Northeast China. In every region, at least 30 participants were chosen in each sex and age. A total of 1240 boys and 1303 girls (ages 7–12 years) from Chinse primary schools were recruited for the present study. Participants’ parents/guardians signed consent letters for their children before testing began. We excluded children with temporary injuries to the leg or foot deformities such as toe amputation and hallux valgus. The experiments were carried out in accordance with the guidelines of the Declaration of Helsinki and all experimental protocols were approved by the Regional Ethics Committee.
Procedures
Participants’ body heights and weights were measured in light clothes and barefoot. The body heights were determined with a stadiometer (Seca 213 portable stadiometer, Seca GmbH & CO. Kg, Hamburg, Germany). Body weights were measured using a digital weighing scale (Seca 770 electronic scale, Seca GmbH & Co. Kg, Hamburg, Germany). Three-dimensional foot shape data from the right foot were collected by a video filming system using 4 video cameras (9800, JVC Inc., Yokohama, Japan). The foot model used was developed by the Biomechanics Institute of Valencia in Spain [17–19]. The model has 8 anatomical reference points, which were marked with a black marking pen before filming. All of the reference points were marked manually by the same investigator (Figure 1). While filming, participants were required to stand still with weight distributed evenly on both feet. Four digital cameras were used to synchronously record the right foot for at least 5 s, with sample frequency set at 50 Hz. After filming, the video images were input into the Motion Analysis System (Ariel Dynamics, USA.) Coordinates with 8 reference points were built by the automatic digitization of the video image. The digitized data were then smoothed with a Butterworth filter at 6 Hz.
Figure 1.

The position of markers. 1 – front end of the longest toe; 2 – first metatarsal head; 3 – highest point of first metatarsal head; 4 – highest point of fifth metatarsal head; 5 – fifth metatarsal head; 6 – lowest point of the foot arch; 7 – point where the leg meets the foot; 8 – pterion (the most prominent point of the heel).
Then, 2 foot circumferences – ball girth (BG) and instep girth (IG) – were measured with a flexible tape to the nearest 1 mm by the same investigator who marked the reference points (Figure 2).
Figure 2.

a – Foot length; b – medial ball length; c – lateral ball length; d – instep length; e – ball width; f – heel width; g – height of the first metatarsal head; h – height of the fifth metatarsal head; i – arch height; j – instep height; x – ball girth; y – Instep girth.
Variables
Foot measurements (Figure 2) were obtained from the coordinates of the 8 reference points. Four length variables were acquired: foot length (FL), medial ball length (MBL), lateral ball length (LBL), and instep length (IL). Two width variables were acquired: ball width (BW) and heel width (HW). Four height variables were acquired: first metatarsal head height (M1H), fifth metatarsal head height (M5H), arch height (ArH), and instep height (IH) (Figure 2). Together with the 2 girth variables measured after filming, 12 foot dimension variables were assessed. This method was used to measure three-dimensional foot variables in previous studies [17,18]. High reliability of the measurements was found, with the interclass correlation coefficients ranging from 0.930 to 0.999 [17].
Statistical analysis
Data are shown as means and standard deviation. Statistical analysis was conducted using the SPSS 20.0 software package (SPSS Inc., Chicago, USA). Partial correlation analysis adjusted by age was conducted to determine the relationships between body height and foot length. A one-way ANOVA was used to calculated changes per year in foot dimensions for boys and for girls. When a significant main effect occurred, the Bonferroni post hoc test was used. Independent-samples t tests were used to compare absolute foot measurements and relative values (in%FL) between boys and girls of the same age. Cohen’s d was calculated to define the standardized difference between 2 means. Cohen’s d is interpreted as an extremely small effect being ≤0.2, a small effect being 0.2–0.5, a moderate effect being 0.5–0.8, and a large effect being ≥0.8 [17,19]. The statistical significance was set at P<0.05.
Results
Participants’ physical characteristics (Table 1)
Table 1.
The physical characteristics of the participants.
| Age (years) | Gender | Height (cm) | Weight (kg) | Foot length (mm) |
|---|---|---|---|---|
| 7 | Boys (n=276) | 126.3 (4.5) | 27.7 (4.6) | 195.1 (9.4) |
| Girls (n=283) | 125.0 (4.9) | 25.4 (3.8) | 190.2 (8.7) | |
| 8 | Boys (n=218) | 131.8 (5.9) | 30.8 (7.0) | 203.5 (12.4) |
| Girls (n=215) | 130.4 (5.7) | 28.3 (5.2) | 200.3 (11.0) | |
| 9 | Boys (n=187) | 138.9 (6.8) | 37.9 (10.5) | 214.9 (13.8) |
| Girls (n=183) | 138.2 (6.5) | 33.1 (7.1) | 210.7 (12.1) | |
| 10 | Boys (n=232) | 142.3 (6.5) | 37.7 (8.5) | 220.0 (12.1) |
| Girls (n=232) | 142.0 (7.1) | 35.9 (8.6) | 216.0 (11.9) | |
| 11 | Boys (n=176) | 150.2 (7.9) | 46.5 (11.1) | 233.3 (13.9) |
| Girls (n=190) | 150.8 (7.3) | 42.4 (9.0) | 226.0 (12.0) | |
| 12 | Boys (n=151) | 156.0 (8.1) | 51.4 (11.8) | 240.5 (13.2) |
| Girls (n=200) | 154.5 (5.9) | 47.9 (10.1) | 229.6 (9.4) | |
| Total | Boys (n=1240) | 139.2 (11.9) | 37.2 (11.9) | 215.2 (19.9) |
| Girls (n=1303) | 139.1 (12.3) | 34.8 (10.8) | 210.6 (17.9) |
Relationship between body height and foot length
The foot length was linearly associated with body height, as shown in Figure 3 and Figure 4 (r=0.792 for boys; r=0.747 for girls, P<0.001).
Figure 3.
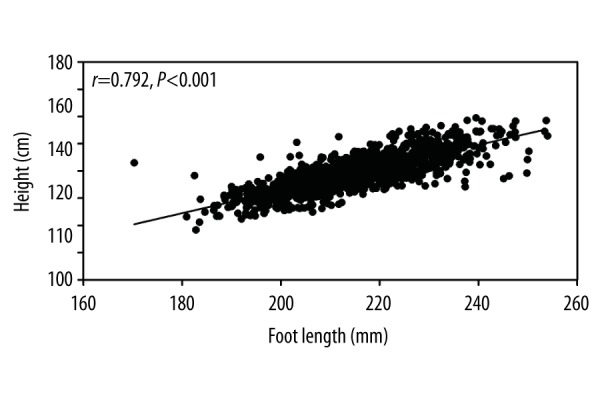
Relationship between standing height and foot length adjusted by age in boys.
Figure 4.
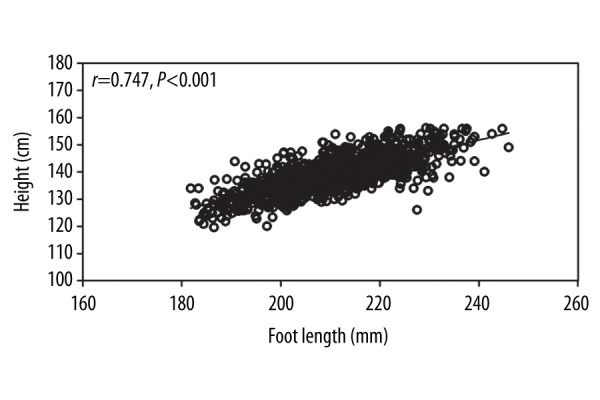
Relationship between standing height and foot length adjusted by age in girls.
Age differences in foot dimensions
Mean growth rates in foot length were 4.3% for boys and 3.9% for girls per year. For most foot measurements, the largest growth rate occurred at 7–8 and 8–9 years for girls and 8–9 and 10–11 years for boys, and the smallest growth rate occurred at 9–10 and 11–12 years in both girls and boys. Measurements indicating the largest mean increases were arch height, instep length, and heel width for both boys and girls (Table 2).
Table 2.
Percentage of change per year in boys and girls (%).
| Variables | 7–8 years | 8–9 years | 9–10 years | 10–11 years | 11–12 years | 7–12 years | ||||||
|---|---|---|---|---|---|---|---|---|---|---|---|---|
| Boys | Girls | Boys | Girls | Boys | Girls | Boys | Girls | Boys | Girls | Boys | Girls | |
| FL | 4.4*** | 5.3*** | 5.6*** | 5.2*** | 2.4*** | 2.6*** | 6.0*** | 4.6*** | 3.1*** | 1.6* | 23.3 | 20.7 |
| MBL | 4.7*** | 5.3*** | 6.0*** | 5.4*** | 2.1** | 2.3*** | 6.1*** | 4.1*** | 2.9*** | 1.7* | 23.5 | 20.3 |
| LBL | 5.4*** | 5.3*** | 5.1*** | 4.5*** | 2.5** | 2.8*** | 6.0*** | 4.1*** | 2.8*** | 1.4 | 23.7 | 19.4 |
| IL | 5.1*** | 6.0*** | 6.9*** | 5.0*** | 1.9 | 2.8*** | 6.9*** | 4.4*** | 4.7*** | 4.5*** | 28.0 | 24.8 |
| BW | 3.7*** | 3.5*** | 5.3*** | 5.0*** | 0.9 | 2.3** | 5.7*** | 4.3*** | 3.3*** | 2.4** | 20.2 | 18.8 |
| HW | 3.3** | 3.9*** | 6.0*** | 4.9*** | 0.8 | 3.4*** | 4.2*** | 0.6 | 9.1*** | 8.8*** | 25.6 | 23.4 |
| M1H | 3.4*** | 3.9*** | 4.3*** | 3.8*** | 0.7 | 2.5** | 4.8*** | 2.1* | 3.9*** | 3.1*** | 18.4 | 16.4 |
| M5H | 2.1 | 1.6 | 3.1* | 3.8** | −1.0 | 3.6** | 6.5*** | 3.0** | −0.5 | 1.5 | 10.5 | 14.3 |
| ArH | 4.3 | 9.9** | 3.3 | 2.5 | 4.8 | 4.8 | 3.8 | 2.3 | 12.6*** | 9.0* | 32.2 | 31.5 |
| IH | 4.3*** | 3.8*** | 4.6*** | 5.3*** | 2.1 | 1.4 | 5.1*** | 6.0*** | 1.8 | −1.6 | 19.1 | 15.6 |
| BG | 4.1*** | 4.1*** | 6.0*** | 4.9*** | 0.2 | 2.0** | 5.8*** | 4.0*** | 3.6*** | 3.2*** | 21.2 | 19.6 |
| IG | 4.8*** | 4.7*** | 6.1*** | 5.1*** | 1.3 | 2.3** | 6.4*** | 4.5*** | 3.6*** | 2.5*** | 24.2 | 20.5 |
P<0.05;
P<0.01;
P<0.001 show significant differences between consecutive years.
FL – foot length; MBL – medial ball length; LBL – lateral ball length; IL – instep length; BW – ball width; HW – heel width; M1H – height of the first metatarsal head; M5H – height of the fifth metatarsal head; ArH – arch height; IH – instep height; BG – ball girth; IG – instep girth.
Sex-associated differences in foot dimensions
Girls showed significantly smaller values across all absolute foot measurements compared to boys of the same age, except for the M5H at ages 10 and 12, and the ArH in ages 7–12, with medium or large effect sizes (0.5–1.4) (Figure 5). However, when we analyzed the normalized measurements regarding foot length, these differences decreased except for IL, BW, BG, and IG. In addition, the differences between boys and girls mainly occurred at 8, 9, and 11 years, with small or medium effect sizes (0.2–0.7) (Figure 6).
Figure 5.

Differences between boys and girls in absolute foot measurements. * P<0.05. (A) Differences between boys and girls in absolute length-related variables. (A1) Foot length; (A2) medial ball length; (A3) lateral ball length; (A4) instep length. (B) Differences between boys and girls in absolute width-related variables and girth-related variables. (B1) Ball width; (B2) heel width; (B3) ball girth; (B4) instep girth. (C) Differences between boys and girls in absolute height-related variables. (C1) Height of first metatarsal; (C2) height of fifth metatarsal; (C3) arch height; (C4) instep height.
Figure 6.

Differences between boys and girls in normalized foot measurements. * P<0.05. (A) Differences between boys and girls in normalized length-related variables. (A1) Normalized medial ball length; (A2) normalized lateral ball length; (A3) normalized instep length. (B) Differences between boys and girls in normalized width-related variables and girth-related variables. (B1) normalized ball width; (B2) normalized heel width; (B3) normalized ball girth; (B4) normalized instep girth. (C) Differences between boys and girls in normalized height-related variables. (C1) normalized height of first metatarsal; (C2) normalized height of fifth metatarsal; (C3) normalized arch height; (C4) normalized instep height.
No significant differences between boys and girls were found in absolute arch heights or arch heights normalized by foot length in children ages 7–12 years.
Discussion
The present study is the first large-scale study to demonstrate that three-dimensional foot shape varies among Chinese children according to age and sex. Within the age range of 7–12 years, the foot length was linearly associated with the standing height of boys and girls. Foot dimensions increased at various rates per year across all variables in both sexes. Girls showed significantly smaller values in foot measurements than boys of the same age.
Relationship between body height and foot length
In our study, foot length was linearly associated with standing height (r=0.792 for boys; r=0.747 for girls). The results of our study are consistent with the study by Delgado, who reported that 6–12-year-old boys had greater R-values related to foot length and standing height than their female counterparts (r=0.905 for boys; r=0.841 for girls) [5]. However, age adjustment for correlation analysis between body height and foot length were not mentioned in Delgado’s study, and this might have influenced their final results.
Age differences in foot dimensions
The increases of foot dimensions were progressive among Chinese children because the most significant differences usually occurred between consecutive ages in the range of 7–12 years in our study. Mean growth rates in foot length were 4.3% for boys and 3.9% for girls per year in our study. The results agreed with the findings of Delgado et al., in which the mean increase per year in foot length were 4.2% for boys and 3.8% for girls [5]. In our study, the greatest growth rates of most foot measurements were at 7–8 and 8–9 years for girls and at 8–9 and 10–11 years for boys. Thus, the growth rates peak occurred earlier in girls than in boys. Similarly, Delgado et al. showed that in Spanish children ages 6–12 years, the greatest growth rate for all variables was at 7–9 years in girls and 10–11 years in boys, showing that the growth rate peak of foot morphologies in Spanish girls was also earlier than in boys [5]. All foot measurements developed slower at ages 9–10 years and 11–12 years in both sexes. The results agree with those reported in previous studies showing that the most dynamic period in foot development is at 6 years old and the foot growth stabilizes at 12 years old [21,22]. Our results were different in some respects to the age difference study among Spanish children, in which the smallest differences for all foot measurements occurred at 10–11 years in both sexes, unlike that of our study [5]. The inconsistencies between that study and our research may be attributed to different measurement methods, sample size, or ethnic differences (Figure 7). Children’s foot length growth curves among Spanish, German, Japanese, and Chinese are shown in Figure 7. Similar foot length development was found among the 4 different populations. European children seemed to have a longer foot length than their Asian counterparts. Although Kouchi et al. found that East Asian adults have a smaller foot length than Africans and whites [15], the data comparing children’s foot shapes across different ethnic groups are limited, and should be investigated in a further study. In 7–12-year-old Chinese boys and girls, arch height rapidly increased with age, although it showed fewer sex-associated differences. This result suggests that the prevalence of flat foot decreases with increasing age [11,23,24].
Figure 7.

Comparison of foot length among 4 ethnic groups. 1 Data reported by Delgado-Abellán (2014) [5]; 2 Data reported by Barisch-Fritz (2016) [10]; 3 Data reported by Waseda (2014) [12].
Sex-associated differences in foot dimensions
The absolute foot measurements of girls were smaller than among boys of the same age, except for the M5H at ages 10 and 12, and the ArH at ages 7–12 (Table 3). The results were line with the findings of Cheng et al., which indicated that boys’ feet grew faster than girls’ feet starting at 3 years old [25]. Delgado et al. also stated that boys have higher values than girls of the same age for most foot absolute measurements in Spanish school children ages 6–12 years old. They found that the foot growth gaps between boys and girls occur at ages 8 and 10 years, respectively [5]. In contrast to the present study, they reported that there were no significant sex-associated differences in foot length. However, when relative measurements (the absolute foot variables divided by foot length) were compared again between boys and girls, the significance of sex-associated differences in most foot measurements decreased. The different measuring methods and sample sizes may explain the differences between these 2 different populations, rather than the race factor alone. Significant sex-associated differences in foot dimensions appeared for Chinese children ages 7–12 years in our study, which is supported by previous studies. Mickle et al. showed that preschool boys’ foot lengths and girths were larger than among girls of the same age [26]. Chen et al. found that boys’ foot measurements were larger than girls’ in 11 out of the 15 variables studied, including foot lengths, breadths, heights, and girths, but not for navicular height. And similar to our results, there were also no sex-associated differences in arch height in their study [27]. In addition, the sex-associated differences in foot dimensions also existed in adults. Hong et al. collected three-dimensional foot data of Chinese adults with an average age of 20.2 years, and demonstrated significant sex-associated differences in all variables except foot length [17]. Saghazadeh et al. found that the feet of men and women (ages 20–25 years) were significantly different in foot length, width, height, and girth, which is consistent with our findings [16].
Table 3.
Gender differences in the absolute measures of the same age for boys and girls, from 7 to 12 years old. Values are means (SD).
| FL | MBL | LBL | IL | BW | HW | H–J (5) | H–K (7) | ArH | IH | BG | IG | ||
|---|---|---|---|---|---|---|---|---|---|---|---|---|---|
| 7 years | Boys | 195.0 (9.4) | 144.0 (7.4) | 124.3 (6.8) | 78.9 (4.9) | 78.6 (4.5) | 45.0 (3.5) | 27.6 (1.5) | 19.1 (1.6) | 11.5 (2.7) | 62.2 (4.3) | 189.8 (10.5) | 254.1 (13.5) |
| Girls | 190.2 (8.7) | 140.4 (7.0) | 121.7 (6.5) | 76.1 (4.5) | 75.2 (3.9) | 43.2 (2.9) | 25.6 (1.5) | 18.2 (1.6) | 11.1 (3.1) | 60.4 (4.4) | 181.3 (9.1) | 244.7 (12.4) | |
| MD | 4.9*** | 3.6*** | 2.7*** | 2.8*** | 3.3*** | 1.8*** | 1.2*** | 0.9*** | 0.3 | 1.8*** | 8.5*** | 9.4*** | |
| ES | 0.53 | 0.50 | 0.40 | 0.59 | 0.81 | 0.56 | 0.78 | 0.55 | 0.11 | 0.61 | 0.86 | 0.85 | |
| 8 years | Boys | 203.5 (12.4) | 150.7 (9.4) | 131.0 (8.8) | 82.9 (6.3) | 81.5 (5.4) | 46.5 (4.0) | 27.6 (1.9) | 19.5 (1.8) | 12.0 (3.5) | 64.9 (5.1) | 197.6 (12.7) | 266.4 (17.0) |
| Girls | 200.3 (11.0) | 147.9 (8.1) | 128.1 (7.6) | 80.7 (5.4) | 77.8 (4.5) | 44.9 (3.1) | 26.6 (1.7) | 18.5 (1.5) | 12.2 (3.2) | 62.7 (4.7) | 188.8 (9.9) | 256.1 (13.6) | |
| MD | 3.2** | 2.7** | 3.0*** | 2.2*** | 1.0*** | 1.0*** | 0.2*** | 2.2*** | 3.6 | 1.6*** | 8.8*** | 10.3*** | |
| ES | 0.27 | 0.31 | 0.36 | 0.39 | 0.53 | 0.62 | −0.05 | 0.05 | 0.73 | 0.55 | 0.77 | 0.79 | |
| 9 years | Boys | 214.9 (13.8) | 159.7 (10.6) | 137.7 (10.1) | 88.6 (7.3) | 85.8 (5.7) | 49.3 (4.2) | 28.8 (2.5) | 20.1 (1.6) | 12.4 (3.9) | 67.9 (5.4) | 209.5 (16.0) | 282.7 (20.5) |
| Girls | 210.7 (12.1) | 155.9 (9.5) | 133.9 (8.1) | 84.7 (6.2) | 81.7 (5.3) | 47.1 (3.6) | 27.6 (1.8) | 19.2 (1.8) | 12.5 (3.0) | 66.0 (4.5) | 198.0 (12.4) | 269.2 (16.4) | |
| MD | 4.2** | 3.8*** | 3.8*** | 3.9*** | 4.0*** | 2.2*** | 1.2*** | 0.9*** | 0.0 | 1.9*** | 11.5*** | 13.6*** | |
| ES | 0.33 | 0.38 | 0.41 | 0.58 | 0.73 | 0.57 | 0.54 | 0.50 | 0.01 | 0.50 | 0.80 | 0.90 | |
| 10 years | Boys | 220.1 (12.1) | 163.0 (9.2) | 141.1 (8.4) | 90.3 (6.4) | 86.6 (5.6) | 49.7 (3.9) | 29.0 (1.9) | 19.9 (1.7) | 13.0 (3.3) | 69.3 (4.8) | 210.1 (13.2) | 286.3 (17.8) |
| Girls | 216.0 (11.9) | 159.5 (8.8) | 137.6 (8.5) | 87.1 (5.8) | 83.6 (5.4) | 48.7 (4.0) | 28.3 (1.9) | 19.9 (1.9) | 13.1 (3.6) | 66.9 (5.1) | 202.0 (12.9) | 275.3 (17.0) | |
| MD | 4.1*** | 3.5*** | 3.5*** | 3.2*** | 3.0*** | 1.0** | 0.7*** | 0.1 | −0.1 | 2.5*** | 8.1*** | 11.0*** | |
| ES | 0.33 | 0.39 | 0.41 | 0.52 | 0.55 | 0.25 | 0.35 | 0.04 | 0.04 | 0.73 | 0.62 | 0.74 | |
| 11 years | Boys | 233.3 (13.9) | 172.9 (10.4) | 149.6 (9.6) | 96.5 (6.5) | 91.5 (6.3) | 51.8 (4.3) | 30.4 (2.1) | 21.2 (1.9) | 13.5 (3.4) | 72.8 (5.5) | 222.1 (14.5) | 304.6 (19.9) |
| Girls | 226.0 (12.0) | 166.1 (8.8) | 143.3 (8.0) | 90.9 (6.1) | 87.2 (5.8) | 49.0 (3.7) | 28.9 (2.0) | 20.5 (2.0) | 13.4 (3.3) | 70.9 (5.4) | 210.1 (13.5) | 287.7 (17.3) | |
| MD | 7.2*** | 6.8*** | 6.3*** | 5.6*** | 1.5*** | 0.7*** | 0.1*** | 1.9** | 4.2 | 2.8** | 12.0*** | 17.0*** | |
| ES | 0.56 | 0.71 | 0.71 | 0.89 | 0.73 | 0.35 | 0.03 | 0.35 | 0.70 | 0.90 | 0.86 | 1.08 | |
| 12 years | Boys | 240.5 (13.2) | 177.9 (10.5) | 153.8 (9.4) | 101.0 (7.6) | 94.5 (6.1) | 56.5 (5.9) | 31.6 (2.2) | 21.1 (1.8) | 15.2 (3.9) | 74.1 (5.4) | 230.0 (14.7) | 315.5 (21.2) |
| Girls | 229.6 (9.4) | 168.9 (7.5) | 145.3 (7.4) | 95.0 (5.8) | 89.3 (5.0) | 53.3 (4.6) | 29.8 (1.8) | 20.8 (1.9) | 14.6 (4.1) | 69.8 (4.7) | 216.8 (11.1) | 294.9 (14.6) | |
| MD | 10.9*** | 9.0*** | 8.4*** | 6.0*** | 5.2*** | 3.1*** | 1.8*** | 0.3 | 0.7 | 4.3*** | 13.3*** | 20.6*** | |
| ES | 0.95 | 0.99 | 1.00 | 0.89 | 0.94 | 0.59 | 0.91 | 0.18 | 0.17 | 1.13 | 1.02 | 1.48 |
Boys versus girls.
P<0.05;
P<0.01;
P<0.001.Minus sign (−) indicates larger values for men.
MD – mean differences; ES – effect sizes. FL – foot length; MBL – medial ball length; LBL – lateral ball length; IL – instep length; BW – ball width; HW – heel width; M1H – height of the first metatarsal head; M5H – height of the fifth metatarsal head; ArH – arch height; IH – instep height; BG – ball girth; IG – instep girth.
It is also worth considering that some of the significant differences between boys and girls in normalized foot measurements disappeared except the IL, BW, BG, and IG (Table 4). Previous studies have also shown that many significant differences between boys and girls disappeared when comparing normalized foot measurements [5,15,26], which may be explained by the foot size differences combined with the differences in foot proportions in both sexes [26].
Table 4.
Gender differences in the normalized measures of the same age for boys and girls, from 7 to 12 years old. Values are means (SD).
| MBL | LBL | IL | BW | HW | H–J (5) | H–K (7) | ArH | IH | BG | IG | ||
|---|---|---|---|---|---|---|---|---|---|---|---|---|
| 7 years | Boys | 73.8 (1.2) | 63.8 (2.0) | 40.4 (1.7) | 40.3 (1.8) | 23.1 (1.7) | 13.7 (0.8) | 9.8 (0.8) | 5.9 (1.4) | 31.9 (2.0) | 97.4 (4.4) | 130.3 (4.7) |
| Girls | 73.8 (1.3) | 64.0 (1.9) | 40.0 (1.6) | 39.6 (1.7) | 22.8 (1.5) | 13.5 (0.8) | 9.6 (0.8) | 5.9 (1.6) | 31.8 (2.0) | 95.4 (4.1) | 128.7 (5.0) | |
| MD | 0.0 | −0.2 | 0.4** | 0.7*** | 0.3* | 0.3*** | 0.2** | 0.0 | 0.2 | 2.0*** | 1.6*** | |
| ES | 0.01 | 0.11 | 0.25 | 0.41 | 0.21 | 0.35 | 0.27 | 0.02 | 0.09 | 0.47 | 0.33 | |
| 8 years | Boys | 74.0 (1.1) | 64.4 (1.9) | 40.8 (1.6) | 40.1 (1.9) | 22.9 (1.6) | 13.6 (0.8) | 9.6 (0.8) | 5.9 (1.7) | 31.9 (1.9) | 97.2 (5.3) | 131.0 (6.3) |
| Girls | 73.9 (1.1) | 64.0 (2.0) | 40.3 (1.5) | 38.9 (1.8) | 22.5 (1.6) | 13.3 (0.8) | 9.2 (0.7) | 6.1 (1.6) | 31.3 (1.8) | 94.4 (4.8) | 128.0 (5.2) | |
| MD | 0.2 | 0.4* | 0.5** | 1.2*** | 0.4* | 0.3** | 0.4* | −0.2 | 0.6** | 2.8*** | 3.0*** | |
| ES | 0.16 | 0.23 | 0.29 | 0.64 | 0.24 | 0.34 | 0.48 | 0.10 | 0.33 | 0.56 | 0.53 | |
| 9 years | Boys | 74.3 (1.2) | 64.1 (1.9) | 41.2 (1.7) | 39.9 (1.8) | 23.0 (1.5) | 13.4 (1.0) | 9.4 (0.7) | 5.8 (1.8) | 31.6 (2.0) | 97.6 (6.0) | 131.6 (5.6) |
| Girls | 74.0 (1.3) | 63.6 (1.9) | 40.2 (1.6) | 38.8 (1.8) | 22.4 (1.6) | 13.1 (0.8) | 9.1 (0.8) | 5.9 (1.5) | 31.4 (1.9) | 94.1 (4.3) | 127.8 (4.5) | |
| MD | 0.3* | 0.5* | 1.0*** | 1.1*** | 0.6*** | 0.3** | 0.2** | −0.1 | 0.3 | 3.5*** | 3.8*** | |
| ES | 0.26 | 0.26 | 0.62 | 0.62 | 0.39 | 0.31 | 0.31 | 0.09 | 0.14 | 0.67 | 0.74 | |
| 10 years | Boys | 74.1 (1.2) | 64.1 (1.9) | 41.0 (1.7) | 39.4 (1.8) | 22.6 (1.6) | 13.2 (0.8) | 9.1 (0.7) | 5.9 (1.6) | 31.5 (1.8) | 95.5 (4.3) | 130.1 (4.9) |
| Girls | 73.8 (1.1) | 63.7 (1.8) | 40.3 (1.5) | 38.7 (1.7) | 22.5 (1.7) | 13.1 (0.8) | 9.2 (0.8) | 6.1 (1.7) | 31.0 (2.0) | 93.5 (4.4) | 127.5 (4.6) | |
| MD | 0.3* | 0.4* | 0.7*** | 0.7*** | 0.1 | 0.1 | −0.1 | −0.2 | 0.6** | 2.0*** | 2.7*** | |
| ES | 0.22 | 0.24 | 0.45 | 0.38 | 0.04 | 0.07 | 0.16 | 0.10 | 0.30 | 0.46 | 0.57 | |
| 11 years | Boys | 74.1 (1.1) | 64.1 (1.8) | 41.4 (1.5) | 39.2 (1.8) | 22.2 (1.6) | 13.0 (0.7) | 9.1 (0.8) | 5.8 (1.4) | 31.2 (1.8) | 95.3 (4.3) | 130.6 (5.2) |
| Girls | 73.5 (1.2) | 63.4 (1.7) | 40.2 (1.7) | 38.6 (1.9) | 21.7 (1.4) | 12.8 (0.8) | 9.1 (0.8) | 5.9 (1.5) | 31.4 (2.0) | 93.0 (4.3) | 127.3 (4.5) | |
| MD | 0.6*** | 0.7*** | 1.2*** | 0.6** | 0.5** | 0.2** | 0.0 | −0.1 | −0.1 | 2.3*** | 3.3*** | |
| ES | 0.55 | 0.41 | 0.73 | 0.33 | 0.34 | 0.32 | 0.02 | 0.10 | 0.08 | 0.54 | 0.69 | |
| 12 years | Boys | 73.9 (1.3) | 63.9 (1.8) | 42.0 (1.9) | 39.3 (1.7) | 23.5 (2.0) | 13.2 (0.7) | 8.8 (0.6) | 6.3 (1.6) | 30.9 (2.1) | 95.7 (4.1) | 131.2 (5.5) |
| Girls | 73.5 (1.2) | 63.3 (1.9) | 41.4 (1.8) | 38.9 (1.9) | 23.2 (1.9) | 13.0 (0.8) | 9.1 (0.8) | 6.4 (1.8) | 30.4 (2.0) | 94.4 (4.3) | 128.5 (4.7) | |
| MD | 0.4** | 0.6** | 0.6** | 0.4* | 0.2 | 0.2 | −0.3** | 0.0 | 0.4 | 1.2** | 2.7*** | |
| ES | 0.31 | 0.34 | 0.33 | 0.22 | 0.12 | 0.21 | 0.36 | 0.01 | 0.21 | 0.29 | 0.53 |
Boys versus girls.
P<0.05;
P<0.01;
P<0.001.Minus sign (−) indicates larger values for boys.
MD – mean differences; ES – effect sizes. MBL – medial ball length; LBL – lateral ball length; IL – instep length; BW – ball width; HW – heel width; M1H – height of the first metatarsal head; M5H – height of the fifth metatarsal head; ArH – arch height; IH – instep height; BG – ball girth; IG – instep girth.
A few limitations of the current study should be acknowledged. BMI and physical activity may influence foot shape and were not considered in the present study. In addition, arch height is an important foot dimension measurement; arch height typically is measured by the navicular or talonavicular joint line, but that landmark was not digitized in our study. Last, we did not distinguish between flat feet and normal feet, and the proportion of flat feet may have influenced the results. These limitations need to be considered in future studies.
Conclusions
We found differences between boys and girls in foot morphology among the Chinese school-aged children in this study. The present study provides a unique database of normative values for the description of foot shapes of children 7–12 years old. The information may be used to differentiate between physiologic and pathologic developments of children in this age group and to manufacture appropriate shoes for Chinese school children.
Footnotes
Source of support: This study was supported by the National Natural Science Fund of China (11572202)
References
- 1.McKeon PO, Hertel J, Bramble D, Davis I. The foot core system: A new paradigm for understanding intrinsic foot muscle function. Br J Sports Med. 2015;49:290. doi: 10.1136/bjsports-2013-092690. [DOI] [PubMed] [Google Scholar]
- 2.Mauch M, Grau S, Krauss I, et al. A new approach to children’s footwear based on foot type classification. Ergonomics. 2009;52:999–1008. doi: 10.1080/00140130902803549. [DOI] [PubMed] [Google Scholar]
- 3.Ansuategui Echeita J, Hijmans JM, Smits S, et al. Age-related differences in women’s foot shape. Maturitas. 2016;94:64–69. doi: 10.1016/j.maturitas.2016.09.001. [DOI] [PubMed] [Google Scholar]
- 4.Saghazadeh M, Kitano N, Okura T. Gender differences of foot characteristics in older Japanese adults using a 3D foot scanner. J Foot Ankle Res. 2015;8:1–7. doi: 10.1186/s13047-015-0087-4. [DOI] [PMC free article] [PubMed] [Google Scholar]
- 5.Delgado-Abellan L, Aguado X, Jimenez-Ormeno E, et al. Foot morphology in Spanish school children according to sex and age. Ergonomics. 2014;57:787–97. doi: 10.1080/00140139.2014.895055. [DOI] [PubMed] [Google Scholar]
- 6.Sacco ICN, Onodera AN, Bosch K, Rosenbaum D. Comparisons of foot anthropometry and plantar arch indices between German and Brazilian children. BMC Pediatr. 2015;15:1–6. doi: 10.1186/s12887-015-0321-z. [DOI] [PMC free article] [PubMed] [Google Scholar]
- 7.Price C, Nester C. Foot dimensions and morphology in healthy weight, overweight and obese males. Clin Biomech. 2016;37:125–30. doi: 10.1016/j.clinbiomech.2016.07.003. [DOI] [PubMed] [Google Scholar]
- 8.Zhao XG, Tsujimoto T, Kim B, et al. Does weight reduction affect foot structure and the strength of the muscles that move the ankle in obese Japanese adults? J Foot Ankle Surg. 2017 doi: 10.1053/j.jfas.2017.09.010. [Epub ahead of print] [DOI] [PubMed] [Google Scholar]
- 9.Branthwaite H, Chockalingam N, Greenhalgh A. The effect of shoe toe box shape and volume on forefoot interdigital and plantar pressures in healthy females. J Foot Ankle Res. 2013;6:28. doi: 10.1186/1757-1146-6-28. [DOI] [PMC free article] [PubMed] [Google Scholar]
- 10.Barisch-Fritz B, Plank C, Grau S. Evaluation of the rule-of-thumb: Calculation of the toe allowance for developing feet. Footwear Science. 2016;8:119–27. [Google Scholar]
- 11.Müller S, Carlsohn A, Muller J, et al. Static and dynamic foot characteristics in children aged 1–13 years: A cross-sectional study. Gait Posture. 2012;35:389–94. doi: 10.1016/j.gaitpost.2011.10.357. [DOI] [PubMed] [Google Scholar]
- 12.Onodera AN, Sacco IC, Morioka EH, et al. What is the best method for child longitudinal plantar arch assessment and when does arch maturation occur? Foot. 2008;18:142–49. doi: 10.1016/j.foot.2008.03.003. [DOI] [PubMed] [Google Scholar]
- 13.Waseda A, Suda Y, Inokuchi S, et al. Standard growth of the foot arch in childhood and adolescence – derived from the measurement results of 10,155 children. Foot Ankle Surg. 2014;20:208–14. doi: 10.1016/j.fas.2014.04.007. [DOI] [PubMed] [Google Scholar]
- 14.Hawes MR, Sovak D, Miyashita M, et al. Ethnic differences in forefoot shape and the determination of shoe comfort. Ergonomics. 1994;37:187–96. doi: 10.1080/00140139408963637. [DOI] [PubMed] [Google Scholar]
- 15.Kouchi M. Foot dimensions and foot shape: Differences due to growth, generation and ethnic origin. Anthropological Science. 1998;106:161–88. [Google Scholar]
- 16.Tomassoni D, Traini E, Amenta F. Gender- and age-related differences in foot morphology. Maturitas. 2014;79:421–27. doi: 10.1016/j.maturitas.2014.07.019. [DOI] [PubMed] [Google Scholar]
- 17.Hong Y, Wang L, Xu DQ, Li JX. Gender differences in foot shape: A study of Chinese young adults. Sports Biomech. 2011;10:85–97. doi: 10.1080/14763141.2011.569567. [DOI] [PubMed] [Google Scholar]
- 18.Li JX, Xu DQ, Wang A, Shao K. Analysis of foot shape measures from Chinese male and female adults. In: Hamill J, Hardin E, Williams K, editors. Proceedings of the 7th Symposium on footwear biomechanics; 2005 Jul 27–29; Brentwood, USA. [Google Scholar]
- 19.Cohen J. Statistical power analysis for the behavioral sciences. 2nd ed. Hillsdale (NJ): Lawrence Earlbaum Associates; 1988. [Google Scholar]
- 20.García-Hernández J, Heras S, Juan A, et al. The MORFO3D foot database. Lecture Notes in Computer Science. 2005;3523:658–65. [Google Scholar]
- 21.El O, Akcali O, Kosay C, et al. Flexible flatfoot and related factors in primary school children: A report of a screening study. Rheumatol Int. 2006;26:1050–53. doi: 10.1007/s00296-006-0128-1. [DOI] [PubMed] [Google Scholar]
- 22.Garcia-Rodriguez A, Martin-Jimenez F, Carnero-Varo M, et al. Flexible flat feet in children: A real problem? Pediatrics. 1999;103:e84. doi: 10.1542/peds.103.6.e84. [DOI] [PubMed] [Google Scholar]
- 23.Wozniacka R, Bac A, Matusik S, et al. Body weight and the medial longitudinal foot arch: High-arched foot, a hidden problem? Eur J Pediatr. 2013;172:683–91. doi: 10.1007/s00431-013-1943-5. [DOI] [PMC free article] [PubMed] [Google Scholar]
- 24.Chen KC, Yeh CJ, Tung LC, et al. Relevant factors influencing flatfoot in preschool-aged children. Eur J Pediatr. 2011;170:931–36. doi: 10.1007/s00431-010-1380-7. [DOI] [PubMed] [Google Scholar]
- 25.Cheng JC, Leung SS, Leung AK, et al. Change of foot size with weightbearing. A study of 2829 children 3 to 18 years of age. Clin Orthop Relat Res. 1997;(342):123–31. [PubMed] [Google Scholar]
- 26.Mickle KJ, Steele JR, Munro BJ. Is the foot structure of preschool children moderated by gender? J Pediatr Orthop. 2008;28:593–96. doi: 10.1097/BPO.0b013e318173f782. [DOI] [PubMed] [Google Scholar]
- 27.Chen JP, Chung MJ, Wang MJ. Flatfoot prevalence and foot dimensions of 5- to 13-year-old children in Taiwan. Foot Ankle Int. 2009;30:326–32. doi: 10.3113/FAI.2009.0326. [DOI] [PubMed] [Google Scholar]