

Abstract
The rabbit uteroglobin gene is specifically expressed in certain epithelial cells of ontogenetically unrelated origin. In the endometrium, expression is restricted to the glandular and luminal epithelium and is inducible by progesterone and estradiol. In the lung, Clara cells lining the bronchiolar epithelium show constitutive expression of uteroglobin, which is modulated by glucocorticoids. To explore the molecular basis for this cell type specificity, we have transiently transfected the uteroglobin promoter region fused to the chloramphenicol acetyl transferase gene (CAT gene) in the endometrial cell line Ishikawa; in the human lung cell line NCI-H441, which shows morphological Clara cell characteristics; in HeLa cells; and in three fibroblast cell lines. The uteroglobin promoter efficiently drives expression of the CAT gene in Ishikawa and NCI-H441 cells, but not in HeLa and fibroblast cells. To identify the responsible elements we have analyzed progressive promoter 5′-deletion mutants and randomly generated linker scanning mutants spanning the sequence from −258 to −14 of the uteroglobin promoter. Transfection experiments reveal seven mutation-sensitive regions located around −30, −70, −95, −130, −190, −230, and −255. Several mutants display strong cell type-specific phenotypes. Most significantly, the integrity of the region around -190 is essential for full CAT gene expression in Ishikawa cells, but not in NCI-H441 cells.
Considerable knowledge has accumulated about the mechanisms underlying the control of gene expression in specialized eukaryotic cells. In many cases, it has been shown that the promoter and enhancer elements of cloned genes contain sufficient information to direct expression in a tissue- or cell type-specific manner (Renkawitz, 1989). In the last few years we have begun to study the mechanisms responsible for the expression of the rabbit uteroglobin gene, one of the few examples of a gene that is expressed in several ontogenetically unrelated cell types. Moreover, the expression of the gene is differentially regulated by steroid hormones in different cells. Thus, the rabbit uteroglobin gene provides an attractive model system to study hormonal regulation in conjunction with cell-specific expression.
Rabbit uteroglobin is detectable exclusively in certain epithelial cells that are, however, of different origin. In the rabbit endometrium, expression of the gene is restricted to the glandular and luminal epithelium (Aumuller et al., 1985), where it is inducible by ovarian hormones acting on the transcriptional level (Müller and Beato, 1990). In the lung, Clara cells lining the bronchioh are the expressing cells (Aumüller et al., 1985; Warembourg et al., 1986) and glucocorticoids increase the amount of uteroglobin mRNA (Fernandez-Renau et al., 1984; Lopez de Haro and Nieto, 1985). In addition, in the male genital tract, where uteroglobin expression is testosterone-dependent, only the vesicle gland, the vas deferens, and the epididymis express uteroglobin (Lopez de Haro et al., 1988; Sandmöller et al., 1991). The effects caused by glucocorticoids and progestins are most likely mediated through hormone receptor binding sites located far upstream in the 5′-flanking region of the uteroglobin gene (Jantzen et al., 1987), whereas the estrogen effect could also be mediated by an estrogen-responsive element located in the promoter region around position −258 relative to the transcriptional start point (Slater et al., 1990). The promoter region itself contains at least some information responsible for the tissue-specific expression. The uteroglobin coding sequence and 0.6 kb 5′-flanking sequence are sufficient to direct expression of rabbit uteroglobin to the lung and uterus of transgenic mice (DeMayo et al., 1991). Recently, we have shown that the uteroglobin promoter is able to drive transcription of a reporter gene in the human endometrial cell line Ishikawa more efficiently than in HeLa cells (Misseyanni et al., 1991). In addition, using progressive promoter 5′-deletion mutants, we could roughly identify three functional regions located between −258 and −220, −205 and −177, and −96 and −35. DNase I foot-printing experiments with nuclear extracts from Ishikawa cells revealed at least seven defined protections overlapping these regions (Misseyanni et al., 1991).
Here we report the dissection of the uteroglobin promoter by linker scanning mutagene-sis and the functional analysis in an endometrial and a lung cell line. We show that at least seven regions of the uteroglobin promoter contribute to the efficiency of CAT expression in these cell lines. Moreover, we present strong evidence that the promoter is directly involved in cell type-specific expression of the uteroglobin gene.
Materials and methods
Plasmids
The uteroglobin promoter region was isolated as a 400 bp BamH I fragment (B2-B3) from pUG5 (Suske et al., 1983) and cloned into the BamH I site of pSPT18. The plasmid was named pSPT18/B2B3. The plasmid pBL2 that contains the aminoglycoside 3′-phosphotransferase gene has been published (Luckow et al., 1987). The construction of pSPT18(395/+14)CATSV has been described previously (Misseyanni et al., 1991). All plasmids used for transfections were purified by two successive CsCl/ethidium bromide gradients and quantitated spectrophotometrically.
Linker scanning mutagenesis
Introduction of gaps
For the linker scanning mutagenesis of the uteroglobin promoter, 30 pg CsCl purified supercoiled pSPT18/B2B3 were randomly apurinated with 2% formic acid for 4 minutes at 15°C. The reaction was stopped with 1 M Tris-HCl, pH 8, and the DNA precipitated with ethanol. The DNA was redissolved in 200 pi 66 mM Tris-HCl, pH 8.0,125 mM NaCl, 5 mM CaCl2, and 10 mM DTT and treated with 200 U exonuclease III (Boehringer Mannheim) at 37°C. After 1, 3, and 9 minutes, 67 μl aliquots each were removed; the reaction was immediately atopped with EDTA, pooled, extracted with phenol/chloroform, and the DNA precipitated.
Isolation of nicked/gapped circles and linearization
Nicked and gapped plasmids were separated from remaining supercoiled plasmids in a CsCl/ethidium bromide gradient at 70,000 rpm using the Beckman TLV minirotor. Approximately 50% of the starting material was nicked. For linearization of the nicked/gapped circles, the DNA was dissolved in 60 pi 50 mM sodium acetate, pH 5.7, 0.2 M NaCl, 1 mM ZnS04, 0.5% glycerol, and incubated with 600 U SI nuclease (Sigma) at 37°C. After 1, 4, and 15 minutes 20 μl aliquots were removed, stopped with EDTA, pooled, extracted with phenol/chloroform, and the DNA precipitated with ethanol.
Construction of kanamycin-resistant linker library
The S1 nuclease-treated DNA was incubated with T4 DNA polymerase, and phosphorylated 8-mer Bgl II linkers (CAGATCTG, Boehringer Mannheim) were ligated according to standard protocols (Maniatis et al., 1982). After digestion with Bgl II and removal of excess linkers by two precipitations with ammonium acetate/ethanol, the DNA was dephosphorylated with alkaline phosphatase. The aminoglycoside 3′-phospho-transferase gene that mediates kanamycin resistance was isolated as a 1.4 kb Bgl II fragment from pBL2 (Luckow et al., 1987) and ligated to the dephosphorylated vector. Competent bacteria (E. coli strain JM109) were prepared and transformed according to the Hanahan protocol (1983). The transformed cells were plated on 15 cm SOB agar plates containing ampicillin (50 μg/ml) and kanamycin (100 μg/ml). Colonies were scraped from the plates with SOB medium and pooled, and DNA was extracted according to Birnboim and Doly (1979). To further propagate clones that have inserted linkers only in the uteroglobin promoter between −258 and −14, 50 qg DNA was cut with BstE II (at position −263 in the uteroglobin promoter) and EclX I (at position −14 in the uteroglobin promoter). The 1.65 kb fragments containing uteroglobin promoter sequences together with the Kmr gene were isolated and cloned into pSPT18/B2B3, replacing the 250 bp BstE II-EclX I uteroglobin wild-type promoter sequence. After transformation of E. coli strain DH5, approximately 60,000 clones were platted ad pooled, and DNA was extracted.
Construction of linker scanning mutant expression vectors
To remove the Kmr gene from the uteroglobin promoter, 60 μg DNA in 250 μl was cut with Bgl II, diluted to 20 ml with 20 mM Tris-HCl, pH 7.5, 10 mM MgCl2, 10 mM DTT, 1 mM ATP, and religated. After concentration by ethanol precipitation, the DNA was dissolved and cut with BstE II and EclX I. The excised 250 ± x bp BstE II-EclX I fragments containing Bgl II linkers were separated from vector DNA through a 2% agarose gel and electro-eluted. Subsequently, this DNA was fractionated more stringently through a preparative 5% polyacrylamide gel using the 250 bp BstE II-EclX I wild-type fragment as size marker. After electroelution, the mutated BstE II-EclX I fragments containing the Bgl II linkers were sub-cloned directly into the expression vector pUG (−395/+14)CATSV (Fig. 1).
Figure 1.

Restriction map of the plasmid pUG(−395) CATSV. A 400 bp BamH I fragment that contains the promoter region of the uteroglobin gene between −395 and +14 is marked “UG.” The promoter region that has been mutagenized (BstE II-EclX I fragment) is indicated. Further abbreviations are CAT (chloramphenicol acetyl transferase gene), SVen (SV40 enhancer), Amp (β-lactamase gene), and ori (origin of replication).
Screening of individual clones
From individual clones plasmid DNA was prepared on a 1.5 ml scale (Maniatis et al., 1982) and subjected to a G or C double-strand sequencing reaction using the T7 sequencing kit from Pharmacia and [α-35S]dATP. As primers either an oligonucleotide directed against the SP6 promoter (5′-ACCTTATGTATCATACACAT-3′) or a primer directed against a CAT sequence (5′-ATATCA ACGGTGGTATATCCAGTG-3′) located approximately 50 bp downstream of the transcriptional start site were used. Sequencing reactions of mutant clones together with the wild-type sequence were analyzed on 6% denaturing polyacrylamide gels. DNA from clones that contained the Bgl II linker sequence and did not contain more than ± 2 nucleotides insertions/deletions was sequenced using the same primers as for the tracking reactions.
Cell culture, preparation of nuclear extracts, and DNA transfections
Ishikawa and HeLa cells were cultured in MEM and DMEM medium as described previously (Slater et al., 1990). NCI-H441 cells and the fibro-blast cell lines NIH3T3, 208F, and XC were cultured as monolayers in RPMI and DMEM medium, respectively, supplemented with 10% fetal calf serum. For the preparation of nuclear extracts, 5 × 10⁸ cells were used according to Shapiro et al. (1988), except that all buffers contained 0.5 mM PMSF, and the hypotonic buffer for the isolation of nuclei contained 0.5% skim milk (Maire et al., 1989). Ishikawa and HeLa cells were transfected by the DEAE-dextran method (Cato et al., 1986), NCI-H441 cells with lipofectin according to a protocol of the manufacturer (BRL), and NIH3T3, 208F, and XC cells by precipitation with calcium phosphate (Graham and van der Eb, 1973). All cell lines were transfected with 5 μg plasmid DNA per 6 cm dish, including 1 μg RSVPgal (Hall et al., 1983) as internal reference. Transfected cells were harvested 72 hours after transfection for CAT and β-galactosidase assays. CAT assays were performed with 100 μg protein according to Gorman et al. (1982), and β-galactosidase assays with 25 μg of protein according to Hall et al. (1983). CAT conversion was assayed by thin layer chromatography and quantitation of the acetylated and non-acetylated forms of [14C]-chloramphenicol performed with an automated Imaging Scanner (United Technologies Packard). The ratio of acetylated to total chloramphenicol was displayed as percentage of conversion.
Oligonucleotides and mobility shift experiments
Oligonucleotides were synthesized on an Applied Biosystems 380A oligonucleotide synthesizer using deoxynucleoside phoshoramidite chemistry. Annealing of single-stranded oligonucleotides was done by heating a mixture of complementary strands (10 nmoles each) to 95°C in 100 μl of annealing buffer (10 mM Tris-HC1 pH 8.0,1 mM EDTA, 30 mM KC1) and cooling to room temperature over a few hours. Sequences of the oligonucleotides were as shown in Table 1. Double-stranded DNA was labeled by filling in the ends using [α-32P]dCTP and DNA polymerase Klenow fragment. Labeled double-stranded DNA was separated from un-annealed strands by gel electrophoresis on a native 6% polyacrylamide gel in TBE (0.1 M Tris base, 0.089 M boric acid, 1 mM EDTA). DNA was isolated from the gel using standard procedures (Smith, 1980).
Table 1.
Oligonucleotide sequences
| Uppercase characters denote uteroglobin promoter sequences; the position of LS mutations is underlined. |
| OWT−209/−175 |
| agcttCGCGCTCTCCCTCCCCCCCAGCCACCCATTGTGTC |
| aGCCCGAGAGGGAGGGGGCCTCCCTGGGTAACACACagct |
| OLS−175/−183 |
| agcttCGGCCTCTCCCTCCCCCCGAGGGACCCcagaTcTG |
| aGCCCGAGAGGGAGGGGGGCTCCCTGGGgtctAgACagct |
| OLS−192/−200 |
| agcttCGGGCTCTCCagatCtgAGGGACCCATTGTGTG |
| aGCCCGAGAGGtctaGacTCCCTGGCTAACACACaqct |
| OLS−197/−204 |
| agcttCGGGCcagatCTgCCCCCGAGGGACCCATTGTGTG |
| aGCCCGgtctaGAcGGGGGCTCCCTGGGTAACACACagct |
Uppercase characters denote uteroglobin promoter sequences; the position of LS mutations is underlined.
For the mobility shift assay (Carthew et al., 1986; Singh et al., 1986), 7.5 to 10 μg of nuclear extract proteins were preincubated with 1 μg of unspecific competitor poly(dl-dC) in 10 mM HEPES, pH 7.9, 100 mM KC1, 1 mM DTT, 0.5 mM MgCl2, 0.1 mM EDTA, and 8.5% glycerol for 15 minutes on ice. Subsequently, 0.5 ng of labeled double-stranded oligonucleotide was added to yield a final volume of 20 μl, and incubation was continued at room temperature for another 15 minutes. For competition experiments a 100-fold molar excess of unlabeled oligonucleotide was included after the addition of labeled probe. Samples were analyzed on a 4% native polyacrylamide gel (acrylamide/bis = 40/1) in 0.05 M Tris base, 0.045 M boric acid, and 0.5 mM EDTA. The gel was transferred to Whatman 3MM paper, dried under heat and vacuum, and exposed to Kodak XAR5 film overnight at room temperature.
Results
The rabbit uteroglobin promoter directs cell type-specific expression of the CAT gene
To identify the uteroglobin 5′-flanking sequences responsible for cell-specific expression, we performed gene transfer experiments in several cell lines. The Ishikawa cell line has been established from a human uterine adenocarcinoma, and it exhibits biochemical and morphological properties of endometrial cells (Nishida et al., 1985). The NCI-H441 cell line, derived from a human lung papillary carcinoma (Gazdar et al., 1990), exhibits morphological properties of lung Clara cells. These cells express surfactant protein A mRNA constitutively and surfactant protein B mRNA dexamethasone-dependent (Gazdar et al., 1990). Transient transfection of the bacterial CAT gene under the control of the rabbit promoter (Fig. 1) in the endometrial cell line Ishikawa, the lung cell line NCI-H441, HeLa cells, and in three different fibroblast cell lines reveals clear differences (Fig. 2). All six cell lines strongly express CAT from the control plasmid pRSVCAT In contrast, the promoter of the rabbit uteroglobin gene specifically drives the expression of the CAT gene in the endometrial cell line Ishikawa and in the human lung cell line NCI-H441, but not in HeLa, NIH3T3, XC, and 208F cells. This becomes evident if one compares the expression of UG(−395)CATSV with of the promoter sequence from −395 to −35 causes at least a 25-fold reduction of CAT gene expression in Ishikawa and in NCI-H441 cells. In contrast, no such phenotype is observed in HeLa, NIH3T3, XC, and 208F cells. In these cell lines deletion of the uteroglobin promoter sequence from −395 to −35 does not significantly alter CAT gene expression (see Fig. 2). From these data we conclude that Ishikawa and NCI-H441 cells contain factors, not present or active in HeLa cells and various fibroblast cell lines, that are able to enhance and specifically drive transcription from the uteroglobin promoter.
Figure 2.

Cell type specificity of the rabbit uteroglobin promoter. Ishikawa, NCI-H441, HeLa, NIH 3T3, 208F, and XC cells were transfected with the plasmids pUG (−395)CATSV, pUG(−35)CATSV, and pRSVCAT. Cell extracts were prepared after 72 hours and assayed for CAT activity. The CAT activity is expressed relative to pRSVCAT that has been given the arbitrary value of 1,000. The absolute values for the plasmid pUG(−395) CATSV are 125, 37, 3, 30, 17, and 2 pmol min−1 mg−1 for Ishikawa, NCI-H441, HeLa, NIH3T3, XC, and 208F cells, respectively.
Uteroglobin promoter 5′-deletion mutations reveal cell type-specific cis-elements
A series of uteroglobin promoter 5′-deletion mutations in front of the CAT gene has been described and analyzed in Ishikawa cells previously. In addition, it was shown that alterations in CAT activity reflect alterations in correct transcription (Misseyanni et al., 1991). Transfection experiments revealed two regions of the promoter located between −258 and −220 and −205 and −177, respectively, as necessary for CAT gene expression in that cell line (Misseyanni et al., 1991). We have extended these studies by transiently transfecting the same deletion mutants series in NCI-H441 cells. The results obtained are significantly different from those reported in Ishikawa cells (Fig. 3). Whereas a uteroglobin promoter deletion up to −301 causes a slight increase in CAT conversion in both cell lines compared with the reference value of the −395 deletion, further deletion up to −258 restores the reference activity in Ishikawa cells but not in NCI-H441 cells, where it remains elevated. A four- to fivefold drop in CAT activity that has been observed with Ishikawa cells when nucleotides up to −220 are deleted is also observed with NCI-H441 cells. The second major decrease that leads to background CAT conversions in Ishikawa cells (compare −205 and −177 in Fig. 3) is not detectable in NCI-H441 cells. Thus, the sequence of the uteroglobin promoter between −205 and −177 is important for CAT gene expression in the endometrial cell line Ishikawa but not in the lung cell line NCI-H441. In Ishikawa cells, appropriate analysis of deletions downstream of −177 has not been possible due to the low activity of the truncated promoter. However, in NCI-H441 cells, CAT conversions are high enough to characterize further downstream deletions. We observe a step-wise decrease with progressive deletions up to −159, −96, and −47, with the most significant decrease (approximately fourfold) between −96 and −47.
Figure 3.

Relative CAT activities of rabbit uteroglobin 5′ deletion mutants in Ishikawa and NCI-H441 cells. The wild-type construct pUG(−395)CATSV (see Fig. 1) and progessive 5′-promoter deletion mutants indicated by the deletion end points relative to the transcriptional start site were transfected in Ishikawa and NCI-H441 cells and assayed for CAT activity as described in Materials and Methods. The activity of pUG(−395)CATSV has been given the arbitrary value of 100 in Ishikawa and NCI-H441 cells, respectively.
Generation of linker scanning mutations in the uteroglobin promoter
In order to identify the elements responsible for the cell type-specific uteroglobin expression in more detail, we have generated linker scanning mutations within the promoter of the rabbit uteroglobin gene extending from position −258 through −14. For mutagenesis we have employed a modified version of a method originally described for the analysis of the chicken lysozyme promoter (Luckow et al., 1987; Luckow and Schütz, 1989). Our modifications mainly circumvent the time-consuming and expensive topoisomerase I screening step of the original protocol. The strategy used is schematically outlined in Figure 4. As starting plasmid, we have used pSPT18/B2B3, which contains a 400 bp BamH I fragment of the rabbit uteroglobin gene from −395 to +14 relative to the transcription start point. The first steps for mutagenesis included the introduction of small gaps and the insertion of Bgl II linkers. After ligation of the aminoglycoside 3′-phosphotransferase gene (Luckow et al., 1987), double selection for ampicillin and kanamycin resistance ensured propagation only of plasmids that had obtained Bgl II linkers and the kanamycin resistance gene outside the β-lactamase gene. Approximately 70,000 independent double-resistant clones were plated and pooled, and DNA was extracted. To propagate only clones that had obtained Bgl II linkers in the uteroglobin promoter region of interest, the DNA was cleaved with BstE II and EclX I that cut in the wild-type uteroglobin promoter region at positions −263 and −14, respectively. The resulting 1.65 kb BstE II-EclX I fragments containing the 1.4 kb Kmr gene and uteroglobin promoter sequences were subcloned into pSPT18/B2B3 by replacing the 250 bp BstE II-EclX I wild-type uteroglobin promoter fragment. Approximately 60,000 clones were plated and pooled, and DNA was prepared. Subsequently, the kanamycin resistance gene was removed with Bgl II, and the plasmid recircularized in vitro. The mutated BstE II-EclX I uteroglobin region carrying Bgl II linkers was stringently size fractionated and subsequently subcloned into the expression vector pUG (−395)CATSV (Fig. 1) by again replacing the BstE II-EclX I wild-type promoter sequence. DNA from individual clones was prepared and screened by G or C tracking reactions. The result of the G/C tracking screening is summarized in Table 2. Plasmids that had no or only few insertions/deletions in different regions of the promoter were sequenced. The sequences of 31 different uteroglobin promoter mutants, together with the wild-type sequence, are shown in Figure 5.
Figure 4.

Schematic outline of the strategy for the construction of uteroglobin promoter linker scanning mutants.
Table 2.
Uteroglobin promoter mutant screening
| Total number of clones analyzed = 292; total number of clones with promoter insert = 275. | |
| Mutant type | Distribution (%) |
|---|---|
| ± 0/1 bp insertions/deletions | 27.7 |
| ± 2/3 bp " | 29.6 |
| ± 4/5 bp " | 25.6 |
| ± 6–8 bp " | 12.1 |
| ± >9 bp " | 0.4 |
| No linker detectable | 3.2 |
| Completely different sequence | 1.4 |
Figure5.

Sequence of the linker scanning mutations in the uteroglobin promoter. The nucleotide sequence of the wild-type DNA from −395 to +14 is shown (WT). The synthetic linker sequence (CAGATCTG) and further nucleotides that differ from the wild-type sequence are displayed with bold letters. The clustered point mutations introduced by the synthetic linker sequence are indicated by lower case letters. In linker scanning mutants that do not have exact substitutions, the alignment has been adjusted to the wild-type sequence by insertion of a hyphen (-) for a missing nucleotide and the addition of nucleotides above the sequence for inserted nucleotides.
Functional analysis of uteroglobin promoter linker scanning mutants
The phenotypes of 31 linker scanning promoter mutants were analyzed by transient transfection studies using the endometrial cell line Ishikawa and the lung cell line NCI-H441. In every transfection series at least 2 transfections with the wild-type plasmid pUG(−395)CATSV were included. The results of at least three independent transfection experiments with Ishikawa and NCI-H441 cells are shown in Table 3. A strikingly complex phenotype pattern is observed.
Table 3.
Effects of uteroglobin promoter linker scanning mutations.
| Mutants | Relative CAT activitya | |
|---|---|---|
| Ishikawa | NCI-H441 | |
| Wild type | 100 | 100 |
| LS−19/−27 | 4.2 | 15.1 |
| LS−23/−30 | 3.5 | 11.5 |
| IS−30/−37 | 5.6 | 18.6 |
| LS−35/−42 | 29.2 | 29.5 |
| LS−38/−45 | 93.7 | 49.5 |
| LS−38/−47 | 75.7 | 55.2 |
| LS−47/−S4 | 58.5 | 70.0 |
| LS−49/−56 | 37.5 | 64.2 |
| LS−53/−60 | 39.0 | 79.9 |
| IS−64/−72 | 5.4 | 6.7 |
| LS−68/−75 | 67.5 | 80.5 |
| LS−92/−99 | 27.0 | 48.0 |
| LS−110/−117 | 41.2 | 102.7 |
| LS−113/−119 | 60.0 | 73.5 |
| LS−127/−132 | 22.5 | 37.8 |
| LS−135/−140 | 126.0 | 114.0 |
| LS−142/−146 | 142.5 | 90.4 |
| LS−148/−155 | 55.5 | 129.0 |
| LS−165/−173 | 44.2 | 90.4 |
| LS−175/−183 | 9.7 | 91.5 |
| LS−192/−200 | 12.0 | 101.5 |
| LS−197/−204 | 22.5 | 46.9 |
| LS−201/−208 | 33.0 | 42.7 |
| LS−211/−218 | 48.0 | 73.5 |
| LS−222/−229 | 21.0 | 12.0 |
| LS−229/−236 | 21.9 | 11.1 |
| LS−232/−240 | 39.0 | 102.4 |
| LS−241/−250 | 59.2 | 84.3 |
| LS−245/−252 | 150.0 | 97.0 |
| LS−249/−256 | 26.4 | 87.4 |
| LS−249/−257 | 24.0 | 73.5 |
The values represent mean values of at least three independent transfection experiments and are expressed relative to the wild-type, which has been given the arbitrary value of 100. All values were normalized for β-galactosidase activity as a correction for variation in transfection efficiency.
In Ishikawa cells, none of the mutations in the uteroglobin promoter enhance expression of the CAT gene more than 50%. Ten mutations do not alter expression of the CAT gene at all, or alter it by less than 50% (LS−38/−45, LS−38/−47, LS−47/−54, LS−68/−75, LS−113/−119, LS−135/−140, LS−142/−146, LS−148/−155, LS−241/−250, and LS−245/−252). Six mutations reduce CAT activity two- to threefold (LS−49/−56, LS−53/−60, LS−110/−117, LS−165/−173, LS−211/−218, and LS−232/−240), and nine mutations three- to sixfold (LS−35/−42, LS−92/−99, LS−127/−132, LS−197/−204, LS−201/−208, LS−222/−229, LS−229/−236, LS−249/−256, LS−249/257). Six mutations strongly effect expression 6- to 25-fold (LS−19/−27, LS−23/−30, LS−30/−37, LS−64/−72, LS−175/−183, LS−192/−200). A clearer picture of the functional analysis emerges by plotting the determined phenotypes of the linker scanning mutations against their positions in the promoter (Fig. 6). This way it becomes obvious that the rabbit uteroglobin promoter displays at least seven different mutation-sensitive regions in Ishikawa cells. These regions are located around positions −30, −70, −95, −130, −190, −230, and −255.
Figure 6.

CAT activity of uteroglobin promoter linker scanning mutants in Ishikawa and NCI-H441 cells. Ishikawa and NCI-H441 cells were transfected with the linker scanning promoter mutants and assayed for CAT activity. The diagrams show the relative CAT activity of the linker scanning mutants in Ishikawa (upper diagram) and NCI-H441 cells (lower diagram) in relation to the position of the mutations in the promoter. Every column represents a single promoter linker scanning mutant. The values are expressed relative to the wild-type plasmid, which has been given the arbitrary value of 100. For each linker scanning mutant the mean value and the standard deviation are displayed.
In NCI-H441 cells, many of the mutations have similar effects, although not as pronounced as in Ishikawa cells (Table 2 and Fig. 6). However, some mutations show strong cell type-specific differences. Most significantly, the mutations LS−175/−183 and LS−192/−200 show wild-type activity in NCI-H441, but more than sixfold reduced activity in Ishikawa cells. The two adjacent mutations LS−165/−173 and LS−148/−155 also display wild-type activity in NCI-H441 cells, but twofold reduced activity in Ishikawa cells. In addition, the two mutations that replace sequences around −255(LS−249/−256 and LS −249/−257) have a fourfold negative effect in Ishikawa but retain wild-type activity in NCI-H441 cells. None of the linker scanning mutations display a reduced activity in NCI-H441 cells not detectable in Ishikawa cells.
DNA-binding experiments
To see if the different effects of the mutations LS−175/−183 and LS−192/−200 in Ishikawa and NCI-H441 cells can be explained by a different repertoire of DNA-binding proteins, mobility shift assays were performed. In this analysis we also included HeLa cell nuclear extract as a control. Four oligonucleotides spanning the promoter region from −209 through −175 were used (Fig. 7A). Oligonucleotide OWT−209/−175 contains the wild-type promoter sequence, whereas oligonucleotides OLS−175/−183, OFS−192/−200, and OFS−197/−204 have the sequence of the corresponding LS mutants. Five specific complexes, numbered 1 to 5, can be detected with the wild-type sequence in nuclear extracts from Ishikawa as well as from NCI-H441 cells. Complex 5 with the highest mobility is missing in binding reactions with HeFa nuclear extract (Fig. 7B). Therefore, complex 5 is specific for the two cell lines expressing the CAT gene under the control of the utero-globin promoter. Complexes 4 and 5 are not generated with oligonucleotide OFS−175/−183, whereas complexes 1, 2, and 3 are not detected with OLS−197/−204. With OFS−192/−200, whose LS mutation overlaps that of FS−197/−204, complexes 1, 2, and 3 are detectable, but the corresponding bands are much weaker compared to the wild-type. These data suggest that there are two distinct recognition sites for DNA-binding proteins. One binding site is destroyed by LS−175/−183, the other by LS−197/−204. Though there are no qualitative differences in complex formation between Ishikawa and NCI-H441 cell extracts, there are moderate quantitative differences in the ratios of complexes 1 to 3 and 4 to 5, respectively. Relative to complex 5, complex 4 is 2.5-fold more abundant in Ishikawa nuclear extract than in NCI-H441 nuclear extract. Conversely, complexes 1 and 2 are present in equimolar amounts in both extracts, but relative to complex 3 they are twofold more abundant in NCI-H441 nuclear extract than in Ishikawa nuclear extract (densitometric scanning data not shown).
Figure 7.
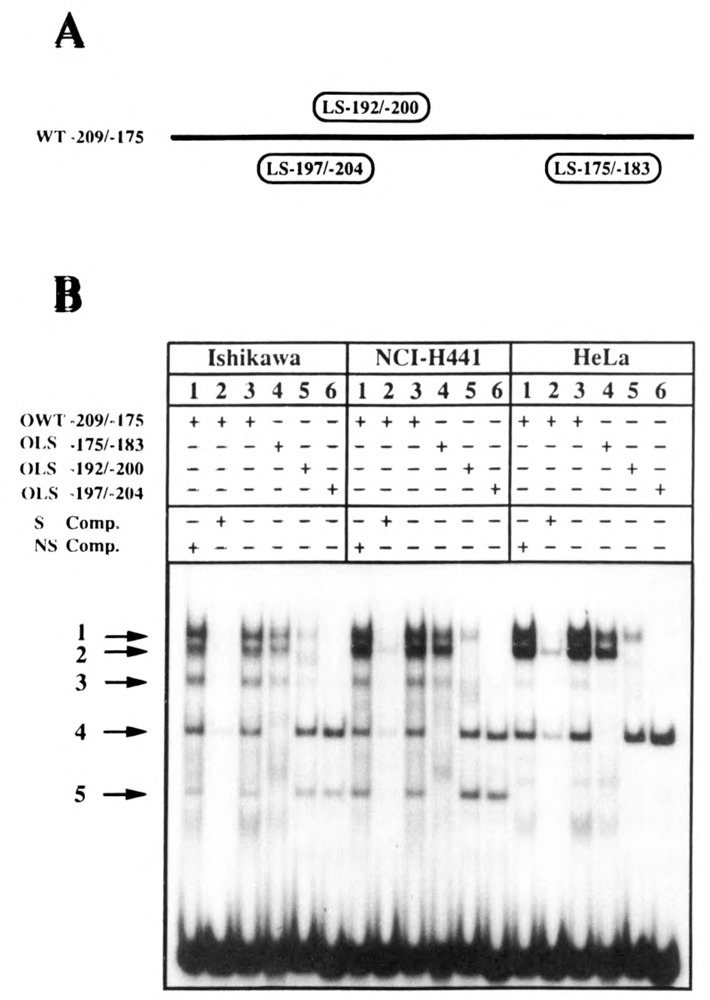
Mobility shift DNA-binding assays. Double-stranded oligonucleotides encompassing the uteroglobin promoter region from −209 to −175 were labeled, and mobility shift experiments were performed using nuclear extracts from Ishikawa, NCI-H441, and HeLa cells. A. The oligonucleotides used are shown schematically (for details see Materials and Methods). The position where the wild-type sequence is replaced by the linker sequence in the corresponding OLS oligonucleotide is labeled by an oval box. B. Nuclear extracts were incubated with oligonucleotides OWT−209/−175 (lanes 3), OLS–175/−183 (lanes 4), OLS–192/−200 (lanes 5), andOLS−197/−204 (lanes 6), and complex formation was analyzed on native 4% polyacrylamide gels. Specificity of complex formation was demonstrated by specific competition (S Comp.) with a 100-fold molar excess of unlabeled OWT−209/−175 oligonucleotide (lanes 2) or a nonspecific (NS Comp.) double-stranded 20-mer DNA fragment of random sequence (lanes 1).
Discussion
Cell type specificity of the rabbit uteroglobin promoter
The transfection experiments described in this report show that the rabbit uteroglobin promoter region extending from - 395 to +14 contains regulatory elements involved in its cell type-specific activity. This promoter fragment directs specific transcription of a reporter gene in the endometrial cell line Ishikawa and in the lung Clara cell line NCI-H441 but not in various fibroblast cell lines. In addition, HeLa cells behave very similarly to the fibroblast cell lines when transiently transfected with uteroglobin promoter CAT constructs (Misseyanni et al., 1991). Thus, these data correlate with the situation in vivo, where uteroglobin is expressed exclusively in certain epithelial cells – for instance, in the glandular and luminal endometrium and the lung Clara cells, but not in fibro-blasts. However, it should be noted that the analyzed promoter region is not the only region involved in transcriptional regulation. Sequences far upstream of the gene, at positions around −2.5 kb and −3.7 kb, where DNase I hypersensitive sites have been detected in the endometrium after hormonal stimulation (Jantzen et al., 1987), most probably play an important role also, at least for the hormonal induction of uteroglobin gene transcription in the endometrium.
The analysis of uteroglobin promoter 5′-deletion mutations was useful to narrow down the important regions within the 400 bp promoter fragment. For Ishikawa cells, we had already determined that the sequence downstream of −258 but not the sequences between −395 to −258 are decisive for the promoter activity. We have extended the analysis to a human lung cell line (NCI-H441) that shows morphological Clara cell properties and have observed similarities to but also significant differences from Ishikawa cells. Most importantly, deletion of the promoter from −205 to −177 reduces CAT activity in Ishikawa cells fourfold, whereas in NCI-H441 cells this deletion does not alter CAT activity significantly.
Linker scanning mutagenesis
We have modified a rarely used method (Luckow et al., 1987) to construct linker mutations within the rabbit uteroglobin promoter. To our knowledge, this report represents the first successful application of this method since its original publication. This may be due to the rather critical and expensive topoisomerase I screening step. For screening of a large number of individual clones, only relatively impure minilysate DNA can be used, which requires the use of at least 30 times more topoisomerase I than for CsCl purified DNA. Although topoisomerase I is commercially available, it is rather expensive. We circumvented the topoisomerase I screening step and analyzed minilysate DNA from individual clones directly by a tracking sequencing reaction with double-stranded plasmid DNA. The tracking reaction has the further advantage that not only clones with no or small insertions/deletions, but also the positions of the linker mutations could be identified, avoiding further propagation of identical or very similar clones. In addition, the tracking reaction can be performed directly with the appropriate expression vector useful for transfection experiments. For topoisomerase I screening the size of expression vectors (more than 5 kb) is too large; therefore an additional step, cloning into a smaller plasmid, would have been necessary (Luckow et al., 1987).
Cis-acting elements in the uteroglobin promoter
The linker scanning mutations allowed the further dissection of the uteroglobin promoter and enabled the identification of sequence elements whose integrity is necessary for full promoter activity in the different cell lines. Altogether at least seven different regions in the uteroglobin promoter are sensitive to mutations. All mutations in these areas lead to reduction of uteroglobin promoter activity, suggesting the absence of functional negative elements in this region of the promoter. DNase I footprinting experiments using nuclear extracts from Ishikawa cells showed that all regions sensitive to mutations are protected by nuclear proteins (Misseyanni et al., 1991). A model that summarizes our current knowledge of the organization of the rabbit uteroglobin promoter region is shown in Figure 8.
Figure 8.

Model of the uteroglobin promoter structure. The rabbit uteroglobin promoter contains seven mutation-sensitive regions (I-VII). Region I overlaps the TATA box. Replacement of certain sequences in region II abolishes promoter activity to background levels and is probably different from an AP2 binding site, despite the occurrence of an appropriate recognition sequence (see text). Regions III and IV have the identical A/T-rich sequence and bind the same transcription factor. The sequence is similar to the distal octamer motif in the MMTV promoter. The integrity of the whole region V seems to be necessary for full promoter activity in Ishikawa cells, but only the 5′ portion appears to be necessary for maximal expression in NCI-H441 cells. Region VI contains the GT-I motif of the SV40 enhancer and two CACCC-boxes. Region VII refers to an ERE and an upstream element (see text).
Mutations around the TATA box region exhibit the strongest phenotypes in Ishikawa and NCI-H441 cells. Only LS−30/−37 destroys the TATA box consensus sequence ATA itself. Mutant promoters with an intact ATA that contain replaced sequences further downstream (LS−19/−27 and LS−23/−30) also reduce CAT activity down to background level. In addition, a mutation immediately upstream (LS−35/−42) reduces CAT activity four- to fivefold. In DNase I footprinting experiments with Ishikawa nuclear extracts, we observed protection over the whole TATA box region, which is not visible with HeLa cell extracts (Misseyanni et al., 1991). In addition, in mobility shift experiments, an Ishikawa cell-specific DNA-protein complex has been detected (Misseyanni et al., 1991). The idea that a cell type-specific transcription factor binds to this region (Misseyanni et al., 1991), whose presence is essential for the promoter activity, is strengthened by the linker scanning mutations that lie very close to the TATA box.
The second functional region in the rabbit uteroglobin promoter is located around position −65. The LS−64/−72 mutation has a 25-fold reduced activity. The Bgl II linker changes the sequence GCCCAGGC (−74 to −67) –which is very similar to the AP2 recognition sequence CCCCAGGC (Mitchell et al., 1987;Jones et al., 1988)-to GCCAGATCT, suggesting that AP2 might be the active transcription factor here. On the other hand, the adjacent, partially overlapping mutation further upstream (LS−68/−75) also destroys this potential AP2 recognition site but retains almost wild-type activity. In addition, the footprint obtained with nuclear extracts from Ishikawa cells lies between −52 and −72 and protects only partially the potential AP2 binding site (Misseyanni et al., 1991). Therefore, it is unlikely that AP2 is the relevant transcription factor acting through that region.
The third and fourth mutation-sensitive regions lie around −95 and −130, respectively. LS−127/−132 and LS−92/−99 destroy two A/T-rich sequence motifs that are identical in ten out of eleven nucleotides (−123 AAGTAAATATT −133 and −102 AAGTAAATAAT −92). Mobility shift experiments using oligonucleotides that encompass these sequences revealed that a single, specific shift is obtained with Ishikawa and HeLa cell nuclear extracts (unpublished data). In addition, both oligonucleotides compete with each other. Thus, we conclude that both elements are recognized by the same transcription factor active in both cell lines. Sequence comparisons with recognition sites of well characterized transcription factors reveal that the first eight nucleotides of these two sequences are similar to octamer motifs found in many promoters (Pierani et al., 1990). Lor instance, the distal octamer motif recently identified in the MMTV promoter (Brüggemeier et al., 1991) at position −56/−49 (ATGTAAAT) is in seven out of eight nucleotides identical to the two sequence motifs in the uteroglobin promoter. Thus, it seems likely that an octamer motif binding factor binds to these two cis-elements necessary for full uteroglobin promoter activity. As octamer motifs are binding sites for a whole family of transcription factors, it remains to be established which member(s) of that family is present and active in Ishikawa and NCI-H441 cells.
The fifth region sensitive to nucleotide replacements spans at least 60 nucleotides between −208 and −148 and appears to be highly complex. All six uteroglobin promoter constructs that have mutations in this region lead to reduction of CAT activity in Ishikawa cells. In contrast, the two constructs that show the most marked (six- to eightfold) reduction of CAT activity in Ishikawa cells (LS−192/−200 and LS−175/−183) have wild-type activity in NCI H441 cells. These data are in agreement with results of the promoter 5′-deletion mutation analysis. Truncation of the uteroglobin promoter from −205 to −177 reduces transient CAT expression in Ishikawa cells but not in NCI-H441 cells. The LS−192/−200 mutation replaces partially the so-called uteroglobin upstream element (UGUE) CCTCCCCCCGAGG, which has been previously identified as a sequence motif that is repeated (with a single bp difference) in inverse orientation from −252 to −240 (Misseyanni et al., 1991). In the LS−175/−183 mutation a G/T-rich sequence is replaced by a Bgl II recognition sequence.
To see if there is a correlation between functional data from gene transfer experiments and in vitro protein-DNA binding experiments, mobility shift assays were performed using oligonucleotides with wild-type and LS mutant sequences encompassing the region from −209 to −175. Live complexes were detected in nuclear extracts from Ishikawa and NCI-H441 cells. As complexes 1, 2, and 3 were not detectable with an oligonucleotide containing the LS −197/−204 mutation, and complexes 4 and 5 were not present with an oligonucleotide containing the LS−175/−183 mutation, it is very likely that two different binding sites for nuclear proteins lie in the region between −209 and −175. No qualitative difference could be observed between nuclear extracts from Ishikawa and NCI-H441 cells, no matter which oligonucleotide was used in the binding reactions. Thus, the different phenotypes that the linker scanning mutants LS −175/−183 and LS −192/−200 display during transient transfection into Ishikawa (six-to eightfold reduction of CAT activity) and NCI-H441 cells (no change in CAT activity) cannot be easily explained by a different repertoire of factors binding to DNA motifs affected by these two LS mutations. A similar phenomenon occurring in the E-cadherin promoter has been reported (Behrens et al., 1991). There are several possible explanations for this finding: (1) additional factors (e.g., coactivators) may generate the cell-specificity by protein-protein interactions; (2) specific activation or suppression factors; or (3) differentially expressed transcriptional activators and repressors may share the same DNA binding domain.
Two other promoter mutations that lie in that fifth region (LS−165/−173 and LS−148/−155) also influence CAT expression cell-specifically, but not as markedly, for example, as LS−175/−183. In Ishikawa cells, an approximately twofold reduced CAT activity is observed, whereas in NCI-H441 cells both mutant promoters behave like the wild-type promoter. In each of these two mutants, the half site of a palindromic sequence with the 7 bp perfect inverted repeat CAGTTTC is destroyed. A computer search in the EMBL databank for this palindrome revealed that it is conserved in the LTR of all murine leukemia viruses and proviruses (Khan and Theodore, 1987; Misseyanni et al., 1991). The functional relevance of this palindrome for the viral transcription machinery is unknown.
The sixth mutation-sensitive region, located around position −230, spans the sequence −234 CTTGCCACACCC −223. This sequence is identical in 12 out of 13 nucleotides to the GT-I motif of the SV-40 enhancer (Chiu et al., 1987; Johnson et al., 1987; Mercurio and Karin, 1989; Xiao et al., 1987). Several cell-specific as well as ubiquitous factors seem to bind to this motif (Xiao et al., 1987), among them TEF2 (Davidson et al., 1988), AP3 (Mercurio and Karin, 1989), EBP1 (Clark and Hay, 1989), and EBP20 (Jones et al., 1988). At least one of the factors that protects this uteroglobin promoter motif in vitro is extremely heat stable (unpublished data). The GT-I motif includes the CACCC box motif (Strahle et al., 1988), which is repeated 12 nucleotides further upstream. CACCC boxes are found in many enhancers and promoters, for instance in the human and mouse (3-globin promoters (Giglioni et al., 1989), but the factor(s) that binds to this motif has not yet been characterized or cloned.
The seventh, most upstream region that is sensitive to mutation is located around position −250. Both overlapping linker mutations (LS−249/−256 and LS−249/−257) selectively reduce CAT activity in Ishikawa cells but not in NCI-H441 cells. They destroy the UGUE motif that is repeated in inverse orientation in region V (see above), indicating that this element is indeed important for full promoter activity in Ishikawa cells. On the other hand, the adjacent mutation (LS−245/−252) destroys this sequence more severely but exhibits no reduced activity in Ishikawa cells. Thus, it seems that the distal UGUE is not absolutely necessary for the transient uteroglobin promoter activity in that cell line. LS −249/−256 and LS −249/−257 also destroy the right palindromic half site of a previously identified estrogen responsive element (Slater et al., 1990; Lopez de Haro et al., 1990). Therefore, it is possible that the mutations prevent binding of an endogenous Ishikawa cell estrogen receptor not present in the lung cell line NCI-H441. Although we have used estrogen-depleted, charcoal-stripped serum for all transfection experiments with Ishikawa cells, phenol red –known to have estrogenic properties – was present in the medium (Berthois et al., 1986; Croxtall et al., 1990). However, in DNase I foot-printing experiments, this region was protected by Ishikawa nuclear factors, and the protection could not be competed with an oligonucleotide that contains a consensus estrogen receptor binding site (unpublished data). Therefore, a factor different from the estrogen receptor binds to this region; the reduced promoter activity may be due to the prevention of the binding of this factor.
Comparison of rabbit with rat and human uteroglobin promoters
Recently we have isolated the rat, mouse, and human homologues to the rabbit uteroglobin gene (Hagen et al., 1990 and unpublished data). All three genes are expressed in lung Clara cells. Expression in the endometrium is also detectable in the rat and mouse, but to a much lesser extent than in rabbits (Hagen et al., 1990; Sandmöller etal., 1991). Comparison of the promoter regions of these genes with the rabbit uteroglobin promoter reveals that the regions I to IV are well conserved. Region V is only partially conserved (up to position −180), and region VI (GT-I motif) and region VII (ERE) completely diverge from the rabbit promoter. It thus appears that the more proximal promoter regions contain the information for the endometrium- and lung-specific expression of the uteroglobin genes in vivo. The weak expression of the rat and mouse genes in the uterus may reflect the lack of relevant elements in region V and VI.
In the present study, we have identified regulatory elements in the promoter of the rabbit uteroglobin gene that influence its activity in endometrial and lung epithelial cells. Further investigations are required to characterize and isolate the transcription factors that bind to these elements. The set of promoter mutants will also be very useful for experiments that address the interaction between upstream enhancer elements and the promoter.
Acknowledgments
M. Kalff-Suske is gratefully acknowledged for critical reading of the manuscript.
This work was supported by a grant from the Deutsche Forschungsgemeinschaft (Mu601/5-l) and by the Fonds der Deutschen Chemischen Industrie.
The costs of publishing this article were defrayed in part by the payment of page charges. This article must therefore be hereby marked “advertisement” in accordance with 18 USC Section 1734 solely to indicate this fact.
References
- Aumüller G., Seitz J., Heins W., and Kirchner C. (1985), Histochemistry 83, 413–417. [DOI] [PubMed] [Google Scholar]
- Behrens J., Löwrick O., Klein-Hitpass L., and Birchmeier W. (1991), Proc Natl Acad Sci USA 88,11495–11499. [DOI] [PMC free article] [PubMed] [Google Scholar]
- Berthois Y., Katzenellenbogen J. A., and Katzenellenbogen B. S. (1986), Proc Natl Acad Sci USA 83, 2496–2500. [DOI] [PMC free article] [PubMed] [Google Scholar]
- Birnboim H. C. and Doly J. (1979), Nucleic Acids Res 7, 1513–1523. [DOI] [PMC free article] [PubMed] [Google Scholar]
- Brüggemeier U., Kalff M., Franke S., Scheidereit C., and Beato M. (1991), Cell 64, 565–572. [DOI] [PubMed] [Google Scholar]
- Carthew R. W., Chodosh L. A., and Sharp P. A. (1985), Cell 43, 439–448. [DOI] [PubMed] [Google Scholar]
- Cato A. C. B., Miksicek R., Schütz G., Arnemann J., and Beato M. (1986), EMBO J 5, 2237–2240. [DOI] [PMC free article] [PubMed] [Google Scholar]
- Chiu R., Imagawa M., Imbra R. J., Bockoven J. R., and Karin M. (1987), Nature 329, 648–651. [DOI] [PubMed] [Google Scholar]
- Clark L. and Hay R. T. (1989), Nucleic Acids Res 17, 499–516. [DOI] [PMC free article] [PubMed] [Google Scholar]
- Croxtall J. D., Elder M. G., and White J. O. (1990), J Steroid Biochem 35, 665–669. [DOI] [PubMed] [Google Scholar]
- Davidson I., Xiao J. H., Rosales R., Staub A., and Chambon P. (1988), Cell 54, 931–942. [DOI] [PubMed] [Google Scholar]
- DeMayo F. J., Damak S., Hansen T. N., and Bullock D. W. (1991), Mol Endocrinol 5, 311–318. [DOI] [PubMed] [Google Scholar]
- Fernandez-Renau D., Lombardero M., and Nieto A. (1984), Eur J Biochem 144, 523–527. [DOI] [PubMed] [Google Scholar]
- Gazdar A. F., Linnoila R. I., Kurita Y., Oie H. K., Mulshine J. L., Clark J. C., and Whitsett J. A. (1990), Cancer Res 50, 5481–5487. [PubMed] [Google Scholar]
- Giglioni B., Comi P., Ronchi A., Mantovani R., and Ottolenghi S. (1989), Biochem Biophys Res Comm 164, 149–155. [DOI] [PubMed] [Google Scholar]
- Gorman C. D., Moffat L. F., and Howard B. H. (1982), Mol Cell Biol 5, 1044–1051. [DOI] [PMC free article] [PubMed] [Google Scholar]
- Graham F and van der Eb L. (1973), Virology 52, 456–487. [DOI] [PubMed] [Google Scholar]
- Hagen G., Wolf M., Katyal S. L., Singh G., Beato M., and Suske G. (1990), Nucleic Acids Res 18, 2939–2946. [DOI] [PMC free article] [PubMed] [Google Scholar]
- Hall C. V., Jacob P. E., Ringold G. M., and Lee F. (1983), J Mol Appl Genet 2, 101–109. [PubMed] [Google Scholar]
- Hanahan D. (1983), J Mol Biol 166, 557–580. [DOI] [PubMed] [Google Scholar]
- Jantzen K., Fritton H. P., Igo-Kemenes T., Espel E., Janich S., Cato A. C. B., Mugele K., and Beato M. (1987), Nucleic Acids Res 15, 4535–4552. [DOI] [PMC free article] [PubMed] [Google Scholar]
- Johnson P. F., Landschulz W. H., Graves B. J., and McKnight S. L. (1987), Genes Dev 1, 133–146. [DOI] [PubMed] [Google Scholar]
- Jones N. C., Rigby P. W. J., and Ziff E. B. (1988), Genes Dev 2, 267–281. [DOI] [PubMed] [Google Scholar]
- Khan A. S. and Theodore T. S. (1987), Nucleic Acids Res 15, 7640. [DOI] [PMC free article] [PubMed] [Google Scholar]
- Lopez de Haro M. S. and Nieto A. (1985), Biochem J 225, 255–258. [DOI] [PMC free article] [PubMed] [Google Scholar]
- Lopez de Haro M. S., Alvarez L., and Nieto A. (1988), Biochem J 250, 647–651. [DOI] [PMC free article] [PubMed] [Google Scholar]
- Lopez de Haro M. S., Garcia C., and Nieto A. (1990), FEBS Lett 265, 20–22. [DOI] [PubMed] [Google Scholar]
- Luckow B., Renkawitz R., and Schütz G. (1987), Nucleic Acids Res 15, 417–429. [DOI] [PMC free article] [PubMed] [Google Scholar]
- Luckow B. and Schütz G. (1989), Nucleic Acids Res 17, 8451–8462. [DOI] [PMC free article] [PubMed] [Google Scholar]
- Maire P., Wuarin J., and Schibler U. (1989), Science 244, 343–346. [DOI] [PubMed] [Google Scholar]
- Maniatis T., Fritsch E. F., and Sambrook J. (1982), Molecular Cloning: A Laboratory Manual. Cold Spring Harbor Laboratory Press, Cold Spring Harbor, NY. [Google Scholar]
- Mercurio F. and Karin M. (1989), EMBO J 8, 1455–1460. [DOI] [PMC free article] [PubMed] [Google Scholar]
- Misseyanni A., Klug J., Suske G., and Beato M. (1991), Nucleic Acids Res 19, 2849–2859. [DOI] [PMC free article] [PubMed] [Google Scholar]
- Mitchell P. J., Wang C., and Tjian R. (1987), Cell 50, 847–861. [DOI] [PubMed] [Google Scholar]
- Müller H. and Beato M. (1980), Eur J Biochem 112, 235–241. [DOI] [PubMed] [Google Scholar]
- Nishida M., Kasahara K., Kaneko M., and Iwasaki H. (1985), Nippon Sanka Fujinka Gakkai Zasshi (Acta Obstet Gynecol Jpn) 37, 1103–1111. [PubMed] [Google Scholar]
- Pierani A., Heguy A., Fujii H., and Roeder R. G. (1990), Mol Cell Biol 10, 6204–6215. [DOI] [PMC free article] [PubMed] [Google Scholar]
- Renkawitz R., ed. (1989), Tissue Specific Gene Expression, VCH Verlagsgesellschaft, Weinheim. [Google Scholar]
- Sandmöller A., Voss A. K., Hahn J., Redemann-Fibi B., Suske G., and Beato M. (1991), Mech Dev 34, 57–68. [DOI] [PubMed] [Google Scholar]
- Shapiro D. J., Sharp P. A., Wahli W. W., and Keller M. J. (1988), DNA 7, 47–55. [DOI] [PubMed] [Google Scholar]
- Singh H., Sen R., Baltimore D., and Sharp P. A. (1986), Nature 319, 154–158. [DOI] [PubMed] [Google Scholar]
- Slater E. P., Redeuilh G., Theis K., Suske G., and Beato M. (1990), Mol Endocrinol 4, 604–610. [DOI] [PubMed] [Google Scholar]
- Smith H. O. (1980), Methods Enzymol 65, 371–380. [DOI] [PubMed] [Google Scholar]
- Strähle U., Schmid W., and Schütz G. (1988), EMBO J 7, 3389–3395. [DOI] [PMC free article] [PubMed] [Google Scholar]
- Suske G., Wenz M., Cato A. C. B., and Beato M. (1983), Nucleic Acids Res 11, 2257–2271. [DOI] [PMC free article] [PubMed] [Google Scholar]
- Warembourg M., Tranchant O., Atger M., and Milgrom E. (1986), Endocrinology 119, 1632–1640. [DOI] [PubMed] [Google Scholar]
- Xiao J.-H., Davidson I., Macchi M., Rosales R., Vigneron M., Staub A., and Chambon P. (1987), Genes Dev 1, 794–807. [DOI] [PubMed] [Google Scholar]