Abstract
Expression of the murine homeobox gene Hox 1.6 rapidly increases in F9 teratocarcinoma cells when these cells are induced with retinoic acid to differentiate into primitive and parietal endoderm. Hox 1.6 encodes a putative transcriptional regulatory protein which may function as a secondary regulator of gene expression during the differentiation process. To examine the role of the Hox 1.6 gene, we have stably transfected F9 stem cells with a cDNA containing the complete coding sequence of Hox 1.6 under the control of the mouse metallothionein promoter. Two clonally distinct cell lines that express high levels of the transfected Hox 1.6 gene have been isolated and characterized. We show that expression of the transfected Hox 1.6 gene in F9 cells dramatically alters the stem cell morphology. However, the transfected cells do not differentiate in the absence of retinoic acid treatment, nor are they prevented from differentiating in response to such treatments. We therefore suggest that the Hox 1.6 gene controls the expression of genes which influence changes in F9 cell morphology during RA-induced differentiation.
The stem cells of malignant teratocarcinomas morphologically and biochemically resemble the totipotent cells (also called the inner cell mass cells) of the early mouse embryo (Martin, 1980). One of the best characterized teratocarcinoma cell lines is the F9 cell line. F9 stem cells grown in monolayer undergo limited spontaneous differentiation under normal culture conditions, but will differentiate into primitive endoderm-like cells when treated with physiological concentrations of retinoic acid (RA; Strickland and Mahdavi, 1978). Concurrent or subsequent addition of dibutyryl cyclic AMP (db-cAMP) induces F9 cells to terminally differentiate into parietal endoderm-like cells, although by itself db-cAMP does not induce F9 cell differentiation (Strickland et al., 1980).
The effects of RA are mediated by RA receptor (RAR) proteins, which are members of a family of structurally similar nuclear receptors for steroid and thyroid hormones (de Thé et al., 1987; Giguere et al., 1987; Petkovich et al., 1987; Zelent et al., 1989). These receptors, in conjunction with the appropriate ligand, bind specifically to DNA sequences and activate transcription of ligand-inducible target genes (Evans, 1988). Thus, RA acts, at least in part, to regulate the transcription of genes important for cell growth and differentiation.
Many genes which undergo changes in expression upon RA- or (RA+db-cAMP)-treatment have been identified in F9 cells (for review, see Gudas, 1991). For example, steady-state mRNA levels of c-myc (Dony et al., 1985; Griep and DeLuca, 1986; Dean et al., 1986) and Rex-1 (Hosler et al., 1989) rapidly decrease in response to RA treatment. In contrast, other genes, such as the RARP gene (Hu and Gudas, 1990), several homeobox-containing genes (Colberg-Poley et al., 1985; Murphy et al, 1988; LaRosa and Gudas, 1988a), the laminin B1 gene (Wang and Gudas, 1983), and the collagen IV gene (Wang and Gudas, 1983; Kurkinen et al., 1983) show increased expression in RACT-treated F9 cells. Some of these genes are directly regulated by RA and its receptor proteins, e.g., the laminin B1 gene (Vasios et al., 1989; Vasios et al., 1991) and the RARβ gene (de Thé et al., 1990; Sucov et al., 1990), whereas other genes are presumably activated or repressed secondarily by RA-induced transcriptional regulatory proteins.
The mouse homeobox-containing gene Hox 1.6 ii a good candidate for a secondary acttvator of gene expression in RA-treated F9 cells. Homeobox-containing genes encode transcriptional regulatory proteins that control morphogenesis in the developing mouse embryo (for review, see Holland and Hogan, 1988). LaRosa and Gudas (1988a) showed that steady-state levels of Hox 1.6 message (originally identified as Era-1) are low in F9 stem cells and dramatically increase in response to RA treatment. This increase in Hox 1.6 expression is rapid and independent of de novo protein synthesis, consistent with direct regulation by RA and its receptors. The Hox 1.6 gene contains two introns, one of which is alternatively spliced, resulting in two transcripts herein named Hox 1.6-993 and Hox 1.6-399 (originally designated Era-1-993 and Era-1-399, respectively; LaRosa and Gudas, 1988b). The numbers 993 and 399 indicate the length of the open reading frame encoded by each transcript. Hox 1.6-993 encodes the homeobox-containing protein, whereas Hox 1.6-399 encodes a putative homeobox-less protein due to a shift in the open reading frame (see Fig. 1). The functional significance of the homeobox-less protein is not known.
Figure 1.
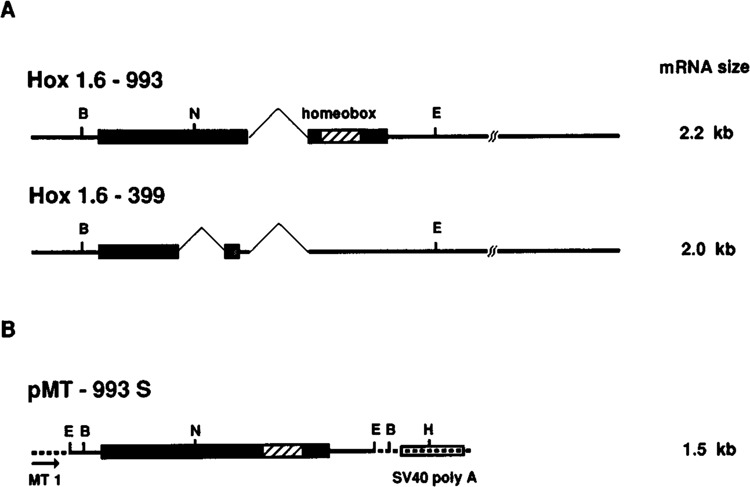
Schematic representations of the Hox 1.6 gene transcripts and the plasmid pMT-993S. A. Endogenous transcripts from the Hox 1.6 gene are depicted. Open reading frames are indicated by rectangles; introns are indicated with thin lines drawn at 45° angles. The stipled rectangle in the Hox 1.6-399 transcript represents a shift in the reading frame due to the alternative splice. B = BamH I; N = Nde I; E = EcoR I. B. The relevant portion of plasmid pMT-993S used to stably transfect wild-type F9 cells. The mouse metallothionein promoter (MT1), the Hox 1.6-993 cDNA, and the SV40 polyadenylation sequences are depicted. The 5′ EcoR I restriction site (E) in pMT-993S is from a linker attached to the Hox 1.6-993 cDNA (LaRosa and Gudas, 1988a). The 3′ EcoR I restriction site in pMT-993S corresponds to the 3′ EcoR I site within the Hox 1.6 gene. B = BamH I; N = Nde I; H = Hpa I.
To examine the potential role of Hox 1.6 as a secondary regulator of gene expression during F9 cell differentiation, we have stably transfected F9 stem cells with a cDNA encoding the homeobox-containing Hox 1.6 protein. We report that expression of Hox 1.6 protein dramatically alters F9 stem cell morphology but does not induce these cells to differentiate into primitive or parietal endoderm, or prevent them from differentiating in response to RA-treatment.
Materials and methods
Cell culture and differentiation
The murine F9 teratocarcinoma stem cell line and its transfected derivatives were grown in gelatinized flasks containing DMEM supplemented with 10% heat-inactivated bovine calf serum (Irvine Scientific) and 2 mM glutamine, and maintained at 37°C in 10% CO2 as described previously (Wang et al., 1985). To induce primitive endoderm differentiation, freshly trypsinized F9 cells were cultured for four to five hours to allow attachment, grown for 12 hours in the presence of 100 μM ZnCl2, and then cultured for various lengths of time in the presence of 1 μM all-trans retinoic acid (RA; Sigma) dissolved in 100% ethanol. Control stem cells were grown identically, except that appropriate amounts of ethanol only were added instead of RA. To induce parietal endoderm differentiation, cells were grown as before and treated with 1 μM RA, 100 μM N6,2′-Odibutyryladenosine 3′:5′-cyclic monophosphate, and 250 μM theophylline (RACT). CT treatment is treatment with the latter two compounds above.
Plasmids
The plasmid pMT-993S was constructed by inserting the 1.2 kb EcoR I restriction fragment from plasmid pERA-1-993 El.2 (LaRosa and Gudas, 1988a) that encodes the Hox 1.6-993 cDNA into the EcoR I site of the expression vector pMT64AA (see Fig. 1). The plasmid pMT64AA contains a portion of the mouse metallothionein I promoter (Glanville et al., 1982), followed by an SV40 poly(A) addition sequence. The pSV2neo plasmid (Southern and Berg, 1982) was co-transfected as a selection marker for the generation of stably transfected cells. The plasmids used for hybridization to the genes Hox 1.6 (pEra-1-993 El.2; LaRosa and Gudas, 1988a), laminin B1 (pcI56; Wang and Gudas, 1983), collagen IV (αl) (pcI5; Wang and Gudas, 1983), and actin (pAct-1; Spiegelman et al., 1983), have been described previously. To examine alternative splicing of the endogenous and transfected Hox 1.6 transcripts, the plasmid pGem-Hox 1.6-N/H was constructed by inserting the 850 bp Nde I/Hpa I restriction fragment from pMT993S into the Sma I site of pGem-4Z (Promega). All enzymes used in plasmid constructions were purchased from New England Bio-Labs.
Production and initial characterization of stably transfected cell lines
Approximately 4 × 10⁶ wild-type F9 cells were co-transfected with 40 μg of pMT-993S plasmid and 4 ng of pSV2neo using the calcium phosphate precipitation method (Graham and Vander Eb, 1973). Selection was carried out in medium containing 300 μg/ml of G418 sulfate (Gibco) for three weeks. Approximately 50 neomycin-resistant colonies were individually cloned, cultured in monolayer, and screened by Northern analysis for stable expression of the transfected Hox 1.6-993 cDNA. Two cell lines most strongly expressing the transfected Hox 1.6-993 cDNA were expanded and are designated F9-H1.6-5 and F9-H1.6-10. An F9 cell line stably transfected with the pSV2neo plasmid alone, designated F9-N-4, was cloned and propagated as a control.
Southern, Northern, RNase protection, and Western analyses
Genomic DNA was isolated from wild-type F9 cells and stably transfected F9 clonal lines as described by Herrmann and Frischauf (1987). Southern analysis was performed as described by Stoner and Gudas (1989), using randomly primed probes against the 5′ coding sequence of the Hox 1.6 gene. RNA from the stably transfected F9 clonal lines was isolated by the guanidine-isothiocyanate/CsCl method (Chirgwin et al., 1979). Northern analysis was performed as described by Ausubel et al. (1987), using Magna NT membrane (Micron Separations Inc.) and randomly primed probes (Stoner and Gudas, 1989). Amounts of RNA were quantitated by scanning autoradiograms with an LKB Ultroscan XL enhanced laser densitometer (Pharmacia), or by measuring radioactive decay of Northern blots using a Phosphorlmager (Molecular Dynamics). RNase protection experiments were performed as described by Ausebel et al. (1987), using a riboprobe transcribed from pGem-Hox 1.6-N/H linearized with Sph I. This probe spans the region between the Ndel site in the Hox 1.6 gene and the Hpal site in the SV40 polyadenylation sequences in pMT64AA (see Fig. 1).
Western analyses were performed with F9 whole cell extracts prepared as described by Vasios et al. (1989). Protein concentrations were determined by Bio-Rad protein micro-assays according to the manufacturer’s instructions. Equal amounts of protein (approximately 600 Mg per lane) were loaded onto 10% SDS-polyacrylamide gels and transferred to nitrocellulose as described by Ausebel et al. (1987). Affinity-purified anti-Hox 1.6 antiserum was isolated from guinea pigs injected with a synthetic peptide corresponding to a C-terminal region of the Hox 1.6 protein (Ab #135) and was used at a 1aOO-fold dilution to detect Hox 1.6 protein; this antiserum will be described in more detail elsewhere (A. Ait Aouane and L. Gudas, unpublished data). A monoclonal antibody raised against mouse E-cadherin (clone DECMA-1) was purchased from Sigma and used at the recommended dilution. Western blots were visualized with 125I-labeled protein A obtained from duPont NEN Research Products.
Immunofluorescent staining of F9 cells
5 × 10⁵ control or pMT-993S-transfected stem cells were grown in gelatinized 100 × 15 tissue culture plates (Lux, Marsh Biomedical Inc.) in the presence of 100 μM ZnCl2 for 36–48 hours, washed 3 times with PBS pre-warmed to 37°C, and fixed with 2% paraformaldehyde in PBS at 22°C for 20 minutes. Fixed cells were incubated with a monoclonal antibody against E-cadherin (DECMA-1; Sigma) for 2 hours at 4°C, washed three times for 10 minutes with cold PBS, incubated with an FITC-conjugated goat-anti-rat IgG (Sigma) for 1 hour at 4°C, and washed as before. Antibodies were diluted according to the manufacturer’s recommendations. Fluorescently labeled cells were visualized and photographed with a Zeiss microscope.
Results
Isolation of F9 stem cell lines expressing the stably transfected Hox 1.6-993 gene
To express the homeobox-containing Hox 1.6 protein in F9 stem cells, we constructed the plasmid pMT-993S. This plasmid contains the entire coding sequence of the Hox 1.6-993 gene under the control of the heavy metal-inducible mouse metallothionein I promoter. Approximately 1 Kb of 3′ untranslated sequence from the full-length Hox 1.6-993 cDNA was deleted in this construct so that the Hox 1.6-993 transfected transcript (1.5 Kb) could be distinguished from the Hox 1.6-993 (2.2 Kb) and Hox 1.6-399 (2.0 Kb) endogenous transcripts (see Fig. 1). F9 stem cells were co-transfected with pMT-993S and the plasmid pSV2neo, followed by selection in G418-sulfate. Two separately isolated clonal lines expressing the transfected Hox 1.6-993 cDNA, designated F9-H1.6-5 and F9-H1.6-10, and a control cell line transfected with pSV2neo alone, designated F9-N-4, were chosen for further study.
Southern analysis of the stably transfected lines
Genomic DNA was isolated from F9 wild-type cells, from control F9-N-4 cells, and from F9-Hl.6-5 and F9-H1.6-10 cells. DNA was digested with restriction enzymes and analyzed by Southern blot (Fig. 2). A 1.9 Kb BamH I restriction fragment encoding the single-copy endogenous Hox 1.6 gene was detected within the restriction patterns of each cell line, indicating that the transfected cDNA did not integrate into the endogenous gene. A 1.2 Kb restriction fragment detected in the genomic DNAs from F9-H1.6-5 and F9-H1.6-10 cells corresponded to the integrated Hox 1.6-993 cDNA insert. The intensity of the 1.2 Kb restriction fragment versus the 1.9 Kb restriction fragment indicated that at least 25 copies of the Hox 1.6-993 cDNA had stably integrated in the F9-H1.6-5 cell line, whereas only one copy had stably integrated in the F9-Hl.6-10 cell line. This latter observation confirmed that cell lines F9-H1.6-5 and F9-H1.6-10 were clonally distinct. Several bands of DNA larger than 1.2 Kb were detected in DNA isolated from F9-H1.6-5 cells. These bands probably resulted from partial digestion of the genomic DNA.
Figure 2.
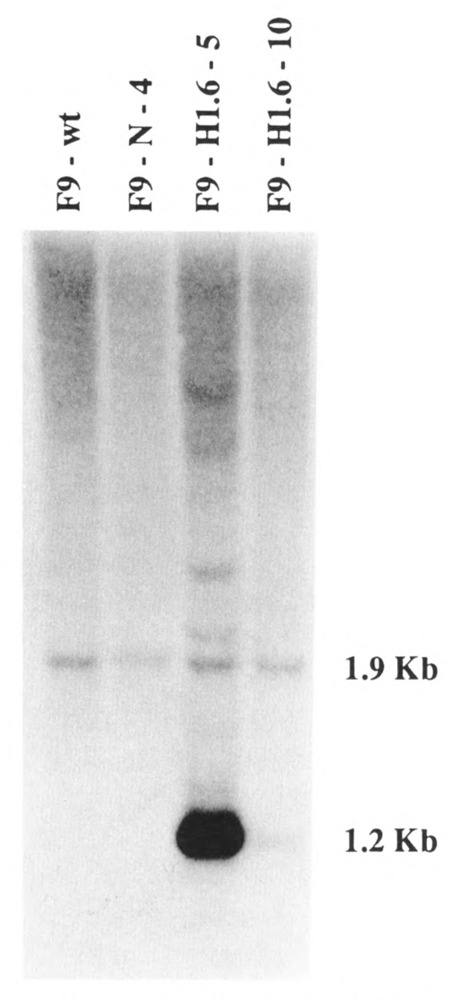
Southern analysis of the pMT-993S-transfected cell lines. Genomic DNA isolated from wild-type F9 cells (F9-wt) and from the transfected cell lines F9-N-4, F9-Hl.6-5, and F9-H1.6-10 was digested with BamH I and analyzed by Southern blot. The DNA on the Southern blot was hybridized to randomly primed probe to the translated portion of the Hox 1.6 cDNA. The 1.9 Kb fragment corresponds to the endogenous Hox 1.6 gene, and the 1.2 Kb fragment corresponds to the integrated Hox 1.6-993 cDNA insert. Exposure time was 24 hours at −70°C with an intensifying screen.
Growth analysis of the stably transfected cell lines
To determine if expression of the Hox 1.6-993 cDNA affected the growth rate of F9 cells, growth curves for F9-N-4 control cells and for cells from the Hox 1.6-993 transfected lines F9-H1.6-5 and F9-H1.6-10 were compared. Cells were grown in monolayer in the presence of 100 μM ZnCl2 for three days, either in the absence or presence of 1 μM RA and 100 μM db-cAMP plus 250 μM theophylline (RACT), and counted at 24-hour intervals. F9-N-4, F9-H1.6-5, and F9-Hl.6-10 cells had similar generation times of approximately 16 hours in the absence of RACT treatment, and all lines displayed identical decreases in growth rates during RACT-induced differentiation (data not shown). Thus, expression of the transfected Hox 1.6-993 cDNA does not affect the growth rate of F9 cells.
Expression of the Hox 1.6-993 gene in stably transfected cells
F9-N-4 and F9 cells transfected with Hox 1.6-993 were grown in monolayer with and without RACT treatment. All experiments were done in the presence of 100 μM ZnCl2 to insure maximal expression of the transfected Hox 1.6 cDNA. Experiments done in the absence of exogenously added ZnCl2 are not discussed since theMT1 promoter regulating expression of the transfected Hox 1.6 cDNA is significantly active under these conditions, presumably due in part to trace amounts of ZnCl2 present in the growing medium (J. A. Goliger, unpublished observations; Kim and Wold, 1985; Pecorino et al., 1988). RNA was harvested at various times of growth and analyzed by Northern blot for expression of the transfected and endogenous Hox 1.6 ttanscripts (Fig. 3). Results showed that the transfected message is expressed in both the F9-H1.6-5 and F9-H1.6-10 cell lines. At early times after plating, the level of transfected Hox 1.6-993 mRNA expressed in F9-H1.6-10 cells is comparable to the level of endogenous Hox 1.6 gene expression in F9 cells treated with RACT for 12 to 24 hours (see below). The level of transfected Hox 1.6-993 mRNA in F9-H1.6-5 cells was approximately four- to fivefold lower than the level observed in F9-H1.6-10 cells. F9-H1.6-5 cells contain at least 25 times more stably integrated Hox 1.6-993 cDNA than F9-H1.6-10 cells, suggesting that much of the transfected cDNA in F9-H1.6-5 cells is not expressed, perhaps because it has integrated into transcriptionally inactive regions of the chromatin. Relative steady-state mRNA levels of the transfected Hox 1.6-993 cDNA in both cell lines remained fairly constant during 48 hours of growth in the absence of RACT-treatment, but a two- to threefold decrease in expression was observed at the final 72-hour time point (Figure 3B). This decrease in expression may be partially due to a cell density-dependent depletion of ZnCl2. Experiments in which ZnCl2 was replenished after 48 hours of growth showed a small but significant increase in Hox 1.6-993 cDNA message levels at 72 hours (data not shown).
Figure 3.
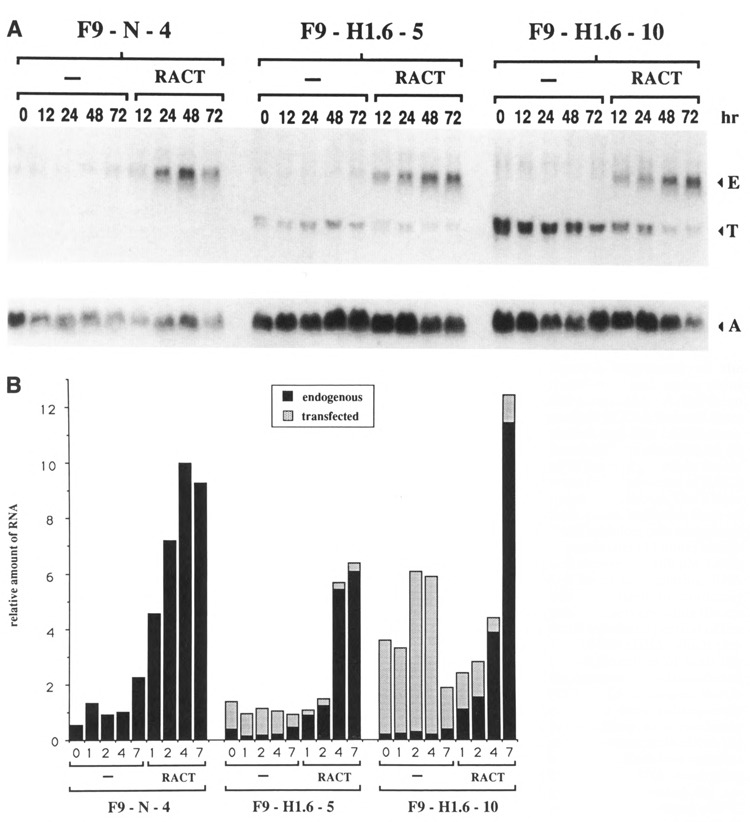
Expression of the transfected and endogenous Hox 1.6 mRNAs. A. Northern analysis of RNA isolated from control and Hox 1.6-993-transfected cell lines after 0,12,24,48, or 72 hours of growth in the absence (−) or presence of RACT-treatment is shown. The 0 hour time point indicates time of RACT addition; cells were plated approximately 16 hours earlier and exposed to 100 μM ZnCl2 4–5 hours after plating. RNA was hybridized to randomly primed insert encoding the entire 5′ translated portion of the Hox 1.6-993 cDNA, which permitted detection of both the endogenous (E) and transfected (T) Hox 1.6 messages. Northern blots were subsequently re-hybridized to a randomly primed mouse actin cDNA (A) as a control. Each lane contains 25 μg of total RNA. Autoradiograms were exposed for approximately 24 hours at −70°C with an intensifying screen to detect Hox 1.6 transcripts; autoradiograms were exposed for approximately 8 hours under similar conditions to detect actin transcripts. Northern analyses of these lines were performed three times with qualitatively similar results. B. Quantitative analysis of the Northern blot shown in A. Amounts of the transfected Hox 1.6-993 transcript and the endogenous Hox 1.6 transcript are relative to amounts of actin message and are plotted as a percent of the maximal amount of endogenous Hox 1.6 expression observed in the control F9-N-4 cell line.
RACT-treatment of the F9-H1.6-5 and F9-H1.6-10 cell lines decreased expression of the transfected Hox 1.6-993 cDNA to less than half the levels observed in the corresponding stem cells. This lower level of expression may reflect a differentiation-dependent decrease in the activity of the metallothionein promoter. RACT-treatment also resulted in increased expression of the endogenous Hox 1.6 mRNA (both Hox 1.6-993 and Hox 1.6-399 message, which cannot be resolved by Northern analyses). The relative levels of endogenous Hox 1.6 mRNA appeared lower in both pMT-993S transfected cell lines than in the control F9-N-4 line (Fig. 3); however, this result was seen only in some experiments and was due to experimental variation. We therefore believe that expression of the transfected Hox 1.6-993 gene does not significantly influence RACT-induced expression of the endogenous Hox 1.6 gene.
Alternative splicing of the Hox 1.6 mRNA
The pMT993S plasmid used to stably transfect F9 cells expresses the Hox 1.6-993 transcript, and thus contains the alternative splice donor and acceptor sites to produce the Hox 1.6-399 transcript (Fig. 1). RNA was therefore examined to determine if the transfected Hox 1.6-993 transcript was spliced, and if stable expression of the transfected Hox 1.6-993 transcript affected alternative splicing of the endogenous Hox 1.6 gene transcripts.
A riboprobe which spans the region between the 3′ alternative splice site consensus sequence and the 3′ EcoR I site of pMT-993S was used in RNAse protection experiments in order to resolve the four possible transcripts. The 5′ end of this riboprobe is complementary to pMT64AA plasmid sequences encoding the SV40 polyadenylation site (see Materials and Methods) and is thus protected by hybridization to the 993 transfected transcript but is not protected by hybridization to the 993 endogenous transcript. Results of the RNase protection experiments (Fig. 4) show that less than 5% of the transfected Hox 1.6-993 transcript is alternatively spliced to produce the Hox 1.6-399 mRNA, compared to 25–35% of the endogenous Hox 1.6 transcript. Indeed, the transfected transcript might not undergo any alternatively splicing, since the faint RNA bands detected at the position expected for the Hox 1.6-399 transfected transcript may simply be degradation products of the fully protected riboprobe. RNase protection experiments additionally demonstrated that expression of the transfected Hox 1.6-993 cDNA does not obviously affect post-transcriptional processing of the endogenous Hox 1.6 gene transcripts.
Figure 4.
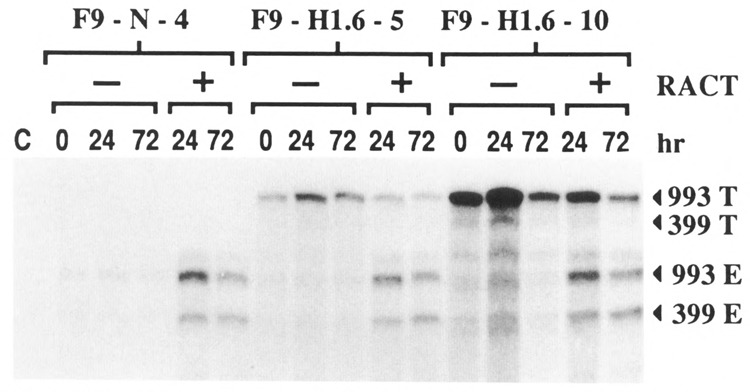
Alternative splicing of the messages encoded by the Hox 1.6 gene. RNase protection experiments were performed as described in the text to examine alternative splicing of the transfected and endogenous Hox 1.6 gene transcripts. 15 μg of the RNA described in Figure 2 were used per reaction. Bands corresponding to the homeobox containing transfected message (993 T), the homeobox-less transfected message (399 T), the homeobox-containing endogenous message (993 E), and the homeobox-less endogenous message (399 E) are indicated. This experiment was performed two times with identical results.
Expression of the Hox 1.6 protein in the stably transfected cell lines
Western analyses of control and Hox 1.6-993-transfected cells were performed to confirm that the transfected Hox 1.6-993 transcript was translated into protein. Whole cell extracts were prepared from each cell line grown in monolayer culture in the presence of ZnCl2 alone or in the presence of ZnCl2 + RACT for the lengths of time indicated (Fig. 5). The antiserum used in the Western analyses was raised against a synthetic peptide corresponding to the C-terminus of the homeobox-containing protein (designated Hox 1.6 protein) and was not expected to detect the putative homeobox-less gene product of the Hox 1.6-399 transcript. Hox 1.6 protein was not detected in extracts of control F9-N-4 stem cells, but was detected in extracts made from F9-N-4 cells treated with RACT. Hox 1.6 protein was clearly detected in the F9-H1.6-5 and F9-H1.6-10 stem cells at 0 and 24 hours after plating, but barely detected in the stem cells of these lines which had grown for 72 hours after plating. This decrease in Hox 1.6 protein levels at 72 hours parallels the decrease in transfected Hox 1.6-993 RNA levels (Fig. 3) and thus may partially result from a cell-density dependent decrease in ZnCl2 concentrations. We estimate that F9-H1.6-10 stem cells (at the time of plating) express approximately fourfold more Hox 1.6 protein than F9-H1.6-5 stem cells, consistent with the observation that F9-H1.6-10 stem cells express four to five times more of the transfected Hox 1.6-993 message than F9-H1.6-5 cells. Hox 1.6 protein was also detected in F9-H1.6-5 and F9-H1.6-10 cells treated with RACT. The amount of protein detected in either of the Hox1.6-993-transfected cell lines after 24 hours of RACT treatment is approximately 1.5- to 2-fold less than amounts detected in the corresponding stem cells, presumably reflecting the RACT-dependent decrease in expression of the transfected Hox 1.6-993 cDNA. The amount of Hox 1.6 protein detected in 72-hour-RACT-reated F9-H1.6-10 cells is only about 1.5-fold greater than the amount detected in similarly treated F9-N-4 cells. This is consistent with the observation that at such late times of RACT treatment, F9-H1.6-10 cells express relatively low levels of the transfected Hox 1.6-993 cDNA, but express the endogenous Hox 1.6 gene at levels comparable to control F9-N-4 cells.
Figure 5.
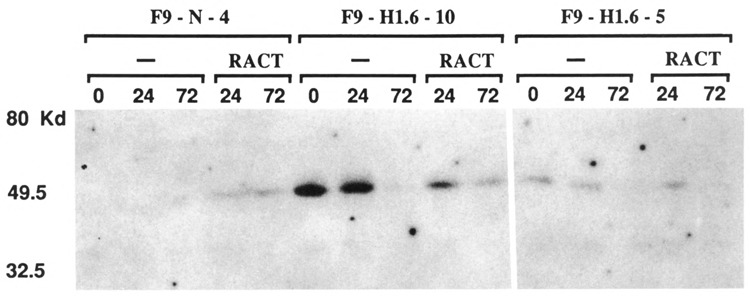
Western analysis of the Hox 1.6 protein. Western analysis of the Hox 1.6 protein in control and pMT-993S-transfected cells is shown. Cells were grown as described in Figure 2 and harvested after 0, 24, or 72 hours of treatment, as indicated. 600 μg of total cell protein were resolved by SDS-PAGE, transferred to nitrocellulose, probed with a polyclonal antisera to Hox 1.6 (see Materials and Methods), and visualized using 125I-labeled protein A; exposure time was 21 days. This experiment was performed two times. Qualitatively similar results were observed in both experiments for all extracts except from F9-H 1.6-5 cells treated with RACT for 72 hours; a second experiment detected amounts comparable to those observed in control F9-N-4 cells treated with RACT for 72 hours (data not shown).
Although the amounts of Hox 1.6 protein in the Hox 1.6-993-transfected cell lines correlate well with the amounts of transfected Hox 1.6-993 transcript, Hox 1.6 protein levels do not reflect total (transfected plus endogenous) Hox 1.6-993 message levels. For example, the total amount of Hox 1.6-993 message in F9-H1.6-5 stem cells after 0 or 24 hours of growth is less than 15% of the total amount of endogenous Hox 1.6 message expressed in F9-N-4 cells treated with RACT for 72 hours, but the amounts of Hox 1.6 protein are nearly identical. Similarly, the total amount of Hox 1.6-993 message in F9-H1.6-10 stem cells after 0 or 24 hours of growth is about 50% of the total amount of Hox 1.6 message present in RACT-treated F9-N-4 cells grown for 72 hours (Fig. 3B), yet F9-H1.6-10 stem cells express approximately five times more Hox 1.6 protein. Although some (25–35%) of the endogenous transcript is alternatively spliced into the Hox 1.6-399 message, this alone does not account for the discrepancy between total Hox 1.6 mRNA levels and Hox 1.6 protein levels. Alternative explanations are discussed below.
Hox 1.6 expression affects the growth morphology of F9 cells
RA-induced differentiation of F9 cells in mono-layer involves striking changes in morphology. F9 stem cells are small and typically grow as densely packed clusters with indistinct cell boundaries (Fig. 6A and D). Within 72 hours of growth in the presence of RA, cells enlarge, separate, and develop processes extending from the cell bodies (Fig. 6G). If db-cAMP is also present, cells become rounded and morphologically resemble parietal endoderm cells (Fig. 6J).
Figure 6.
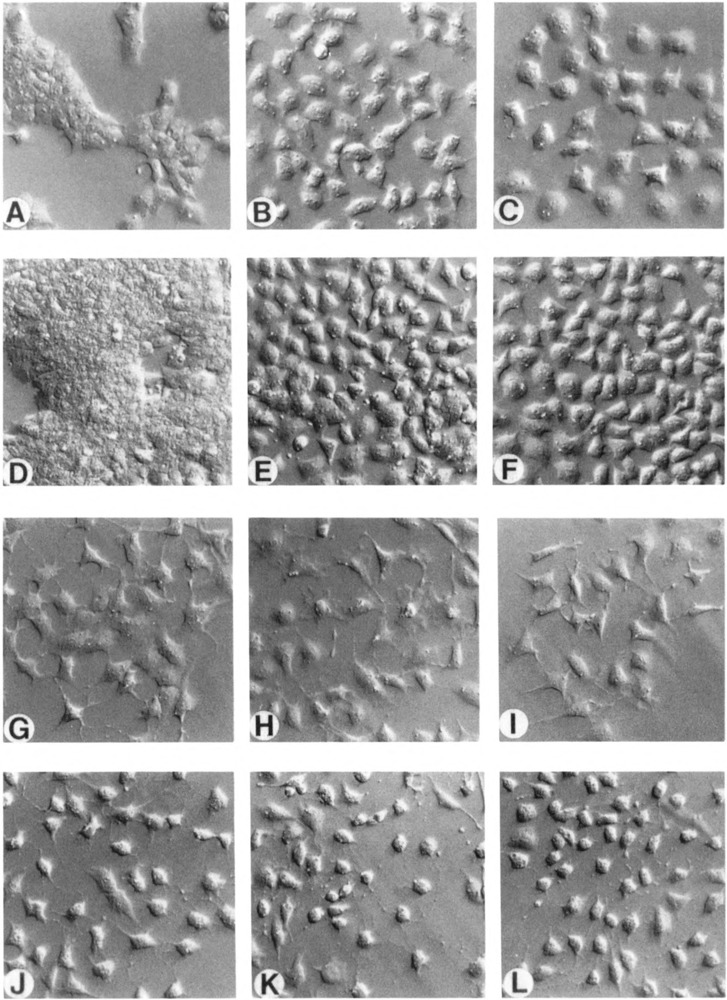
Growth morphology of control and pMT-993S transfected cells. F9-N-4 (A, D, G,J), F9-H1.6-5 (B, E, H, K), and F9-H1.6-10 (C, F, I, L) cells were grown for two (A–C) or four (D–L) days in the presence of 100 μM ZnCl2 alone (A–F), ZnCl2 + 1μM RA (G–I), or ZnCl2 + RACT (J–L), rinsed with warm PBS, and photographed with a Nikon inverted microscope equipped with Hoffman optics. Magnification is 200×.
The stem cell morphology of the control F9-N-4 cell line is indistinguishable from wild-type F9 cells. In contrast, both Hox 1.6-993-transfected cell lines display stem cell morphologies which are similar to each other but which differ strikingly from control cells. In the absence of RA, and at early times after plating when cells are at low cell densities (24–36 hours), F9-H1.6-5 and F9-H1.6-10 stem cells grow as isolated cells rather than as tightly packed clusters (Figs. 6B and C). After further growth in monolayer culture when cells are denser (48–60 hours), the Hox 1.6-993-transfected cell lines will retain this altered morphology, but some cells begin to display tight cellular associations with less distinct cell borders (Figs. 6E and F). If cells are cultured to very high densities (72–96 hours), the growth morphology of the Hox 1.6-993-transfected cell lines more closely resembles that of the control F9-N-4 stem cells (data not shown). Loss of the altered growth morphology at these late times in culture is consistent with the lack of detectable Hox 1.6 protein in the Hox 1.6-993-trans-fected cells at these times (Fig. 5).
The morphologies of F9-N-4, F9-H1.6-5, and F9-H1.6-10 cells grown in monolayer and treated with RA, RACT, or CT (dibutyryl cAMP and theophylline) were also examined. RA- and RACT-treated Hox 1.6-993-transfected cells were indistinguishable from the F9-N4 control cells (Figs. 6G–L), as might be expected, since these treatments induce endogenous Hox 1.6 gene expression. CT-treated cells were morphologically identical to the corresponding stem cells (data not shown).
Expression of the laminin B1 and collagen IV (α1) genes in stem and RACT-treated cells
The morphology of Hox 1.6-993-transfected stem cells resembles the morphology of RACT-treated wild-type F9 cells (compare Figs. 6B and 6J). We thus examined F9-H1.6-5 and F9-H1.6-10 cells for expression of the laminin B1 and collagen IV (α1) genes, two markers of mature parietal endoderm, to determine if these cells had differentiated in the absence of RA-treatment. Results of the Northern analysis showed that untreated Hox 1.6-993-transfected stem cells do not express the laminin B1 gene or the collagen IV (α1) gene at levels associated with differentiation (Fig. 7). Thus, expression of the Hox 1.6 protein in F9 stem cells did not induce mature parietal endoderm differentiation in the absence of RA treatment.
Figure 7.
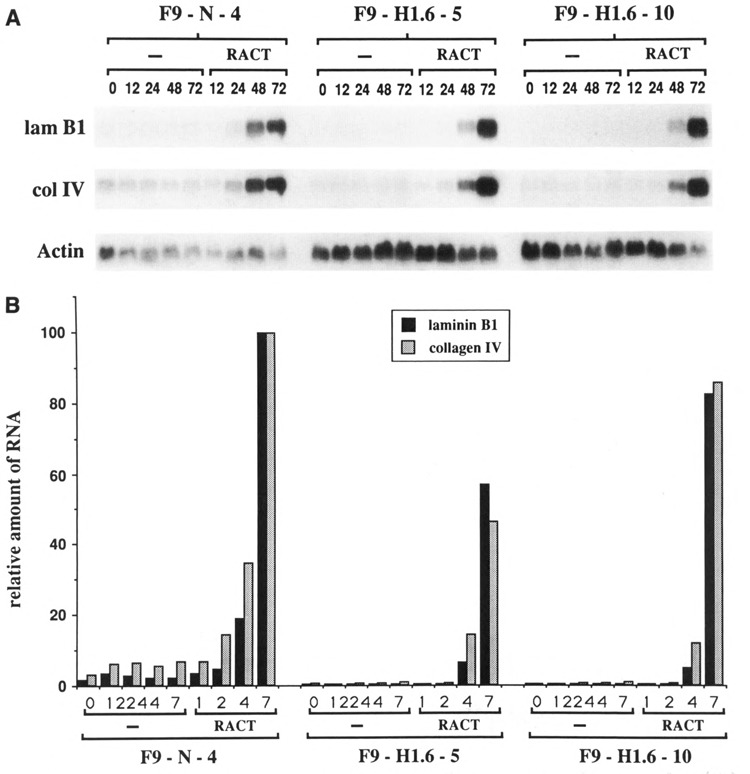
Expression of laminin B1 and collagen IV (α1) genes. A. Northern analysis of laminin B1 (lam Bl) and collagen IV (αl) (col IV) mRNAs is shown. Blots described in Figure 2 were hybridized to randomly primed laminin B1 or collagen IV cDNAs. Autoradiographs were exposed at −70°C with an intensifying screen for approximately 12 hours. Northern blots were performed three times with qualitatively similar results. B. Quantitative analysis of the Northern shown in A. Amounts of laminin Bl and collagen IV message are relative to amounts of actin message and are plotted as a percent of the maximal amount of expression observed in the control F9-N-4 cell line.
The absolute levels of laminin B1 and collagen IV mRNA expression in control F9-N-4 cells and in F9H1.6-5 and F9-H1.6-10 cells showed significant experimental variation. However, all lines exhibited a 40- to 50-fold increase in expression of these genes when treated with RACT for 48–72 hours, indicating that F9-H1.6-5 and F9-H1.6-10 cells are able to differentiate into mature parietal endoderm. In addition, Hox 1.6-993-transfected F9 cells are not like primitive endoderm cells (i.e., cells treated only with RA), since CT-treatment for 72 hours did not induce high levels of laminin B1 or collagen IV (α1) gene expression in these cells (data not shown).
Expression of E-cadherin in pMT-993S-transfected stem cells
The morphology of F9-H1.6-5 and F9-H1.6-10 stem cells suggests that these cells have altered cell-cell adhesion properties. E-cadherin, a calcium-dependent cell adhesion molecule, is believed to be the primary adhesion molecule controlling cell-cell adhesion in F9 stem cells (Yoshida and Takeichi, 1982). In fact, wild-type F9 stem cells disrupted in E-cadherin-mediated adhesion grow as distinct and separate cells (Yoshida and Takeichi, 1982) and exhibit a morphology which closely resembles Hox 1.6-993-transfected cells. In the developing mouse embryo, E-cadherin is present on the cells of the inner cell mass but is not expressed by extra-embryonic parietal endoderm cells (Damjanov et al., 1986), which is consistent with its decreased expression in F9 cells at late times of RACT-induced differentiation (J. A. Goliger and L. J. Gudas, unpublished observations). We therefore wanted to determine if expression of the Hox 1.6 protein altered expression or membrane localization of E-cadherin.
Control and Hox 1.6-993-transfected cells were grown in monolayer in the presence of ZnCl2, fixed, and examined for the presence of E-cadherin using immunofluorescence microscopy (Fig. 8A). Control F9-N-4 cells at both low and high densities displayed the expected pattern of intense immunofluorescent staining outlining the periphery of each cell. F9-H1.6-5 and F9-H1.6-10 cells displayed two different patterns of E-cadherin staining, depending on the density of cell growth. At low cell densities, Hox 1.6-993-transfected cells did not stain around the entire peripheral edge, but instead expressed E-cadherin in more localized regions. Closer inspection of these sparsely growing cells suggested that E-cadherin was primarily localized in small cytoplasmic processes that were possibly in contact with neighboring cells. At higher cell densities, F9-H1.6-5 and F9-H1.6-10 cells expressed and localized E-cadherin in a manner identical to control cells.
Figure 8.
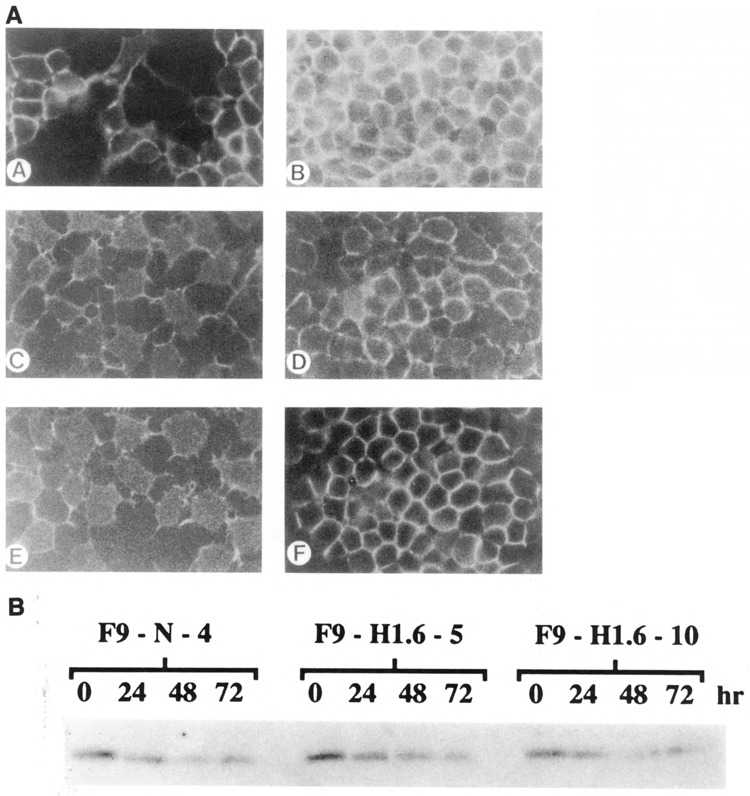
Expression and localization of E-cadhherin. A. E cadherin expression and localization were detected by immunofluorescent staining of F9-N-4 (A, B), F9-H1.6-5 (C, D), and F9-H1.6-10 (E, F) stem cells growing at either low (A, C, E) or high (B, D, F) cell densities, as described in the text. Two-second exposures are shown for all cells. B. A Western analysis of E-cadherin is shown. Control and pMT-993S-transfected cells were grown in the presence of 100 μM ZnCl2 for indicated times. 500 μg of total cell protein were used per lane. Protein was visualized with 125I-labeled Protein A; autoradiographs were exposed for five days.
The immunofluorescent staining intensity of the Hox 1.6-993-transfected cells suggested that these cells were expressing less E-cadherin than control cells. To quantitate amounts of E-cadherin, we performed Western analyses using whole cell protein extracts (Fig. 8B). No differences in the amount of E-cadherin expression were detected between control and Hox 1.6-993-transfected cells. Therefore, since Hox 1.6-993-transfected cells growing at sub-confluent cell densities expressed normal amounts of E-cadherin and localized it to the membrane, albeit to more localized regions, we conclude that the altered growth morphology of the Hox 1.6-993-transfected stem cells does not result from a defect in E-cadherin expression or membrane localization.
Discussion
In the present investigation, we have examined the relationship between Hox 1.6 gene expression and RACT-induced F9 teratocarcinoma cell differentiation. Previous work from our laboratory has shown that the Hox 1.6 gene is likely to be directly regulated by RA and its receptor proteins, and may therefore mediate, in part, the ability of RA to induce F9 cell differentiation (LaRosa and Gudas, 1988a,b). We reasoned that expression of the homeobox-containing Hox 1.6 protein in the absence of RA treatment might activate (or repress) Hox 1.6 target genes and result in an observable phenotype. Two clonally distinct cell lines stably transfected with the Hox 1.6-993 cDNA were isolated and characterized. Both cell lines expressed significant levels of Hox 1.6 protein in the absence of RA treatment. Since both transfected cell lines displayed similar stem cell morphologies which differed from control F9-N-4 stem cells, and since these morphological differences were less apparent at times when little or no Hox 1.6 protein was detected (72 hours after plating), we conclude that the altered growth morphology of the pMT-993S-transfected cells compared to control cells results from expression of Hox 1.6 protein. Moreover, since the altered morphology of F9-H1.6-5 and F9-H1.6-10 stem cells resembles RACT-treated wild-type F9 cells, we suggest that the Hox 1.6 gene may regulate the expression of genes which influence changes in F9 cell morphology during RA-induced differentiation.
At present it is unclear why the total amount of Hox 1.6-993 message in a cell did not correlate well with the amount of detectable Hox 1.6 protein. The data suggest that the transfected message is more efficiently translated into protein than the endogenous transcript so that low levels of transfected message produce high levels of Hox 1.6 protein. The increased translation efficiency of the transfected transcript may be related to the fact that it lacks much of the 3′ untranslated portion of the endogenous Hox 1.6 transcript.
It is also presently unclear why the transfected Hox 1.6-993 cDNA transcript is not spliced at the alternative intron to the same extent that the endogenous transcript is spliced. The transfected Hox 1.6-993 cDNA lacks the other intron present in the endogenous gene, suggesting that splicing of the alternative intron may first require splicing of this other intron. Although it is generally believed that sequential splicing of multiple introns from a precursor RNA does not require a strict order (Nordstrom et al., 1979; Berget and Sharp, 1979), it is possible that the second intron affects the secondary structure of the Hox 1.6 precursor RNA to allow splicing of the alternative intron (Eperon et al., 1988). Alternatively, the loss of this other intron, as well as the lack of 3′ untranslated sequences, may simply decrease the length of time required to transcribe, process, and transport the transfected Hox 1.6-993 message to the cytoplasm, thus permitting it to leave the nucleus before splicing can occur.
Stable expression of the Hox 1.6 protein did not induce F9 cells to differentiate in the absence of RA-treatment, or in the presence of CT-treatment. One possible explanation is that the untreated (and CT-treated) Hox 1.6-993-transfected cells did not express the Hox 1.6-399 transcript which may be required for F9 cell differentiation; a regulatory role for the putative homeobox-less gene product has been previously suggested (LaRosa and Gudas, 1988b). An alternative explanation, which we favor, is that expression of the Hox 1.6 gene is not sufficient to induce F9 cell differentiation in the absence of RA treatment, i.e., Hox 1.6 is not the only important regulatory gene in F9 cells. It seems unlikely that RA would induce F9 cell differentiation by simply activating only one transcriptional regulator. Indeed, RA is believed to directly regulate laminin B1 expression at late times of F9 cell differentiation (Vasios et al., 1989 and 1991). However, it is also likely that RA alone does not directly regulate all of the changes in gene expression accompanying F9 cell differentiation. Our results suggest that RA directly activates expression of the Hox 1.6 gene, which then induces (or represses) the expression of genes specifying morphological changes associated with F9 cell differentiation.
The altered growth morphology of Hox 1.6-993-transfected cells is probably not due to changes in expression or membrane localization of the cell adhesion molecule E-cadherin. Sparse cultures of Hox 1.6-993-transfected cells synthesized amounts of E-cadherin equivalent to control cells, and were able to localize it to the membrane. Thus, the unusual immunofluorescent staining pattern of these sparse F9-H1.6-5 and F9-H1.6-10 cells is presumably a result of their altered growth morphologies. In tightly associated cells, the intensity of immunofluorescent staining around cell-cell borders reflects the sum of E-cadherin expressed along the vertical lateral cell surfaces of two adjoining cells. Since sparsely growing Hox 1.6-993-transfected cells are separate and thus may not have as extensive a lateral cell surface as tightly adhering cells, the decreased immunofluorescent staining pattern of the Hox 1.6-993-transfected cells may be entirely consistent with their morphology.
How then might expression of the Hox 1.6 protein in the absence of RA cause a change in the growth morphology of F9 cells? Some possibilities include altering expression of (1) cytoskeletal proteins, (2) other cell adhesion molecules, and (3) factors involved in cell motility. We are currently attempting to determine the biochemical basis for the altered growth morphology of the Hox 1.6-993-transfected F9 cells by identifying target genes regulated by the Hox 1.6 gene in F9 cells. Such experiments will undoubtedly provide insights into the molecular mechanisms by which homeobox-containing genes control pattern formation in the developing embryo, as evidenced by the elegant recent work in which disruption of the Hox 1.6 gene resulted in numerous structural abnormalities of the brain, inner ears, and bones of the skull (Lufkin et al., 1991; Chisaka et al., 1992).
Acknowledgments
We thank Allison Ait-Aouane for providing us with affinity-purified antibody against Hox 1.6 protein and Dr. Susan Braunhut for expert assistance with Hoffman optical interference microscopy. We are grateful to members of the Gudas laboratory for helpful discussions and for critical reading of this manuscript. This work was supported by NIH grant R01 CA39036 to L. J. Gudas and an American Cancer Society Fellowship to J. A. Goliger.
The costs of publishing this article were defrayed in part by the payment of page charges. This article must therefore be hereby marked “advertisement” in accordance with 18 USC Section 1734 solely to indicate this fact.
Jeffrey A. Goliger is currently in the Department of Anatomy and Cell Biology, Harvard Medical School, 220 Long-wood Ave., Boston, MA 02115.
References
- Ausebel F. M., Brent R., Kingston R. E., Moore D. D., Seidman J. G., Smith J. A., and Struhl K., eds. (1987), Current Protocols in Molecular Biology. Greene Publishing Associates and Wiley-Interscience, New York. [Google Scholar]
- Berget S. M. and Sharp P. A. (1979), J Mol Biol 129, 547–565. [DOI] [PubMed] [Google Scholar]
- Chirgwin J. M., Przybyla A. E., MacDonald R. J., and Rutter W. J. (1979), Biochemistry 18, 5294–5299. [DOI] [PubMed] [Google Scholar]
- Chisaka O., Musci T. S., and Capecchi M. R. (1992), Nature 355, 516–520. [DOI] [PubMed] [Google Scholar]
- Colberg-Poley A., Voss S., Chowdhury K., and Gruss P. (1985), Nature 314, 731–738. [DOI] [PubMed] [Google Scholar]
- Damjanov I., Damjanov A., and Damsky C. (1986), Dev Biol 116, 194–202. [DOI] [PubMed] [Google Scholar]
- Dean M., Levine R. A., and Campisi J. (1986), Mol Cell Biol 6, 518–524. [DOI] [PMC free article] [PubMed] [Google Scholar]
- de Thé H., Marchio A., Tiollais P., and Dejean A. (1987), EMBO J 8, 429–433. [DOI] [PMC free article] [PubMed] [Google Scholar]
- de Thé H., Vivanco M., Tiollais P., Stunnenberg H., and Dejean A. (1990), Nature 343, 177–180. [DOI] [PubMed] [Google Scholar]
- Dony C., Kessel M., and Gruss P. (1985), Nature 312, 636–639. [DOI] [PubMed] [Google Scholar]
- Eperon L. P., Graham I. R., Griffiths A. D., and Eperon I. C. (1988), Cell 54, 393–401. [DOI] [PubMed] [Google Scholar]
- Evans R. M. (1988), Science 240, 889–895. [DOI] [PMC free article] [PubMed] [Google Scholar]
- Griep A. E. and DeLuca H. F. (1986), Proc Natl Acad Sci USA 83, 5539–5543. [DOI] [PMC free article] [PubMed] [Google Scholar]
- Giguere V., Ong E. S., Segui P., and Evans R. M. (1987), Nature 330, 624–629. [DOI] [PubMed] [Google Scholar]
- Glanville N., Durnam D. M., and Palmiter R. D. (1982), Nature 292, 267–279. [DOI] [PubMed] [Google Scholar]
- Graham F. L. and Van der Eb A. J. (1973), Virology 52, 456–467. [DOI] [PubMed] [Google Scholar]
- Gudas L. J. (1991), Semin Dev Biol 2, 171–179. [Google Scholar]
- Herrmann B. G. and Frischauf A.-M. (1987), Methods Enzymol 152, 180–182. [DOI] [PubMed] [Google Scholar]
- Holland P. and Hogan B. (1988), Genes Dev 2, 773–782. [DOI] [PubMed] [Google Scholar]
- Hosler B. A., LaRosa G. J., Grippo J. F., and Gudas L. J. (1989), Mol Cell Biol 9, 5623–5629. [DOI] [PMC free article] [PubMed] [Google Scholar]
- Hu L. and Gudas L. J. (1990), Mol Cell Biol 10, 391–396. [DOI] [PMC free article] [PubMed] [Google Scholar]
- Kim S. K. and Wold B. J. (1985), Cell 42, 129–138. [DOI] [PubMed] [Google Scholar]
- Kurkinen M., Barlow D. P., Helfman D. M., Williams J. G., and Hogan B. L. M. (1983), Nucl Acids Res 11, 6199–6209. [DOI] [PMC free article] [PubMed] [Google Scholar]
- LaRosa G. J. and Gudas L. J. (1988a), Proc Natl Acad Sci USA 85, 329–333. [DOI] [PMC free article] [PubMed] [Google Scholar]
- LaRosa G. J. and Gudas L. J. (1988b), Mol Cell Biol 8, 3906–3917. [DOI] [PMC free article] [PubMed] [Google Scholar]
- Lufkin T., Dierich A., LeMeur M., Mark M., and Chambon P. (1991), Cell 66, 1105–1119. [DOI] [PubMed] [Google Scholar]
- Martin G. (1980), Science 209, 768–776. [DOI] [PubMed] [Google Scholar]
- Murphy S. P., Garbern J., Odenwald W. F., Lazzinin R. A., and Linney E. (1988), Proc Natl Acad Sci USA 85, 5587–5591. [DOI] [PMC free article] [PubMed] [Google Scholar]
- Nordstrom J. L., Roop D. R., Tsai M. J., and O’Malley B. W. (1979), Nature 278, 328–330. [DOI] [PubMed] [Google Scholar]
- Pecorino L. T., Rickles R. J., and Strickland S. (1988), Dev Biol 129, 408–416. [DOI] [PubMed] [Google Scholar]
- Petkovich M., Brand N. J., Krust A., and Chambon P. (1987), Nature 330, 444–450. [DOI] [PubMed] [Google Scholar]
- Southern P. J. and Berg P. (1982), J Mol Appl Genet 1, 327–341. [PubMed] [Google Scholar]
- Spiegelman B. M., Frank M., and Green H. (1983), J Biol Chem 258, 10038–10089. [PubMed] [Google Scholar]
- Stoner C. M. and Gudas L. J. (1989), Cancer Res 49, 1497–1504. [PubMed] [Google Scholar]
- Strickland S. and Mahdavi V. (1978), Cell 15, 393–403. [DOI] [PubMed] [Google Scholar]
- Strickland S., Smith K. K., and Marotti K. I. (1980), Cell 21, 347–355. [DOI] [PubMed] [Google Scholar]
- Sucov H. M., Murakami K. K., and Evans R. M. (1990), Proc Natl Acad Sci USA 87, 5392–5396. [DOI] [PMC free article] [PubMed] [Google Scholar]
- Vasios G. W., Gold J. D., Petkovitch M., Chambon P., and Gudas L. J. (1989), Proc Natl Acad Sci USA 86, 9009–9103. [DOI] [PMC free article] [PubMed] [Google Scholar]
- Vasios G., Mader S., Gold J. D., Leid M., Lutz Y., Gaub M-P., Chambon P., and Gudas L. J. (1991), EMBO J 10, 1149–1158. [DOI] [PMC free article] [PubMed] [Google Scholar]
- Wang S-Y. and Gudas L. J. (1983), Proc Natl Acad Sci USA 80, 5880–5884. [DOI] [PMC free article] [PubMed] [Google Scholar]
- Yoshida C. and Takeichi M. (1982), Cell 28, 217–224. [DOI] [PubMed] [Google Scholar]
- Zelent A., Krust A., Petkovich M., Kastner P., and Chambon P. (1989), Nature 339, 714–717. [DOI] [PubMed] [Google Scholar]


