Abstract
Objective
Idiopathic pulmonary fibrosis (IPF) is a progressive and fatal disease characterized by excessive deposition of collagen and associated stiffening of lung tissue. While it is known that inflammation and dysfunction of fibroblasts are involved in disease development, it remains poorly understood how cells and their microenvironment interact to produce a characteristic subpleural pattern of high and low tissue density variations, called honeycombing, on CT images of patients with IPF. Since the pleura is stiffer than the parenchyma, we hypothesized that local stiffness of the underlying extracellular matrix (ECM) can influence fibroblast activation and consequently the deposition of collagen, which in turn influences tissue stiffness in a positive feedback loop.
Approach
We tested this hypothesis by developing a hybrid physics-based/agent-based computational model in which aberrant fibroblast activation is induced when cells migrate on stiff tissue. This activation then feeds back on itself via the altered mechanical environment that it creates by depositing collagen.
Main results
The model produces power law distributions of both low and high attenuation area clusters and predicts the development of honeycombing only when mechanical rupture is allowed to take place in highly strained normal tissue surrounded by stiff fibrotic tissue. These predictions compare well with histologic data computed from CT images of patients with IPF.
Significance
We conclude that the clinical manifestation of subpleural honeycombing in IPF may result from fibroblasts entering into a positive feedback loop induced by the abnormally high tissue stiffness near the pleura.
Keywords: collagen, fibroblasts, positive feedback, computed tomography, elastic network
Introduction
The pathogenesis of idiopathic pulmonary fibrosis (IPF) remains a mystery despite intense ongoing research. Nevertheless, IPF invariably presents with certain characteristic features that may hold clues to the factors that drive its inexorable progression, if not its actual cause. Key among these features is the so-called peripheral honeycombing seen on CT (2), represented by sub-pleural mosaic patterns of enlarged airspaces bordered by thickened strands of fibrotic tissue, with the more central regions of the lung being relatively spared (31). Why IPF should manifest with such a characteristic pattern remains unclear, but the proximity of its most severe manifestations to the lung periphery suggests a possible pathogenic role for the pleura.
It has been suggested that mechanical factors may play a role in IPF (5). More specifically, it is reasonable to suppose that the stiffness of the visceral pleura may be a primary factor in disease pathogenesis given its elastic modulus of about 50 kPa (28), which is significantly greater than that of the alveolar parenchyma ranging from 0.5 to 5 kPa (43). Furthermore, mechanotransduction is a major signaling pathway for the fibroblast (10), the cell most sensitive to and directly responsible for creating fibrotic tissue (26). Local stiffness of underlying extracellular matrix (ECM) can influence fibroblast activation (15, 22) and consequently the deposition of collagen and other connective tissue matrix macromolecules, which in turn influences tissue stiffness in a feedback loop. If this feedback becomes positive, perhaps as the result of some proximal causative factor, one would expect irreversible fibrosis of the lung to develop. Accordingly, we hypothesize that the typical histologic pattern of IPF may represent an emergent spatial organization arising spontaneously from local interactions between the fibroblasts that generate fibrosis and the mechanical consequences of their actions.
The goal of the present study was to investigate the plausibility of the above hypothesis about the genesis of peripheral honeycombing in IPF. Since the details of emergent phenomena such as this are typically very difficult to predict intuitively, we have used the tools of network and statistical physics that are now being applied to the emerging field of network physiology (17). Specifically, to account for multiscale spatial interactions at the level of cells, tissues, and the entire organ, as well as time scales spanning several years, we developed a hybrid physics-based/agent-based computational model in order to explore the histologic patterns that emerge when aberrant fibroblastic signaling is allowed to feed back on itself via the altered mechanical environment that it creates. We then compared the predictions of this model to the altered parenchymal structure observed in CT images of the lung parenchyma from patients with IPF.
Methods
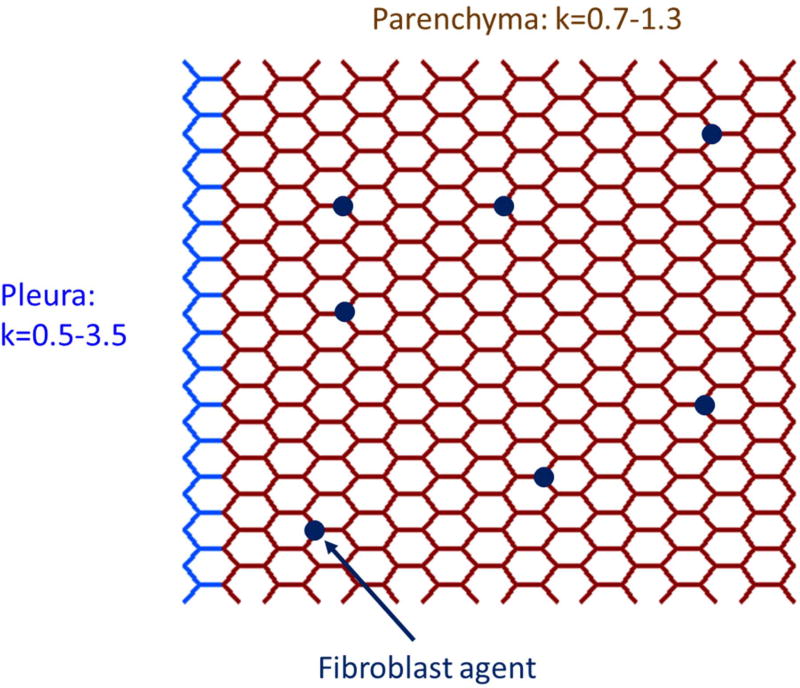
We modeled a single lobe of the lung as a two-dimensional pre-stretched hexagonal network of linear springs bordered by a layer of springs representing the pleura (Fig. 1). Each hexagon in the parenchyma represents a single alveolus in cross section. Agents representing fibroblasts occupy some of the nodes of the network, and iteratively modify the stiffness of network spring members based on the following rules:
- Agents randomly walk to a new adjacent node at each iteration, with no immediate reversals allowed, meaning that each agent must choose between the two remaining paths leading away from its current node. The choice of path is weighted by the stiffness of the two members, a and b, with spring constants ka and kb, respectively, representing the experimental findings that migration of human lung fibroblasts is enhanced on stiffer ECM (3) and the migration is directed toward stiffer regions (24). Thus, the probabilities p(a) and p(b) of stepping over members a and b, respectively, are
(1a) (1b) - The activation level, Ω, of an agent increases each time it crosses a member with a pathologically increased stiffness defined as k > 2, representing experimental findings that fibrotic tissue leads to increases in fibroblast contractility (3), proliferation (22), and gene expression (35). Each time an agent crosses a member of normal stiffness (k ≤ 2) its value of Ω is multiplied by 0.95. Agents thus become gradually deactivated in the vicinity of normal tissue, again representing experimental findings (26), but with a fading memory that reflects past experiences with abnormally stiff tissue. The activation is proportional to member stiffness relative to the pathologic threshold, with constant of proportionality γ, so if an agent has activation Ωi at time step i, its activation after crossing a member of stiffness k is
with the proviso that Ωi+1 < Ωmax. The value of γ is given as the ratio Ωmax/(kmax − 2) where kmax is the maximum stiffness allowed.(2) - To mimic collagen deposition (21) and cross-linking (36) in fibrosis, agents stiffen members as they cross them by an amount proportional to activation level, with constant of proportionality λ = 0.75, up to kmax. Thus, if ki is the stiffness of a member at time step i that is crossed by an agent with activation level Ωi then
with the proviso that ki+1 ≤ kmax.(3) - Agents randomly undergo apoptosis with a baseline probability papo = 0.01, which decreases linearly with increasing activation level until it reaches zero at the maximum activation level Ωmax. That is,
This rule mimics the experimental finding that fibroblasts exhibit an increased resistance against apoptosis in IPF (30). Whenever an agent undergoes apoptosis it is removed and replaced with a fresh deactivated agent at a randomly selected location to represent replenishment of fibroblasts by cell division and recruitment from the vasculature.(4)
Figure 1.
Schematic diagram of a section of the hybrid physic-based/agent-based network model of the lung consisting of a network of linear springs occupied by a sparse population of agents (dark blue circles) representing fibroblasts. The model represented here is in its initial healthy state in which the springs have their baseline stiffnesses (defined by their spring constants k), and the dark blue agents are unactivated (Ω = Ω0 = 0). The pleura is represented by the light blue springs for which k is distributed between 0.5 and 3.5. The parenchyma is represented by the brown springs that all have k values between 0.7 and 1.3.
The model was initialized with all parenchymal springs having unstressed length ξ = 1 with values of k distributed uniformly between 0.7 and 1.3 to reflect the natural regional heterogeneity of parenchymal stiffness (40, 43). The value of k for the springs in the pleural border varied randomly and uniformly between 1 and 3, again with ξ = 1 for each, while agents at their initial levels of activation were placed randomly at 1% of the nodes of the network. Thus, a critical element of the model is that agents become activated locally by high stiffness that we associate with the stiffness of the pleura in the beginning of the simulation.
The model was then iterated according to the above rules for 300 steps. Preliminary simulations suggested that this number of steps resulted in an average increase in the network’s two-dimensional bulk modulus by 16%, at which point the network was solved for mechanical equilibrium by minimizing the total strain energy of the system using simulated annealing (6). Since lung tissue ruptures under high strains (16), we set k = 0 (representing rupture) for any spring for which ξ ≥2.1. The above steps were repeated 6–8 times to simulate mild fibrosis, and 22–25 times to simulate severe fibrosis. The local stiffness increase was limited to kmax = 10. This threshold corresponds to atomic force microscopic measurements showing that regional lung stiffness in fibrosis can reach values of 20 kPa (23). Additionally, to account for the distribution of low-attenuation areas (LAA) found on CT images of normal subjects (29), holes of varying sizes with an approximately power law distribution representing airways were created throughout the network before the initiation of fibrosis.
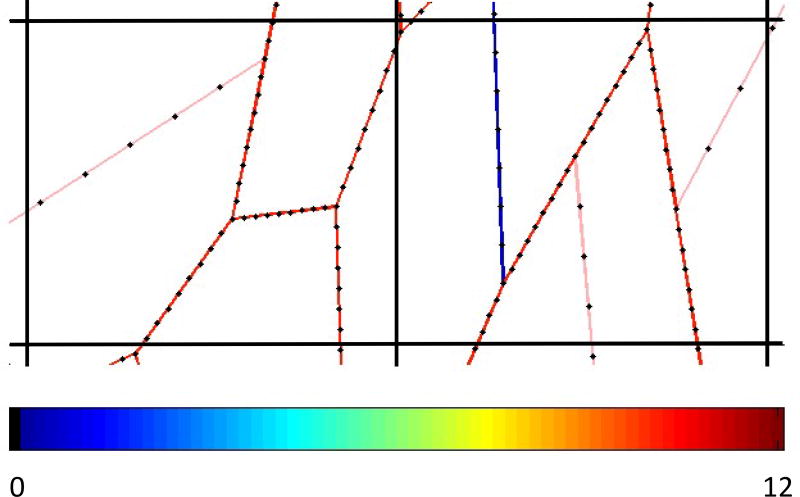
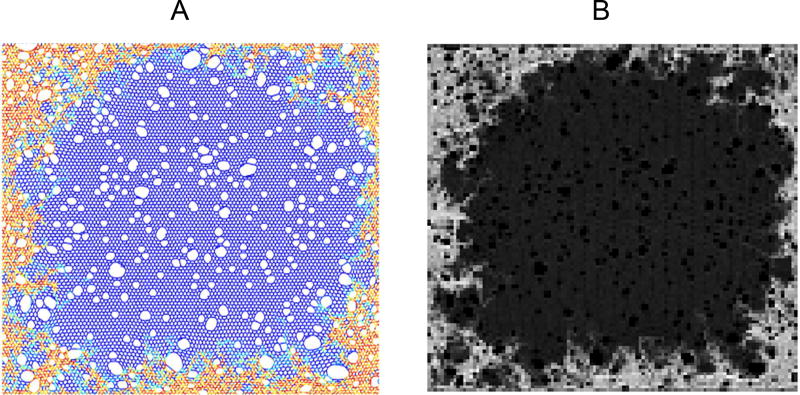
In order to compare lung structure predicted by the model to real CT images, we converted the final networks, computed as described above, into equivalent CT images as follows. First, we note that the size of the human alveolus is approximately 160 µm (32), whereas the pixel resolution in high-resolution CT image is 350 µm. Accordingly, we coarse-grained our model networks by placing a square grid on the network, with each grid cell having linear dimension 2.2 times the width of the hexagons corresponding to the alveoli in the model of the normal lung (i.e., when k ≅ 1 for all spring members in the parenchyma). Next, we sampled each member of the network along its length at 8 equally spaced points (Fig. 2) and summed the member stiffnesses for each spring within a single square of the grid. We took this sum to represent the mean tissue density within the grid square, and thus to be proportional to its equivalent CT density. An equivalent CT image was then created by representing these grid densities on an appropriate gray scale, as exemplified in Fig. 3.
Figure 2.
Conversion of the spring network into an equivalent CT density. The colored line segments represent a section of the spring network model, colored to indicate spring stiffness (value of k) according to the scale shown at the bottom of the image. The black lines shown two cells of the grid that was placed over the network, representing CT image pixel boundaries. Each segment was sampled at 8 equally spaced positions (black dots) to allow segments to span multiple grid cells, and the values of k of the spring at each position were summed within each grid cell to produce a value proportional to the mean CT density for that cell.
Figure 3.
Typical output of the spring network model (A) showing the early development of fibrosis, and its conversion to an equivalent CT image (B) via the algorithm illustrated in Fig. 2. Baseline (normal) parenchymal tissue in the network model shown in A is represented by the blue spring elements, while increasing stiffness representative of fibrosis at the tissue boundaries is represented by the yellow to red coloring. The numerous white areas in the image within and around the fibrotic regions are holes that have appeared in the network as a result of springs breaking due to excessive stress, whereas the holes in the middle of the network represent initial low attenuation areas (see main text). The lighter border areas in the equivalent CT image in B correspond to fibrotic regions having high tissue density, while the darker central regions correspond to low density, healthy parenchyma.
We analyzed data from three patients with IPF, obtained from a de-identified data base of clinical records at the University of Vermont Medical Center. All three patients met international criteria for the diagnosis of IPF (1, 20) and the exclusion of other candidate lung diseases. Forced vital capacity (FVC) and forced exhaled volume in the first second of expiration (FEV1) were measured in each patient, and thin-section spiral CT scans were acquired at two time points separated by 4 to 7 years. FVC and FEV1 were below predicted values at baseline and at follow up with normal FEV1/FVC ratios, consistent with IPF. Patient demographics and spirometry values are reported in Table 1.
Table 1.
Patient Demographics and pulmonary function parameters at baseline and follow up.
| Patient | Scan | Age | FVC | FEV1 | FEV1/FVC | |||
|---|---|---|---|---|---|---|---|---|
| -- | -- | Years | (L) | (% Pred) | (L) | (% Pred) | -- | (%Pred) |
| 1 | Baseline | 60 | 2.10 | 63.0 | 1.65 | 64.0 | 0.79 | 101.0 |
| (Female) | Follow up | 67 | 2.02 | 66.0 | 1.67 | 71.0 | 0.82 | 107.0 |
| 2 | Baseline | 75 | 3.25 | 68.0 | 2.88 | 83.0 | 0.89 | 121.0 |
| (Male) | Follow up | 81 | 2.38 | 57.0 | 1.78 | 60.0 | 0.75 | 105.0 |
| 3 | Baseline | 75 | 2.74 | 71.3 | 2.04 | 69.1 | 0.75 | 96.3 |
| (Male) | Follow up | 79 | 2.32 | 67.0 | 1.79 | 73.0 | 0.77 | 107.0 |
| MEAN | Baseline | 70±9 | 2.70±0.58 | 67.4±4.2 | 2.19±0.63 | 72.0±9.8 | 0.81±0.07 | 106.1±13.1 |
| Follow up | 76±8 | 2.24±0.19 | 63.3±5.5 | 1.75±0.07 | 68.0±7.0 | 0.78±0.04 | 106.3±1.2 | |
FVC: total volume of air expired during a complete forced expired maneuver beginning from total lung capacity
FEV1: volume of air expired in the first second of a forced expired maneuver beginning from total lung capacity
In each patient at both time points we selected 6 CT slices based on the following anatomical landmarks: mid clavicle, midway between clavical and main carina, carina, midway between carina and diaphragm, 1 cm above the diaphragm, and level with the dome of the right diaphragm. The lungs were semi-automatically segmented in each image, with large airways and vessels being manually excluded. A fibrotic lesion was defined as a high-attenuation area (HAA) consisting of a contiguous set of two or more pixels having Hounsfield Units (HU) greater than −650, while LAAs were defined as contiguous pixels having HU < −950. The −950 HU cutoff is standard for characterizing emphysema (29). There appears to be less consensus on the cutoff for fibrosis, so we chose a somewhat more conservative value compared to the −700 HU used by Matsuoka et al. (27). The percentages of HAA and LAA in the entire lung field (%HAA and %LAA, respectively) were calculated for each CT slice. The following power-law relationship was fit to the histograms of HAA and LAA sizes (29):
| (5) |
where Y is the cumulative number of clusters greater than or equal to size X, and K and D are adjustable parameters. The exponent D corresponds to the slope of a straight line fitted to log(Y) versus log(X), and was denoted DHAA and DLAA for the HAAs and LAAs, respectively. To assess the extent of interaction between HAAs and LAAs, motivated by the notion that elastic contraction of a large HAA might expand nearby normal parenchyma and hence decrease the mean CT density of adjacent tissue, we separately determined the histograms of LAAs within 2 mm of HAAs > 10 mm2 and of those further than 2 mm. Finally, in order to quantify the peripheral nature of histologic changes in the lung parenchyma, we determined %HAA and %LAA as a function of distance from the pleura.
Results
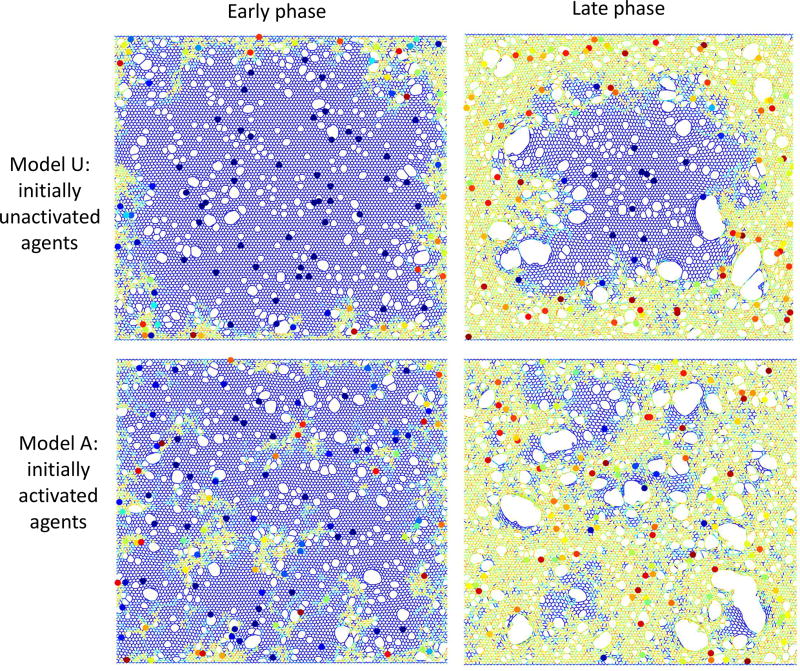
Figure 4 shows examples of the spring network model both early (left-hand panels) and late (right-hand panels) into the evolution of fibrosis. Once springs start to increase their stiffness as activated agents continue to visit them, new parenchymal holes can develop or existing ones widen as springs (representing alveolar walls) with normal stiffness become overstretched and fail. These holes are initially quite small (top left panel). As fibrosis progresses the mean hole size increases, but in an uneven manner that leaves some holes essentially unaffected while others become huge (top right panel). Large holes eventually stabilize when the fibrotic process surrounds them (lower right panel), giving rise to the “honeycomb” pattern that is typically seen on CT images of fibrotic lungs. Note also that some of the initial holes representing airways away from the pleura become stretched open as the overall stiffness of the parenchyma increases. The expansion of these more centrally located holes represents traction bronchiectasis.
Figure 4.
Example images of the model in the early (left column) and late (right column) phases. The top row shows simulations that began with initially unactivated agents (Model U: Ω0 = 0), while the model in the bottom row had significant initial agent activity (Model A: Ω0 = 2.5 ± 1). Network spring colors are related to local stiffness (blue: low, yellow/orange: high). Agents are shown as circles with colors indicating agent activity (dark blue: low, red: high).
The pattern of tissue abnormality simulated by the model also depends on the initial level of agent activation. When the agents are initially completely unactivated (Ω0 = 0) so that the sole fibrogenic influence is local tissue stiffness, the sub-pleural pattern of fibrotic progression is clearly apparent (upper panels). However, when the agents are initially activated (Ω0 = 2.5 ± 1) to represent the presence of some additional fibrogenic process, the sub-pleural dominance is reduced in favor of a more distributed fibrotic pattern (lower panels). Notice also that agent activity is low (dark blue) when agents are on normal parenchyma whereas the activity is much higher (orange/red) for agents located in the fibrotic regions.
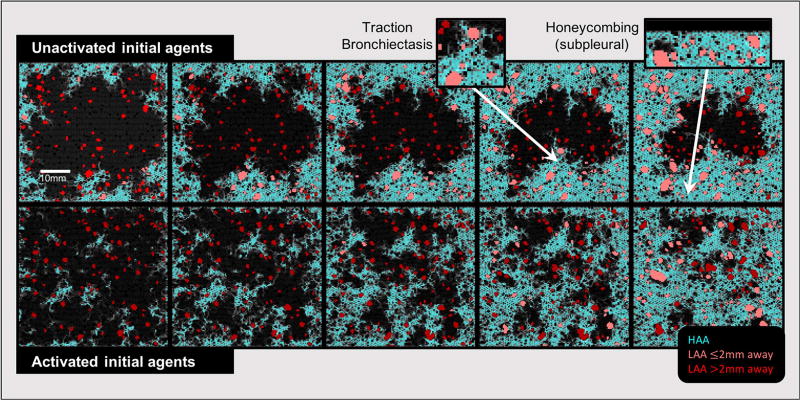
Figure 5 shows a sequence of simulated CT images through 5 stages of progressing fibrosis (from left to right), for models beginning with unactivated (Model U, top row) and activated (Model A, bottom row) agents as in Fig. 4. HAAs indicative of fibrotic tissues are shown in cyan, and recapitulate the story told by Fig. 4 that fibrosis begins sub-pleurally and progresses toward the central parenchyma when the agents are initially unactivated (top row), while beginning with already activated agents generates more evenly distributed HAA clusters (bottom row). In contrast, the LAAs, shown in red, are relatively evenly distributed throughout the tissue. The lighter red LAAs are those with centroids within 2 mm of a large HAA (i.e., fibrosis-associated LAAs), while those further than 2 mm are in dark red LAAs and are generally smaller in comparison.
Figure 5.
Equivalent CT images generated from the network model at various stages of fibrosis development beginning with agents that were initially unactivated (top) and activated (bottom). High attenuation areas (HAAs) are shown in cyan. Low attenuation areas (LAAs) are shown in red. LAAs that are near HAAs are light red, while those further away are dark red. Black pixels represent normal parenchyma and airspaces. The two insets show examples of model-based peripheral honeycombing and traction bronchiectasis.
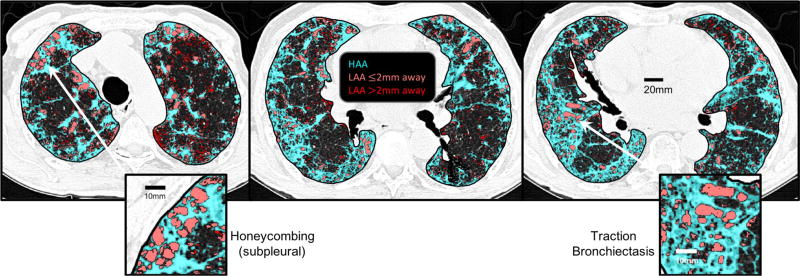
Figure 6 shows three representative CT images from one of the patients with IPF. HAAs are identified in cyan, while LAAs are shown in red with the same subdivision as shown in Fig. 5 (LAAs less than 2 mm from a HAA are light red, those farther away are dark red). These images exhibit the IPF-typical findings of sub-pleural honeycombing and traction bronchiectasis (insets). Note the similarity with the model-based honeycombing in the insets in Fig. 4. They also are suggestive of interaction between the HAAs and LAAs, since the fibrotic lesions that extend from the pleural border into the parenchyma appear to pull on the non-fibrotic tissue regions with which they are interspersed, causing them to become LAAs following rupture.
Figure 6.
Representative CT lung slices at different axial locations from a patient with idiopathic pulmonary fibrosis showing HAAs (cyan), LAAs within 2 mm of an HAA (light red), and, LAAs farther than 2 mm away from an HAA (dark red). The two insets show examples of peripheral honeycombing and traction bronchiectasis. The pattern of subpleural honeycombing, wherein small to moderate sized LAAs are stabilized by surrounding fibrotic tissue, is also recapitulated in sub-pleural regions of the model with advanced fibrosis in Fig. 5.
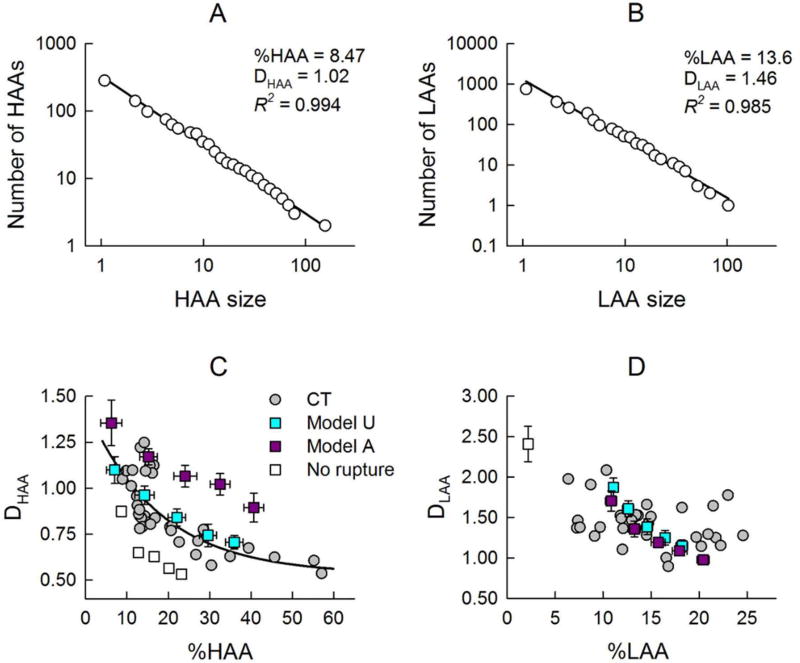
Figure 7 presents examples of HAA (panel A) and LAA (panel B) distributions showing an approximately linear decrease in both cases in a log-log plot, which thus could be considered power laws (Eq. 5). Additionally, panels C and D provide a comparison of the HAA and LAA size distributions in the human patients and those simulated by the model starting with both unactivated and activated agents. The power-law exponent for the HAAs (DHAA) exhibits a clear inverse relationship with the overall degree of fibrosis (%HAA), indicating a greater likelihood of larger HAAs in more severe fibrosis (Fig. 7C). A similar relationship was found between DHAA and %HAA in the simulated CT images when the agents in the model were initialized in the unactivated state. In contrast, when the agents were initially activated, DHAA was systematically higher at a given %HAA, even though the relationship was still an inverse one (Fig. 7C). Fig. 7D shows corresponding plots for the low attenuation areas that are interspersed between the fibrotic areas of high attenuation. Except for a slight initial decrease, no systematic relationship between the power-law exponent, DLAA, and %LAA in Fig. 7D is apparent for the human cases, in contrast to the high attenuation case in Fig. 7C. However, the two computational model scenarios do exhibit inverse relationships that are essentially identical, albeit with overall smaller variance compared to the human CT images. We also tested whether rupture in the model is necessary to account for the CT-based data. When rupture is not allowed in Model U (open squares), DHAA is underestimated. More importantly, however, the power law breaks down and the data only extend up to about %HAA=22%. Moreover, this model fails to increase %LAA and produces a single value of DLAA corresponding to %LAA=2.5%, which corresponds to the initial LAA cluster that was set up in the model to mimic airways.
Figure 7.
Examples of a power law fit to histograms of HAAs (A) and LAAs (B), showing of straight line fit with a high R2 through two decades of data C) Exponents DHAA of the distributions of dense fibrotic tissue as a function of overall degree of fibrosis (%HAA), and D) exponents DLAA of the distributions of low-attenuation areas as a function of total low attenuation area (%LAA). The gray circles correspond to the 36 CT images from the human subjects (6 images in each of 3 subjects at 2 time points). The colored squares correspond to simulated CT images when the model was run to produce progressively increasing levels of fibrosis (mean ± SD, n = 4). Simulations were performed with agents being initially unactivated (Ω0 = 0: Model U in cyan), and initially activated (Ω0 = 2.5 ± 1: Model A). The single open square represents a simulation with Model U without allowing for rupture. To better visualize the general trend, we also include a second order polynomial fit of the CT data in panel C (black line).
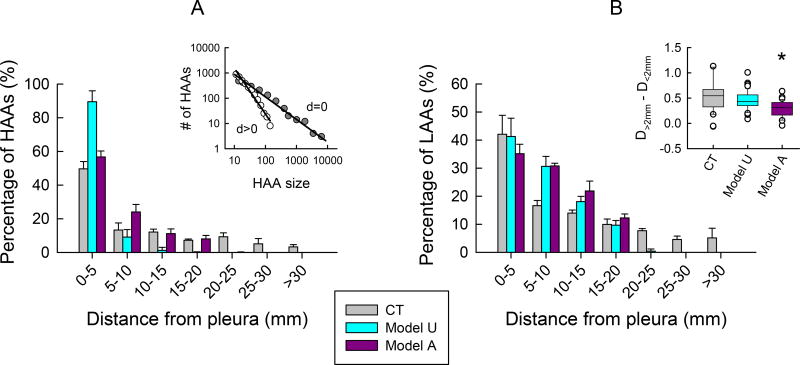
Figure 8 shows how the extent of fibrotic disease affects the spatial distribution of HAAs and LAAs. Since pulmonary fibrosis has a known sub-pleural predominance we expect that most HAAs will be located near the pleura. This is apparent in the human CT images in which most HAAs are within 5 mm of the pleural border. Beyond that, the number of HAAs is low and relatively constant with distance (Fig. 8A). The simulated CT images exhibit a qualitatively similar behavior, although with some quantitative differences; for the model beginning with unactivated agents, HAAs also become less numerous with increasing distance from the pleura but the rate of fall off is more rapid than in the patient CTs, while it is more gradual for the model beginning with activated agents. The differences between the human CT images and those from the model are likely due to the overall size disparity between the patient lung fields and simulated tissue networks. The inset in Fig. 8A also reveals that the size distribution of the HAAs that touch the pleural border has a longer tail compared to the HAAs that do not touch (DHAA = 0.87, R2=0.957 versus 1.91, R2=0.983). This means that the fibrotic lesions along the lung perimeter were larger on average than those found toward more central regions of the lung (109±243mm2 versus 23±19mm2, P<0.001). The LAAs exhibit a similar behavior (Fig. 8B), but they become less numerous with distance from the pleura at a more gradual rate compared to the HAAs. The LAA size distributions from human CT images also varied with respect to distance from a large HAA, with DLAA being 0.53±0.39, P<0.001, greater for those LAAs within 2 mm of a large HAA compared to those further away. This indicates that the larger LAAs >5mm2 were more common in the vicinity of larger HAAs, both of which were concentrated subpleurally, supporting the notion of a supleural pathogenesis of the disease. In comparison, the model beginning with unactivated agents yielded similar results to the human CT images, whereas the model beginning with activated agents was significantly lower (P<0.001), suggesting the distributions of LAAs in this case were spatially more homogenous.
Figure 8.
Spatial distribution of tissue abnormalities. The fibrotic areas of high attenuation (A) and the areas of low attenuation (B) were binned according to their distances from the pleura (edge of the image in the case of the simulations). The inset at left shows log-log plots of HAA size histograms for HAAs touching the pleura (d = 0), and for HAAs not touching the pleura (d > 0). The inset at right shows how the power-law exponents in Eq. 5 differ for LAAs within 2 mm of a large HAA versus those that are farther away. Patient data are shown in gray (CT). Model simulations were performed with agents being initially unactivated (Ω0 = 0: Model U in cyan), and initially activated (Ω0 = 2.5 ± 1: Model A). The asterisk in inset B indicates that one way ANOVA on ranks followed by Dunn’s method revealed Model A was statistically lower than CT and Model U (P<0.001).
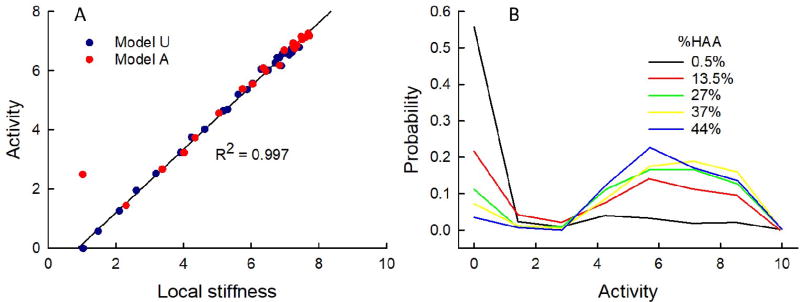
Figure 9 shows how agent activity is affected by the overall degree of fibrosis in the models. In Fig. 9A the mean activity of the agent population is plotted against the mean local stiffness, where the local stiffness at each node occupied by an agent is taken as the average stiffness of the three springs that meet at the node. As expected, given the rules of the model, activation bears an almost perfect linear relationship with stiffness; R = 0.997 for the results derived from simulations beginning with unactivated agents. When the simulations began with activated agents the relationship was virtually identical except for the left-hand most point at a spring stiffness of 1, which corresponds to the initial activation levels of the highly activated agents that were pre-specified as such (Ω0 = 2.5 ± 1). The agent activities exhibited a bi-modal distribution (Fig. 9B) reflecting distinct groups of agents, one located on regions with normal stiffness and the remainder on fibrotic regions of various elevated stiffnesses.
Figure 9.
Distribution of agent activity. A) The mean activity of the agent population versus mean local stiffness computed from the last step of the fibrosis simulations. The black line is a regression line fit to the dark blue data points derived from simulations beginning with unactivated agents (Model U: Ω0 = 0). The simulations beginning with activated agents (Model A: Ω0 = 2.5 ± 1.5) are shown in red. B) Distribution of agent activities for the model with zero initial activity (Model U: Ω0 = 0) at various stages of fibrosis progression given in terms of %HAA.
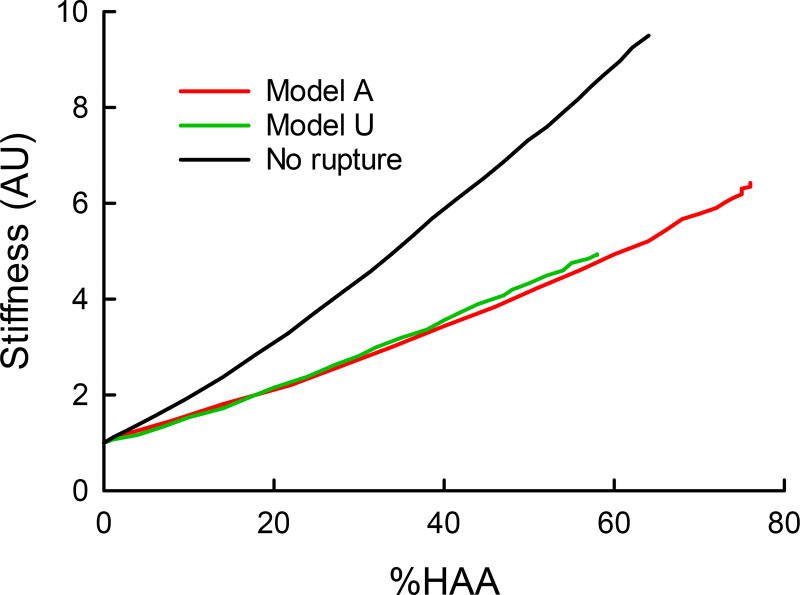
The overall stiffness of the model spring network (expressed as its two-dimensional bulk modulus, normalized to its initial value) increases almost linearly with the overall degree of fibrosis (expressed as %HAA) (Fig. 10). Furthermore, the nature of the relationship is essentially unchanged regardless of whether the agents are initially unactivated (Ω0 = 0) or activated (Ω0 = 2.5 ± 1).
Figure 10.
Example simulations of parenchymal stiffness (2D bulk modulus) as a function of progressing fibrosis (%HAA) for the model with initially unactivated agents (Model U: Ω0 = 0, blue line) and with activated agents (Model A: Ω0 = 2.5 ± 1, red line). The black line represents Model U without rupture.
Discussion
The primary question driving the current investigation was why IPF is invariably accompanied by peripheral honeycombing. This histologic pattern is so characteristic, in fact, that it constitutes a key diagnostic sign on lung CT images. The idea that fibrogenesis may be associated with greater parenchymal stiffness near the lung periphery relative to more central regions is not a new idea (5), but it has remained unclear as to exactly how this could give rise to a sub-pleural predominance of enlarged airspaces bordered by thickened strands of fibrotic tissue (Fig. 6). An important clue, however, may be that peripheral honeycombing is mild in early disease and develops over time such that the enlarged airspaces grow in size and invade inward to encompass increasingly more of the normal parenchyma (31, 37). This suggests that the fibrotic signal starts near the pleural border, and is then carried inward along with the fibrosis itself. The model simulations and patient data in the present study support this idea by showing that HAA probability distributions have tails that are longer nearer the pleura meaning that the HAAs near the pleura are much larger than those further away. Altered mechanical behavior of fibrotic tissue is an obvious candidate for the signaling culprit, whereby a positive feedback mechanism develops so that initial fibrosis begets more fibrosis. Our model simulations bear out this possibility by showing that if fibroblasts sense elevations in stiffness of the local environment and become activated to produce collagen as a result, they will exacerbate the situation by increasing the stiffness of their environment even further. This then feeds back to further increase fibroblast activation. At the same time, the incessant movement of the cells causes them to propagate fibrosis outward from their current locations, causing the fibrosis to eventually encompass a majority of the lung parenchyma (Figs. 4 and 5) as also seen clinically (Fig. 6).
Our model simulations also highlight the crucial role of tissue failure in producing the histologic pattern of peripheral honeycombing. We have shown previously (33) that if strands of tissue under excessive strain are not allowed to rupture, we predict patchy HAAs that are interspersed with areas of stretched tissue rather than actual holes. The direct comparison of the performance of our agent-based model without rupture in Figs. 7C and D suggests that rupture is indeed required for both the power law distribution of HAA and the increase in %LAA that accounts for the emergence of new LAA clusters within the areas of honeycombing. This implies that pulmonary fibrosis involves not only the aberrant production of tissue matrix, but also its destruction. Our modeling results are thus consistent with the notion that rupture is a key and novel pathogenic mechanism in the formation of honeycombing. Tissue destruction is more commonly associated with emphysema, of course, and our previous modeling studies (14, 29, 34) have shown that stress failure in elastic networks is a plausible mechanism behind the histologic patterns seen in the emphysematous lung. Nevertheless, it is now well accepted that fibrosis and emphysema often co-exist (8, 25), which suggests that they may comprise a continuous spectrum of parenchymal diseases. A functional consequence of tissue rupture is that the rate of increase of lung stiffness is slower than without rupture (Fig. 10), suggesting the possibility that mechanical failure to some extent protects lung function against the bulk mechanical consequences of fibrosis.
The question of how the fibrotic process starts remains obscure because of the wide variety of processes found to be involved. These processes include genetic factors (19), intracellular endoplasmic reticulum stress (44), cell surface receptor activation (9, 18), transforming growth factor (TGF)-β-induced signaling (13), cell-cell interactions (38), and biomechanical properties such matrix stiffness (22). Nevertheless, our model suggests that if the agents in the model are initially unactivated, the way that fibrosis develops is reminiscent of clinical observation (Fig. 6). That is, fibrosis is triggered by the high stiffness of the sub-pleural rim and moves inward, while increasing traction on airways and alveolar ducts expands these airspaces progressively (Figs. 4 and 5, tops panels). In reality, fibroblasts in the normal lung do not initiate fibrosis when they migrate onto stiff tissue and it is more likely that some level of activation is needed together with the high stiffness to launch the process. In contrast, if the agents begin with an abnormal level of activation, the sub-pleural region does not develop marked honeycombing because active fibroproliferation occurs throughout the parenchyma wherever the agents happen to be located (Figs. 4 and 5, bottom panels). The predicted distributions of HAA sizes are also more reminiscent of clinical data when the agents are initially unactivated compared to activated (Fig. 7A). In particular, the model predicts both a stronger predominance of HAAs near the pleura (Fig 8A) such that the size distribution is weighed toward larger HAAs relative to smaller ones (Fig. 8A inset). Compared to the parenchyma, the stiff airway (39) and vessel (28, 40) compartments of the lung might also serve as seeds for the initiation of the fibrotic process leading to traction bronchiectasis represented by stress expansion of holes in the center regions of the parenchyma. Even though the higher stiffness of such anatomical structures was not implemented in our model, the initial LAAs corresponding to airways in both model scenarios give rise to distributions of LAA sizes that are essentially the same regardless of whether the agents are initially unactivated or activated. Interestingly, these predictions are coincident with data from human CT images (Figs. 7B and 8B).
Taken together, the above model findings suggest that the pathogenesis of peripheral honeycombing in pulmonary fibrosis is due to some activating signal related to the stiffness of the local environment that arises in the lung parenchyma to impinge upon initially nearly normal or moderately activated fibroblasts. Indeed, increased tissue stiffness suppresses fibroblast expression of cyclooxygenase-2 and the synthesis of prostaglandin E2, which inhibits fibrogenesis (22). Additionally, the potent fibrogenic growth factor TGF-β1 activity has been reported to be partly controlled by tissue stiffness (15). It is noteworthy that the human lung is maintained in a functional homeostatic state for decades in healthy individuals, and in the case of IPF, it changes to a rapidly progressing fibrotic phenotype only later in life. Although what happens to suddenly change this situation in disease remains a mystery, our simulations point to the high stiffness of the pleura as being a key facilitating factor. Even so, it seems that the instigating event is distributed across the lung because IPF, while having a regional predilection for the periphery and bases of the lung (Fig. 6), clearly emanates from multiple locations simultaneously rather than a single focal source as happens in cancer. Consequently, our simulations predict that this will give rise to a bimodal distribution of fibroblast activation levels (Fig. 9), or at least a spreading of levels over a wider range, which is in accord with experimental findings that traction bronchiectasis strongly correlates with fibroblastic foci in IPF patients (42).
Another interesting feature of our model is that it predicts overall lung stiffness (bulk modulus) to change as fibrosis progresses in much the same way regardless of whether the agents start off unactivated or activated (Fig. 10), even though at the micro level the predictions are qualitatively quite different (Figs. 4 and 5). In a sense, this is unfortunate because it means that tracking of macroscopic lung function, which is readily done in the clinic, is not going to provide a means for distinguishing between initial activation levels. On the other hand, it suggests that lung function may be a useful marker of overall disease progression (%HAA) regardless of the microscopic details, which has prognostic value. In this regard, however, the results of the present study stand in contrast to our previous modeling study (4), which showed that randomly increasing the stiffness of individual springs in a network by a fixed factor causes the network to undergo a sharp transition in bulk modulus at the percolation threshold. This threshold is crossed at the point where the first contiguous chain of stiffened springs spans the entire network. In case of Model U (Fig. 4, top right) the stiff springs do not percolate, whereas in Model A (Fig. 4, bottom right) geometric percolation has been reached, Nevertheless, the plots in Fig. 10 are devoid of any evidence of a phase transition in stiffness at the percolation threshold. One possible reason for this is that the stiffening of the network in the present model is not done randomly spring by spring at any place in the network, but rather occurs in a highly correlated fashion due to migration of cells; indeed, we have shown previously that the percolation threshold is softened as the spatial correlation of the spring stiffening increases (33). Another possibility is that the stiffening of springs in the present study occurs gradually as activated agents cross over them repeatedly, and this is enough to flatten the relationship between bulk modulus and overall level of fibrosis to the point that it becomes nearly linear. Finally, rupture also reduces the rate at which stiffness increases (Fig. 10). While what pertains in reality remains an open question, the current model correctly accounts for sub-pleural honeycombing and traction bronchiectasis.
Our model has significant limitations that must be borne in mind. Principle among these is the fact that it considers only a single cell type and a single signaling mechanism, and as such is bound to point in directions related to only those two factors. Our motivation for focusing on a single profibrotic agent was driven by studies such as that of Walsh et al. (42) who retrospectively reviewed radiological features of 162 cases of usual interstitial pneumonia and found strong correlations between traction bronchiectasis, honeycombing and fibroblastic foci profusions. In addition, we did not consider, for example, that pulmonary fibrosis might be initiated by some tissue-specific or blood-borne mediator that makes its initial presence felt near the pleura. Such a mediator might induce the same kind of positive feedback process, with resultant peripheral honeycombing, that we have attributed here to regional tissue stiffness. Related to this, the spatial patterns of fibrosis in our model arise because of the way that fibroblasts move about in the parenchyma. Presumably another possibility is that the fibroblasts are relatively stationary and their local remodeling activities are directed by the diffusion of mediators that serve as the primary fibrotic signals, although there is little experimental evidence to support this notion at present. We also used a very simple mechanical model of the tissue itself in two dimensions, and neglected interactions that fibroblasts have with other cell types in the lung, including their generation from epithelial cells via epithelial-to-mesenchymal transition. In addition, we neglected the stretching of lung tissue and its resident cells during breathing, which may be an important source of mechanotransduction. It has been shown, for example, that strain representative of breathing can release activated TGF-β1 from extracellular matrix stores in fibrotic but not normal lung strips because of the three-to-five times greater stiffness of fibrotic tissue (11). Finally, while we have focused here on IPF and its characteristic peripheral honeycombing, this is not the only manifestation of fibrotic disease that can arise in the lung. Another clinical entity known as progressive massive fibrosis presents with a more central lesion pattern similar to our model A (Figs. 4 and 5), and has been linked to occupational exposure to coal or stone dust (7, 12) which would be expected to distribute throughout the lung and so cause a more topographically uniform activation of fibroblasts.
In conclusion, we have demonstrated that a hybrid agent-, physics-based computational model can recapitulate a key histologic feature of pulmonary fibrosis, namely a peripheral predominance that progressively devours more central regions of the lung with increasing degrees of traction bronchiectasis. Key to this process is mechanical failure of tissue that allows the formation of sub-pleural honeycombing. The progressive nature of lung fibrosis can potentially be understood as resulting from positive feedback in which increased local stiffness causes pro-fibrotic cells to increase collagen production, and thus increase the stiffness of the local cellular environment. Why this vicious cycle should suddenly develop in lungs after decades of perfect health, as happens in the case of IPF, needs to be further investigated.
Acknowledgments
This work was supported by NIH grants U01 HL-139466, R01 HL-124052, R01 HL-130847 and EB 006359.
References
- 1.American Thoracic Society. Idiopathic pulmonary fibrosis: diagnosis and treatment. International consensus statement. American Thoracic Society (ATS), and the European Respiratory Society (ERS) Am J Respir Crit Care Med. 2000;161:646–664. doi: 10.1164/ajrccm.161.2.ats3-00. [DOI] [PubMed] [Google Scholar]
- 2.Akira M, Sakatani M, Ueda E. Idiopathic pulmonary fibrosis: progression of honeycombing at thin-section CT. Radiology. 1993;189:687–691. doi: 10.1148/radiology.189.3.8080483. [DOI] [PubMed] [Google Scholar]
- 3.Asano S, Ito S, Takahashi K, Furuya K, Kondo M, Sokabe M, Hasegawa Y. Matrix stiffness regulates migration of human lung fibroblasts. Physiol Rep. 2017;5 doi: 10.14814/phy2.13281. [DOI] [PMC free article] [PubMed] [Google Scholar]
- 4.Bates JH, Davis GS, Majumdar A, Butnor KJ, Suki B. Linking parenchymal disease progression to changes in lung mechanical function by percolation. Am J Respir Crit Care Med. 2007;176:617–623. doi: 10.1164/rccm.200611-1739OC. [DOI] [PMC free article] [PubMed] [Google Scholar]
- 5.Carloni A, Poletti V, Fermo L, Bellomo N, Chilosi M. Heterogeneous distribution of mechanical stress in human lung: a mathematical approach to evaluate abnormal remodeling in IPF. J Theor Biol. 2013;332:136–140. doi: 10.1016/j.jtbi.2013.04.038. [DOI] [PubMed] [Google Scholar]
- 6.Cavalcante FS, Ito S, Brewer KK, Sakai H, Alencar AM, Almeida MP, Andrade JS, Jr, Majumdar A, Ingenito EP, Suki B. Mechanical Interactions between Collagen and Proteoglycans: Implications for the Stability of Lung Tissue. J Appl Physiol. 2005;98:672–679. doi: 10.1152/japplphysiol.00619.2004. [DOI] [PubMed] [Google Scholar]
- 7.Chung SY, Lee JH, Kim TH, Kim SJ, Kim HJ, Ryu YH. 18F-FDG PET imaging of progressive massive fibrosis. Ann Nucl Med. 2010;24:21–27. doi: 10.1007/s12149-009-0322-9. [DOI] [PubMed] [Google Scholar]
- 8.Ciccarese F, Attina D, Zompatori M. Combined pulmonary fibrosis and emphysema (CPFE): what radiologist should know. Radiol Med. 2016;121:564–572. doi: 10.1007/s11547-016-0627-4. [DOI] [PubMed] [Google Scholar]
- 9.Cinar R, Gochuico BR, Iyer MR, Jourdan T, Yokoyama T, Park JK, Coffey NJ, Pri-Chen H, Szanda G, Liu Z, Mackie K, Gahl WA, Kunos G. Cannabinoid CB1 receptor overactivity contributes to the pathogenesis of idiopathic pulmonary fibrosis. JCI Insight. 2017;2 doi: 10.1172/jci.insight.92281. [DOI] [PMC free article] [PubMed] [Google Scholar]
- 10.Duscher D, Maan ZN, Wong VW, Rennert RC, Januszyk M, Rodrigues M, Hu M, Whitmore AJ, Whittam AJ, Longaker MT, Gurtner GC. Mechanotransduction and fibrosis. J Biomech. 2014;47:1997–2005. doi: 10.1016/j.jbiomech.2014.03.031. [DOI] [PMC free article] [PubMed] [Google Scholar]
- 11.Froese AR, Shimbori C, Bellaye PS, Inman M, Obex S, Fatima S, Jenkins G, Gauldie J, Ask K, Kolb M. Stretch-induced Activation of Transforming Growth Factor-beta1 in Pulmonary Fibrosis. Am J Respir Crit Care Med. 2016;194:84–96. doi: 10.1164/rccm.201508-1638OC. [DOI] [PubMed] [Google Scholar]
- 12.Gera K, Pilaniya V, Shah A. Silicosis: progressive massive fibrosis with eggshell calcification. BMJ Case Rep. 2014;2014 doi: 10.1136/bcr-2014-206376. [DOI] [PMC free article] [PubMed] [Google Scholar]
- 13.Ghatak S, Hascall VC, Markwald RR, Feghali-Bostwick C, Artlett CM, Gooz M, Bogatkevich GS, Atanelishvili I, Silver RM, Wood J, Thannickal VJ, Misra S. Transforming growth factor beta1 (TGFbeta1)-induced CD44V6-NOX4 signaling in pathogenesis of idiopathic pulmonary fibrosis. J Biol Chem. 2017;292:10490–10519. doi: 10.1074/jbc.M116.752469. [DOI] [PMC free article] [PubMed] [Google Scholar]
- 14.Hamakawa H, Bartolak-Suki E, Parameswaran H, Majumdar A, Lutchen KR, Suki B. Structure-function Relations in an Elastase-induced Mouse Model of Emphysema. Am J Respir Cell Mol Biol. 2011 doi: 10.1165/rcmb.2010-0473OC. [DOI] [PMC free article] [PubMed] [Google Scholar]
- 15.Hinz B. Tissue stiffness, latent TGF-beta1 activation, and mechanical signal transduction: implications for the pathogenesis and treatment of fibrosis. Curr Rheumatol Rep. 2009;11:120–126. doi: 10.1007/s11926-009-0017-1. [DOI] [PubMed] [Google Scholar]
- 16.Ito S, Ingenito EP, Brewer KK, Black LD, Parameswaran H, Lutchen KR, Suki B. Mechanics, nonlinearity, and failure strength of lung tissue in a mouse model of emphysema: possible role of collagen remodeling. J Appl Physiol. 2005;98:503–511. doi: 10.1152/japplphysiol.00590.2004. [DOI] [PubMed] [Google Scholar]
- 17.Ivanov PC, Liu KL, Bartsch RP. Focus on the emerging new fields of network physiology and network medicine. New J Phys. 2016;18:100201. doi: 10.1088/1367-2630/18/10/100201. [DOI] [PMC free article] [PubMed] [Google Scholar]
- 18.Karampitsakos T, Woolard T, Bouros D, Tzouvelekis A. Toll-like receptors in the pathogenesis of pulmonary fibrosis. Eur J Pharmacol. 2017;808:35–43. doi: 10.1016/j.ejphar.2016.06.045. [DOI] [PubMed] [Google Scholar]
- 19.Kaur A, Mathai SK, Schwartz DA. Genetics in Idiopathic Pulmonary Fibrosis Pathogenesis, Prognosis, and Treatment. Front Med (Lausanne) 2017;4:154. doi: 10.3389/fmed.2017.00154. [DOI] [PMC free article] [PubMed] [Google Scholar]
- 20.King TE, Jr, Pardo A, Selman M. Idiopathic pulmonary fibrosis. Lancet. 2011;378:1949–1961. doi: 10.1016/S0140-6736(11)60052-4. [DOI] [PubMed] [Google Scholar]
- 21.Kirk JM, Da Costa PE, Turner-Warwick M, Littleton RJ, Laurent GJ. Biochemical evidence for an increased and progressive deposition of collagen in lungs of patients with pulmonary fibrosis. Clin Sci (Lond) 1986;70:39–45. doi: 10.1042/cs0700039. [DOI] [PubMed] [Google Scholar]
- 22.Liu F, Mih JD, Shea BS, Kho AT, Sharif AS, Tager AM, Tschumperlin DJ. Feedback amplification of fibrosis through matrix stiffening and COX-2 suppression. J Cell Biol. 2010;190:693–706. doi: 10.1083/jcb.201004082. [DOI] [PMC free article] [PubMed] [Google Scholar]
- 23.Liu F, Tschumperlin DJ. Micro-mechanical characterization of lung tissue using atomic force microscopy. Journal of visualized experiments : JoVE. 2011 doi: 10.3791/2911. [DOI] [PMC free article] [PubMed] [Google Scholar]
- 24.Lo CM, Wang HB, Dembo M, Wang YL. Cell movement is guided by the rigidity of the substrate. Biophys J. 2000;79:144–152. doi: 10.1016/S0006-3495(00)76279-5. [DOI] [PMC free article] [PubMed] [Google Scholar]
- 25.Lundblad LK, Thompson-Figueroa J, Leclair T, Sullivan MJ, Poynter ME, Irvin CG, Bates JH. Tumor necrosis factor-alpha overexpression in lung disease: a single cause behind a complex phenotype. Am J Respir Crit Care Med. 2005;171:1363–1370. doi: 10.1164/rccm.200410-1349OC. [DOI] [PMC free article] [PubMed] [Google Scholar]
- 26.Marinkovic A, Liu F, Tschumperlin DJ. Matrices of physiologic stiffness potently inactivate idiopathic pulmonary fibrosis fibroblasts. Am J Respir Cell Mol Biol. 2013;48:422–430. doi: 10.1165/rcmb.2012-0335OC. [DOI] [PMC free article] [PubMed] [Google Scholar]
- 27.Matsuoka S, Yamashiro T, Matsushita S, Fujikawa A, Yagihashi K, Nakajima Y. Objective quantitative CT evaluation using different attenuation ranges in patients with pulmonary fibrosis: correlations with visual scores. International Journal of Respiratory and Pulmonary Medicine. 2016;3 [Google Scholar]
- 28.Melo E, Cardenes N, Garreta E, Luque T, Rojas M, Navajas D, Farre R. Inhomogeneity of local stiffness in the extracellular matrix scaffold of fibrotic mouse lungs. J Mech Behav Biomed Mater. 2014;37:186–195. doi: 10.1016/j.jmbbm.2014.05.019. [DOI] [PubMed] [Google Scholar]
- 29.Mishima M, Hirai T, Itoh H, Nakano Y, Sakai H, Muro S, Nishimura K, Oku Y, Chin K, Ohi M, Nakamura T, Bates JH, Alencar AM, Suki B. Complexity of terminal airspace geometry assessed by lung computed tomography in normal subjects and patients with chronic obstructive pulmonary disease. Proc Natl Acad Sci U S A. 1999;96:8829–8834. doi: 10.1073/pnas.96.16.8829. [DOI] [PMC free article] [PubMed] [Google Scholar]
- 30.Moodley YP, Misso NL, Scaffidi AK, Fogel-Petrovic M, McAnulty RJ, Laurent GJ, Thompson PJ, Knight DA. Inverse effects of interleukin-6 on apoptosis of fibroblasts from pulmonary fibrosis and normal lungs. Am J Respir Cell Mol Biol. 2003;29:490–498. doi: 10.1165/rcmb.2002-0262OC. [DOI] [PubMed] [Google Scholar]
- 31.Nakagawa H, Nagatani Y, Takahashi M, Ogawa E, Tho NV, Ryujin Y, Nagao T, Nakano Y. Quantitative CT analysis of honeycombing area in idiopathic pulmonary fibrosis: Correlations with pulmonary function tests. Eur J Radiol. 2016;85:125–130. doi: 10.1016/j.ejrad.2015.11.011. [DOI] [PubMed] [Google Scholar]
- 32.Ochs M. Estimating structural alterations in animal models of lung emphysema. Is there a gold standard? Annals of anatomy = Anatomischer Anzeiger : official organ of the Anatomische Gesellschaft. 2014;196:26–33. doi: 10.1016/j.aanat.2013.10.004. [DOI] [PubMed] [Google Scholar]
- 33.Oliveira CL, Bates JH, Suki B. A network model of correlated growth of tissue stiffening in pulmonary fibrosis. New J Phys. 2014;16:065022. doi: 10.1088/1367-2630/16/6/065022. [DOI] [PMC free article] [PubMed] [Google Scholar]
- 34.Parameswaran H, Majumdar A, Suki B. Linking Microscopic Spatial Patterns of Tissue Destruction in Emphysema to Macroscopic Decline in Stiffness Using a 3D Computational Model. Plos Comput Biol. 2011;7:e1001125. doi: 10.1371/journal.pcbi.1001125. [DOI] [PMC free article] [PubMed] [Google Scholar]
- 35.Parker MW, Rossi D, Peterson M, Smith K, Sikstrom K, White ES, Connett JE, Henke CA, Larsson O, Bitterman PB. Fibrotic extracellular matrix activates a profibrotic positive feedback loop. J Clin Invest. 2014;124:1622–1635. doi: 10.1172/JCI71386. [DOI] [PMC free article] [PubMed] [Google Scholar]
- 36.Reiser KM, Tryka AF, Lindenschmidt RC, Last JA, Witschi HR. Changes in collagen cross-linking in bleomycin-induced pulmonary fibrosis. J Biochem Toxicol. 1986;1:83–91. doi: 10.1002/jbt.2570010109. [DOI] [PubMed] [Google Scholar]
- 37.Salisbury ML, Lynch DA, van Beek EJ, Kazerooni EA, Guo J, Xia M, Murray S, Anstrom KJ, Yow E, Martinez FJ, Hoffman EA, Flaherty KR Investigators IP. Idiopathic Pulmonary Fibrosis: The Association between the Adaptive Multiple Features Method and Fibrosis Outcomes. Am J Respir Crit Care Med. 2017;195:921–929. doi: 10.1164/rccm.201607-1385OC. [DOI] [PMC free article] [PubMed] [Google Scholar]
- 38.Shi J, Li F, Luo M, Wei J, Liu X. Distinct Roles of Wnt/beta-Catenin Signaling in the Pathogenesis of Chronic Obstructive Pulmonary Disease and Idiopathic Pulmonary Fibrosis. Mediators Inflamm. 2017;2017:3520581. doi: 10.1155/2017/3520581. [DOI] [PMC free article] [PubMed] [Google Scholar]
- 39.Shkumatov A, Thompson M, Choi KM, Sicard D, Baek K, Kim DH, Tschumperlin DJ, Prakash YS, Kong H. Matrix stiffness-modulated proliferation and secretory function of the airway smooth muscle cells. Am J Physiol Lung Cell Mol Physiol. 2015;308:L1125–1135. doi: 10.1152/ajplung.00154.2014. [DOI] [PMC free article] [PubMed] [Google Scholar]
- 40.Sicard D, Haak AJ, Choi KM, Craig AR, Fredenburgh LE, Tschumperlin DJ. Aging and Anatomical Variations in Lung Tissue Stiffness. Am J Physiol Lung Cell Mol Physiol. 2018 doi: 10.1152/ajplung.00415.2017. [DOI] [PMC free article] [PubMed] [Google Scholar]
- 41.Tenorio LEM, Devine KJ, Lee J, Kowalewski TM, Barocas VH. Biomechanics of human parietal pleura in uniaxial extension. J Mech Behav Biomed Mater. 2017;75:330–335. doi: 10.1016/j.jmbbm.2017.07.044. [DOI] [PubMed] [Google Scholar]
- 42.Walsh SL, Wells AU, Sverzellati N, Devaraj A, von der Thusen J, Yousem SA, Colby TV, Nicholson AG, Hansell DM. Relationship between fibroblastic foci profusion and high resolution CT morphology in fibrotic lung disease. BMC Med. 2015;13:241. doi: 10.1186/s12916-015-0479-0. [DOI] [PMC free article] [PubMed] [Google Scholar]
- 43.Yi E, Sato S, Takahashi A, Parameswaran H, Blute TA, Bartolak-Suki E, Suki B. Mechanical Forces Accelerate Collagen Digestion by Bacterial Collagenase in Lung Tissue Strips. Front Physiol. 2016;7:287. doi: 10.3389/fphys.2016.00287. [DOI] [PMC free article] [PubMed] [Google Scholar]
- 44.Zhang L, Wang Y, Pandupuspitasari NS, Wu G, Xiang X, Gong Q, Xiong W, Wang CY, Yang P, Ren B. Endoplasmic reticulum stress, a new wrestler, in the pathogenesis of idiopathic pulmonary fibrosis. Am J Transl Res. 2017;9:722–735. [PMC free article] [PubMed] [Google Scholar]


