Abstract
Objectives
Prior studies identified significant racial disparities as well as regional variation in outcomes of patients with peripheral artery disease (PAD). We aimed to determine whether regional variation contributes to these racial disparities.
Methods
We identified all White or Black patients who underwent infrainguinal revascularization or amputation in 15 de-identified regions of the Vascular Quality Initiative (VQI) between 2003–2017. We excluded 3 regions with <100 procedures. We used multivariable linear regression allowing for clustering at the hospital level to calculate the marginal effects of race and region on adjusted 30-day mortality, major adverse limb events (MALE), and amputation. We compared long-term outcomes between Black and White patients within each region, and within patients of each race treated in different regions using multivariable Cox regression.
Results
We identified 90,418 patients; 15,527 (17%) of whom were Black. Patients underwent 31,263 bypasses, 52,462 endovascular interventions, and 6,693 amputations. Black patients were younger, less likely to smoke, have coronary artery disease, or chronic obstructive pulmonary disease, but more likely to have diabetes, limb-threatening ischemia, dialysis-dependence, hypertension, be self-insured or on Medicaid (all P<.05). Adjusted 30-day mortality ranged from 1.2–2.1% across regions for White patients and 0–3.0% for Black patients, adjusted 30-day MALE varied from 4.0–8.3% for White patients and 2.4–8.1% for Black patients, and adjusted 30-day amputation rates varied from 0.3–1.2% in White patients, and 0–2.1% for Black patients. Black patients experienced significantly different (both higher and lower) adjusted rates of 30-day mortality and amputation than White patients in several regions (P<.05), but not MALE. In addition, within each racial group, we found significant variation in the adjusted rates of all outcomes between regions (all P<.01). In adjusted analyses, compared to White patients, Black patients experienced consistently lower long-term mortality (HR 0.80 [0.73–0.88], P<.001), and higher rates of MALE (HR 1.15 [1.06–1.25], P<.001), and amputation (HR 1.33 [1.18–1.51], P<.001) with no statistically significant variation across the regions. However, rates of all long-term outcomes varied within both racial groups across regions.
Conclusion
Significant racial disparities exist in outcomes following lower extremity procedures in patients with PAD, with regional variation contributing to perioperative, but not long-term outcome disparities. Underperforming regions should utilize these data to generate quality improvement projects, as understanding the etiology of these disparities is critical to improving the care of all patients with PAD.
Introduction
Peripheral artery disease (PAD) afflicts millions of Americans, but disproportionately affects minorities.1–4 Black patients develop PAD at higher rates compared with other racial groups, have greater comorbid burdens, and present to care later, with more severe disease.5–7 In addition to disparities in the prevalence and presentation of PAD, differences exist in treatment and outcomes.4,8 Black patients with chronic limb-threatening ischemia (CLTI) are up to four times as likely to undergo amputation and less likely to undergo bypass surgery for limb salvage.8,9 Even after revascularization, they more often experience early graft failure and other major adverse limb events, with worse amputation-free survival compared to White patients.10–12 However, despite these disparities, a recent study by Brothers et al. demonstrated paradoxically higher survival in Black patients undergoing lower extremity revascularization.13 Although the causes of racial disparities in health outcomes are multifactorial, a wealth of evidence demonstrates that geographic and regional variation influence healthcare costs, utilization, treatment strategies, and outcomes.14–20 In recent years, an increased focus on regional variation in surgical practice revealed that where a patient resides often impacts their propensity to undergo surgery or amputation more than the actual surgical indication.21,22 Our prior studies showed significant variation in the treatment of various vascular conditions including carotid artery disease and abdominal aortic aneurysms.23,24 Similarly, variation exists in the intensity of vascular care provided to patients in the year prior to major amputation, with disproportionately large numbers of Black patients living in the regions with high amputation rates and low intensity of care.6,21,25 We sought to use national data from the Society of Vascular Surgery Vascular Quality Initiative (VQI) to evaluate whether regional variation confounds the relationship between race and outcomes following infrainguinal revascularization and amputation.
Methods
Subjects
We identified all Black and White patients who underwent either amputation (we only included amputations above the ankle) or lower extremity revascularization (infrainguinal endovascular revascularization or open surgical bypass) for occlusive disease in the VQI between 2003–2017. The VQI is a cooperative quality improvement initiative developed in 2002 to improve outcomes in vascular surgery, and collects data from 412 centers in 46 US states and 1 Canadian province, organized into 18 de-identified regions. Vascular surgeons, data managers, trainees and nurses enter over 200 variables including patient demographics, comorbid conditions, postoperative complications, and one-year follow-up data. Long-term mortality is ascertained by linkage to the Social Security Death Index. We excluded three regions due to low procedural volume, defined as <100 procedures. The Beth Israel Deaconess Medical Center Institutional Review Board approved this study and waived the need for patient consent due to the nature of the design and minimal risk to human subjects.
Definitions and variables
We classified center volume by the average yearly volume of procedures in each center since their initiation into the VQI, excluding their lowest volume year to account for centers that entered into the VQI later in the year. After calculating adjusted average yearly volume by center, we classified centers into quintiles of volume. The VQI records demographics and comorbidities, and we further defined chronic kidney disease (stage 3 or greater) as a glomerular filtration rate (GFR) < 60 mL/min/1.73m2 by the CKD-EPI formula.
Outcomes
Our primary outcome was risk-adjusted mortality at 30 days postoperatively and long-term in all patients. Secondary outcomes included risk-adjusted rates of amputation and major adverse limb event (MALE- defined as ipsilateral reintervention or ipsilateral amputation) in those patients undergoing peripheral vascular intervention or infrainguinal revascularization. Only major amputations were considered (defined as proximal to the ankle joint). For patients who underwent amputation, we considered MALE as any subsequent intervention on the side of the amputation, or conversion to more proximal amputation.
Statistical Analysis
We compared baseline characteristics between Black and White patients using chi-squared, Fisher exact, t-test, and Wilcoxon rank-sum tests where appropriate. To calculate risk-adjusted rates of the 30-day outcomes, we constructed hierarchical linear regression models clustering at the center level, and used these to compute the marginal effects of Black compared to White race, the marginal effects of a patient’s region, and the interaction between race and region. For long-term outcomes, we constructed Kaplan-Meier curves and performed multivariable Cox regression, similarly clustering at the center level. To compare between-group differences across regions, we constructed individual Cox models comparing outcomes between Black and White patients in each region. To compare within-group outcomes, we constructed separate Cox models in Black patients and White patients. We randomly selected region 3 as the referent group. The resultant hazard ratios we compared using forest plots. We controlled for age, race, sex, surgery year, procedure type, coronary artery disease, hypertension, prior peripheral interventions, cerebrovascular disease, congestive heart failure, chronic kidney disease (defined as GFR<60), dialysis dependence, chronic obstructive pulmonary disease, indication (asymptomatic, claudication, rest pain, tissue loss or acute limb ischemia), urgency of procedure, diabetes, body mass index, Medicaid or self-pay, smoking, center volume, statin use, and antiplatelet therapy. We used STATA version 14.2 (StataCorp LP, College Station, TX) for all analyses.
Sensitivity Analyses
To address issues with missing follow-up data, we performed two separate sensitivity analyses to ensure that our results were robust. First, we examined outcomes only in centers with greater than 50% follow-up rates (136/223 centers, 39%). Second, we repeated our primary analysis first by assigning all Black patients with missing data to having a limb event (for both amputation and MALE), and then by assigning all Black patients with missing data to not having a limb event.
Results
Baseline characteristics
We identified 90,418 patients, 15,527 (17%) of whom were Black. Patients underwent 31,263 bypasses, 52,462 endovascular interventions, and 6,693 amputations. Black patients were younger, less likely to smoke, have coronary artery disease, and chronic obstructive pulmonary disease, but more likely to have diabetes, limb-threatening ischemia, dialysis-dependence, hypertension, be self-insured or on Medicaid (Table I). The proportion of Black patients undergoing treatment in centers in the lowest two quintiles of volume ranged from 0–100% across regions, with Black patients more likely than White patients to undergo treatment at low volume centers in 8 of 15 regions. Similarly, rates of Black patients on Medicaid or uninsured varied from 6–22%, and exceeded the rates of White patients in every region.
Table I.
Baseline Demographics, stratified by race. PVI: Peripheral vascular intervention.
| Characteristic | White (n=74,891, 83%) | Black (n=15,527, 17%) | P |
|---|---|---|---|
| Age | 68 +/− 11.4 | 64 +/− 11.5 | < .001 |
| Male Sex | 48,038 (64) | 8,518 (55) | < .001 |
| Procedure Type: | < .001 | ||
| Bypass | 26,579 (35) | 4,684 (30) | |
| PVI | 44,152 (59) | 8,310 (54) | |
| Amputation | 4,160 (6) | 2,533 (16) | |
| Indication | < .001 | ||
| Asymptomatic | 4,046 (6) | 483 (3) | |
| claudication | 27,706 (38) | 3,634 (25) | |
| rest pain | 11,116 (15) | 2,575 (25) | |
| tissue loss | 22,481 (31) | 6,203 (43) | |
| acute ischemia | 7,000 (10) | 1,356 (9) | |
| CLTI | 40,597 (56) | 10,134 (70) | |
| Smoking | 61,506 (82) | 11,628 (75) | < .001 |
| Prior PVI | 35,111 (47) | 6,145 (40) | < .001 |
| Medicaid/Self-Pay | 4,898 (8) | 2,128 (16) | < .001 |
| Hypertension | 65,227 (87) | 14,319 (93) | < .001 |
| Diabetes | 37,396 (50) | 10,292 (66) | < .001 |
| CAD | 34,541 (46) | 5,673 (37) | < .001 |
| CHF | 12,933 (17) | 3,310 (21) | < .001 |
| COPD | 20,230 (27) | 3,072 (20) | < .001 |
| BMI | < .001 | ||
| Underweight | 2,932 (4) | 774 (5) | |
| Normal | 22,317 (30) | 4,836 (31) | |
| Overweight | 25,268 (34) | 4,809 (31) | |
| Obese | 24,374 (33) | 5,108 (33) | |
| GFR<60 | 27,902 (37) | 6,485 (42) | < .001 |
| Dialysis | 3,918 (5) | 2,609 (17) | < .001 |
| Case Urgency: | < .001 | ||
| Elective | 60,327 (81) | 11,739 (76) | |
| Urgent | 12,176 (16) | 3,062 (20) | |
| Emergent | 2,154 (3) | 596 (4) | |
| Medications | |||
| Aspirin | 53,978 (72) | 10,481 (68) | < .001 |
| Statin | 51,965 (70) | 10,234 (66) | < .001 |
| P2Y12 inhibitor | 26,184 (35) | 5,433 (35) | 0.69 |
| Dual Antiplatelet | 20,732 (28) | 4,105 (27) | 0.004 |
| Any antiplatelet | 59,430 (80) | 11,809 (77) | < .001 |
| Volume Quintiles | < .001 | ||
| 1 (<70/yr) | 14,980 (20) | 3,209 (21) | |
| 2(71–112/yr) | 13,922 (19) | 3,018 (19) | |
| 3 (115–166/yr) | 16,418 (22) | 3,171 (20) | |
| 4 (170–254/yr) | 13,373 (18) | 3,522 (23) | |
| 5 (>257/yr) | 16,139 (22) | 2,586 (17) |
Risk-Adjusted 30-Day Outcomes
Racial Disparities Across Regions (Between-Group Variation)
Adjusted 30-day mortality ranged from 1.16 – 2.08% for White patients, and 0 – 3.02% for Black patients (Figure 1). In five regions, Black patients experienced significantly lower rates of 30-day mortality than White patients in those regions (all P < .05). The adjusted 30-day rates of MALE varied from 4.04 – 8.33% in White patients, and 2.40 – 8.14% in Black patients (Figure 2). Black patients experienced similar rates of MALE as White patients in all regions (all P > .05) (Figure 2). Adjusted 30-day amputation rates varied from 0.33 – 1.15% for White patients, and 0 – 2.10% for Black patients (Figure 3). Black patients experienced lower 30-day amputation rates than White patients in two regions, and a higher rate in one region (all P < .05).
Figure 1.
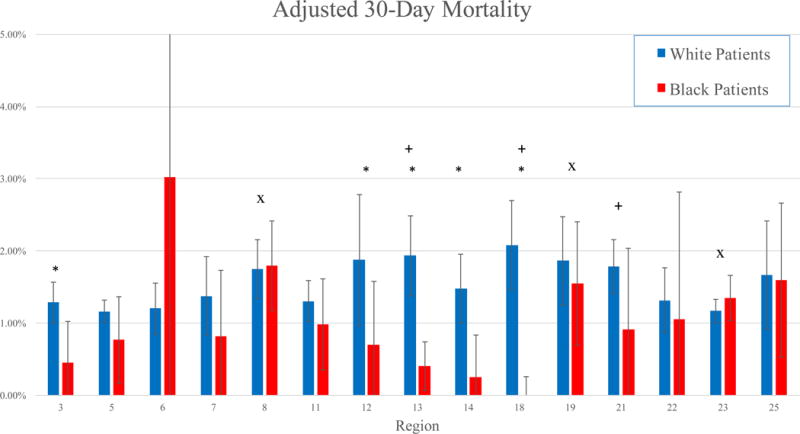
Adjusted 30-day mortality by region in Black and White patients.
*: P < .05 for Black patients compared to White patients
+: P < .05 for White patients in that region compared to White patients in other regions
x: P < .05 for Black patients in that region compared to Black patients in other regions
Figure 2.
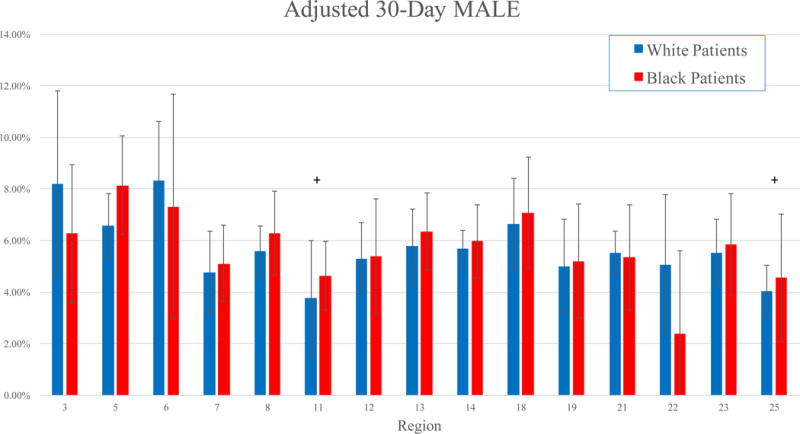
Adjusted 30-day rates of MALE by region in Black and White patients.
*: P < .05 for Black patients compared to White patients
+: P < .05 for White patients in that region compared to White patients in other regions
x: P < .05 for Black patients in that region compared to Black patients in other regions
Figure 3.
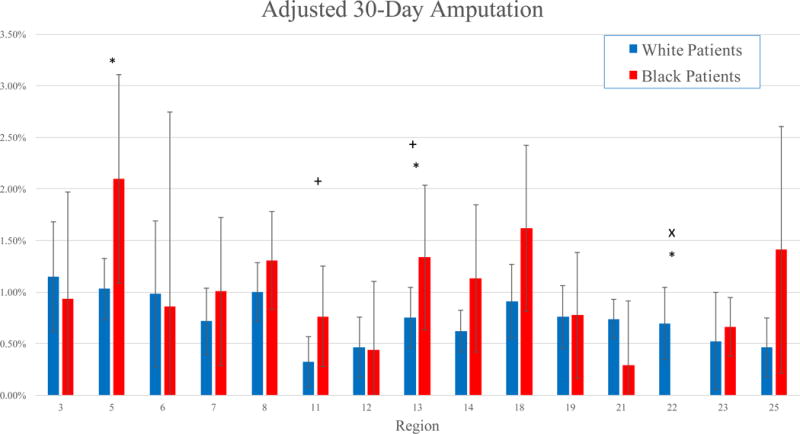
Adjusted 30-day amputation rates by region in Black and White patients.
*: P < .05 for Black patients compared to White patients
+: P < .05 for White patients in that region compared to White patients in other regions
x: P < .05 for Black patients in that region compared to Black patients in other regions
Regional Variation Within Racial Groups
Black Patients
In three regions, Black patients experienced significantly different rates of adjusted 30-day mortality than Black patients in other regions (both higher and lower) (Figure 1). In one region, Black patients experienced significantly lower adjusted amputation rates than Black patients in other regions (P < .01) (Figure 3). However, Black patients experienced similar adjusted rates of MALE compared to other Black patients, irrespective of region (Figure 2).
White patients
White patients in three regions similarly experienced significantly different rates of adjusted 30-day mortality than White patients in other regions (Figure 1). Similarly, White patients in two regions experienced significantly lower adjusted rates of MALE than White patients in other regions, and adjusted amputation rates were lower in two other regions (all P < .05) (Figure 2, Figure 3).
Risk-Adjusted Long-Term Outcomes
Racial Disparities Across Regions (Between-Group Variation)
Black patients experienced consistently lower adjusted long-term mortality than White patients [overall Hazard Ratio (HR): 0.80 [95% Confidence Interval 0.73 – 0.88], P < .001), with no regional variation in this disparity (Figure 4). This lower mortality in black patients was consistent across all procedure types (P = 0.48). Black patients experienced consistently higher adjusted rates of MALE than White patients (Overall HR 1.15 [1.06 – 1.25], P < .001), with no regional variation (Figure 5). Similar to survival, this disparity was consistent in all procedure types (P = .59). We found consistently higher adjusted amputation rates in Black patients compared to White patients, with no regional variation (Overall HR 1.33 [1.18 – 1.51], P < .001) (Figure 6). Although consistently higher in black patients, the magnitude of the disparity in amputation rates was greater following leg bypass (HR 1.45 [1.26 – 1.66], P < .01) than endovascular interventions (HR 1.08 [0.91 – 1.27], P = .37), P < .01 for the comparison across procedure types.
Figure 4.
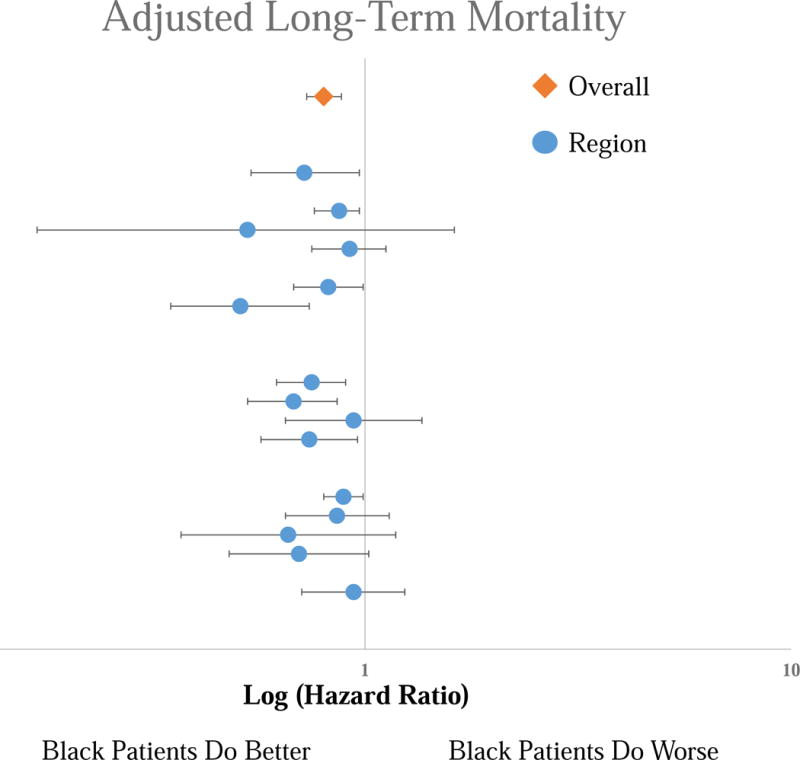
Forest Plot of the Hazard Ratios for the adjusted long-term mortality risk for Black patients compared to White patients by region. Top line is the overall cohort, each subsequent line represents an individual region. No significant difference across regions.
Figure 5.
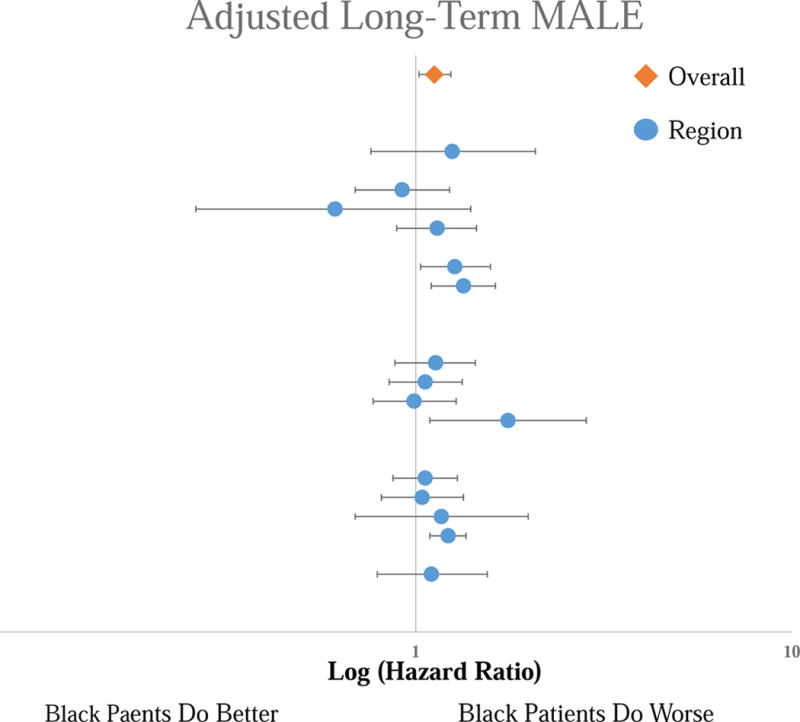
Forest Plot of the Hazard Ratios for the adjusted long-term MALE risk for Black patients compared to White patients by region. Top line is the overall cohort, each subsequent line represents an individual region. No significant difference across regions.
Figure 6.
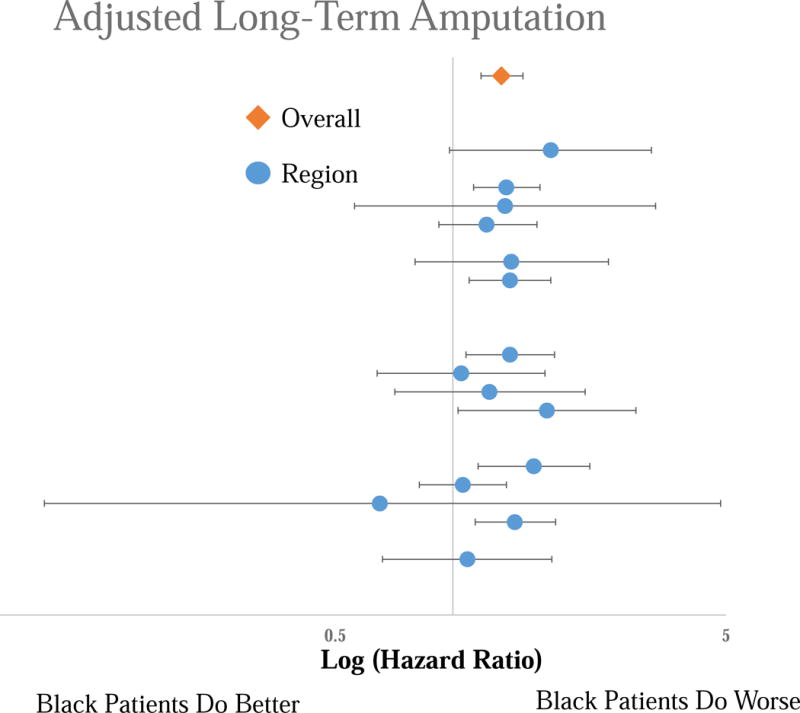
Forest Plot of the Hazard Ratios for the adjusted long-term amputation risk for Black patients compared to White patients by region. Top line is the overall cohort, each subsequent line represents an individual region. No significant difference across regions.
Regional Variation Within Racial Groups
Black patients
Although the disparity in adjusted overall mortality between Black and White patients did not vary across regions, the mortality rates within the two racial groups varied substantially across the regions. In Black patients, three regions demonstrated significantly higher adjusted mortality rates than the other regions (HR 1.46 – 1.70 using Region 3 as a reference, P < .01). Similarly, two regions demonstrated significantly lower adjusted rates of MALE than the others (HR 0.28 – 0.74 using Region 3 as a reference, P < .05). One region exhibited significantly lower adjusted amputation rates (HR 0.34 using Region 3 as a reference [0.13 – 0.86], P = .02), and three regions exhibited significantly higher adjusted amputation rates (HR 1.56 – 1.63, P < .01).
White patients
In White patients, adjusted mortality rates in nine regions were significantly higher than the other regions (HR 1.25 – 1.94 using Region 3 as a reference, P < .05). Three regions demonstrated lower adjusted amputation rates than the other regions (HR 0.60 – 0.79 using Region 3 as a reference, P < .05). In contrast to survival and amputation rates, there was no difference in adjusted rates of MALE across regions.
Missing Data
The VQI records data at each follow-up visit around one year postoperatively. Overall, 68% of patients presented for follow-up or died. Black patients returned at lower rates than White patients (61% versus 69%, P < .001). In an attempt to control for these missing data on amputation and MALE rates, we performed sensitivity analyses excluding centers with less than 50% follow-up rates. We found no significant difference in the adjusted rates of mortality, MALE or amputation in this modified data set compared to our full analysis. We also performed sensitivity analyses in which we assigned all Black patients with missing data to either all having an event, or not having an event. Our results were robust, as there was no significant difference in event rates with either change. When all Black patients with missing data were assigned to be event-free, Black patients still experienced higher adjusted rates of MALE: (HR 1.15 [1.06 – 1.25], P < .01); and amputation: (HR 1.28 [1.14 – 1.45], P < .01). When all Black patients with missing data were assigned to have an event, Black patients experienced even higher adjusted rates of MALE: (HR 1.21 [1.12 – 1.32], P < .01); and amputation: (HR 1.92 [1.72 – 2.16], P < .01).
Discussion
Our study demonstrates substantial regional variation in outcomes between Black and White patients with peripheral artery disease, both between and within racial groups. These differences in short-term outcomes likely reflect the effect of differences in local factors such as access to care, insurance status, and treatment at high volume centers, all of which varied significantly across regions.
In contrast, despite significant differences in long-term outcomes between Black and White patients, regional variation did not contribute significantly to these disparities. We demonstrated regional variation in long-term outcomes within racial groups (i.e., White patients in one region experience different rates of outcomes than White patients in another region, and the same for Black patients) but found no significant regional variation in long-term outcomes between Black and White patients across regions. Rates of survival in Black patients, but also MALE and amputation, were consistently higher than White patients across all regions.
This work builds on a broad foundation of previous literature that established both the racial disparities experienced by patients with PAD, as well as regional variation in surgical outcomes. Several prior studies revealed that Black patients experience disproportionately higher amputation rates, both in terms of primary amputation and secondary amputation, and similarly higher rates of limb events.1,6,8–10,25–28 Paradoxically, however, two prior studies demonstrated higher survival in Black patients.13,29 Our study confirms these findings in a large, robust clinical registry, and provides several potential explanations. Black patients were significantly younger, more likely female, and were more likely diabetic and less likely to have vascular disease in other territories. This difference in the distribution of the comorbidities may explain the apparent survival paradox, as a young, female patient with a diabetic foot ulcer is likely to live longer than an older male smoker with dry gangrene. Thus, although race, insurance status, access to care, etc. may affect survival as well, and certainly affect rate of amputation and MALE, age, gender, and diabetes status may influence survival slightly more. We attempt to control for these comorbidities using multivariable methods, but residual confounding likely remains.
A similar wealth of prior works validated the influence of regional and geographic factors on surgical decision-making, costs, and outcomes. Birkmeyer et al. and Dimick et al. published widely on the topic of regional variation in a variety of surgical disciplines, including general, bariatric, thoracic, and high-risk surgeries.14–17,19 More recently, our group confirmed the presence of regional variation in vascular surgery as well, from carotid and peripheral artery disease to abdominal aortic aneurysms.6,23,24,30
Regional variation is an important theme in modern surgical practice, as it represents a potentially modifiable factor to improve outcomes. Efforts such as the VQI, which provides feedback to its members as to how their results compare to other regions and centers, enable quality improvement efforts to improve outcomes in underperforming regions by adopting best practices from high quality institutions. Our work, combined with prior research in the area, identifies several potential targets for improvement. Black patients in this study were more likely to be on Medicaid or uninsured/self-pay, and were more likely to undergo care at a low volume center. Eslami et al. demonstrated that non-White, low-income patients without commercial insurance were more likely to undergo amputation.31 Similarly, Goodney et al. found that patients in regions with the highest amputation rates were more likely Black and diabetic.21 Most strikingly, Dimick et al. showed that although Black patients were more likely to live near a high-quality hospital, they were more likely to undergo care at low-quality hospitals. Efforts to address these disparities should center on identifying vulnerable populations and high-risk patients that would benefit from treatment at high-volume, high-quality hospitals.
This study must be interpreted in the context of its design. Although we know the primary insurer of most of the patients in our study, we lacked insurance information on 20% of patients. In addition, we only know the primary insurer and do not capture secondary insurance and, most notably, cannot identify patients with both Medicare and Medicaid eligibility. Numerous works, including a white paper from the Centers for Medicare and Medicaid Services, show this to be a vulnerable, high-risk population.32–36 The VQI also only records de-identified regions, but not zip codes or other, more specific markers of socioeconomic status, so we are unable to fully control for those factors in our models. In addition, with over a third of our patients lost to follow-up, we likely miss some limb events (mortality is captured more robustly through linkage to the Social Security Death Index). Indeed, as Black patients were less likely to present in follow-up, they likely experience even higher rates of amputation and limb events relative to White patients. Our sensitivity analysis reveals that amputation rates could be as high as almost double the rates experienced by White patients.
Conclusion
Significant racial disparities exist in outcomes following lower extremity procedures in patients with PAD, with regional variation contributing to perioperative, but not long-term outcome disparities. Underperforming regions should utilize these data to generate quality improvement projects, as understanding the etiology of these disparities is critical to improving the care of all patients with PAD.
Acknowledgments
TO and SD are supported by the Harvard-Longwood Research Training in Vascular Surgery NIH T32 Grant 5T32HL007734-22
Footnotes
Publisher's Disclaimer: This is a PDF file of an unedited manuscript that has been accepted for publication. As a service to our customers we are providing this early version of the manuscript. The manuscript will undergo copyediting, typesetting, and review of the resulting proof before it is published in its final citable form. Please note that during the production process errors may be discovered which could affect the content, and all legal disclaimers that apply to the journal pertain.
References
- 1.Regenbogen SE, Gawande AA, Lipsitz SR, Greenberg CC, Jha AK. Do Differences in Hospital and Surgeon Quality Explain Racial Disparities in Lower-Extremity Vascular Amputations? Trans Meet Am Surg Assoc. 2009 Sep;127(3):68–75. doi: 10.1097/SLA.0b013e3181b41d53. [DOI] [PubMed] [Google Scholar]
- 2.Nguyen LL, Henry AJ. Disparities in vascular surgery: is it biology or environment? J Vasc Surg. 2010 Apr;51(4 Suppl):36S–41S. doi: 10.1016/j.jvs.2010.02.003. [DOI] [PMC free article] [PubMed] [Google Scholar]
- 3.Lo RC, Bensley RP, Dahlberg SE, Matyal R, Hamdan AD, Wyers M, et al. Presentation, treatment, and outcome differences between men and women undergoing revascularization or amputation for lower extremity peripheral arterial disease. J Vasc Surg. 2014 Feb;59(2):409–418.e3. doi: 10.1016/j.jvs.2013.07.114. [DOI] [PMC free article] [PubMed] [Google Scholar]
- 4.Rowe VL, Weaver FA, Lane JS, Etzioni DA. Racial and ethnic differences in patterns of treatment for acute peripheral arterial disease in the United States, 1998–2006. J Vasc Surg. 2010 Apr;51(4):S21–6. doi: 10.1016/j.jvs.2009.09.066. [DOI] [PubMed] [Google Scholar]
- 5.Allison MA, Ho E, Denenberg JO, Langer RD, Newman AB, Fabsitz RR, et al. Ethnic-specific prevalence of peripheral arterial disease in the United States. Am J Prev Med. 2007 Apr;32(4):328–33. doi: 10.1016/j.amepre.2006.12.010. [DOI] [PubMed] [Google Scholar]
- 6.Soden PA, Zetervall SL, Deery SE, Hughes K, Stoner M, Goodney Philip P, MDM, et al. Disparities in Patient Selection/Presentation for Initial Vascular Procedure Between Black and White Patients. J Vasc Surg. 2016;63(6):101S–102S. [Google Scholar]
- 7.Sidawy AN, Schweitzer EJ, Neville RF, Alexander EP, Temeck BK, Curry KM. Race as a risk factor in the severity of infragenicular occlusive disease: study of an urban hospital patient population. J Vasc Surg. 1990 Apr;11(4):536–43. [PubMed] [Google Scholar]
- 8.Holman KH, Henke PK, Dimick JB, Birkmeyer JD. Racial disparities in the use of revascularization before leg amputation in Medicare patients. J Vasc Surg. 2011 Aug;54(2):420–426.e1. doi: 10.1016/j.jvs.2011.02.035. [DOI] [PMC free article] [PubMed] [Google Scholar]
- 9.Loja MN, Brunson A, Li C-S, Carson JG, White RH, Romano PS, et al. Racial Disparities in Outcomes of Endovascular Procedures for Peripheral Arterial Disease: An Evaluation of California Hospitals, 2005–2009. Ann Vasc Surg. 2015 Jul;29(5):950–9. doi: 10.1016/j.avsg.2015.01.006. [DOI] [PMC free article] [PubMed] [Google Scholar]
- 10.Jain AK, Kalbaugh CA, Farber MA, Marston WA, Vallabhaneni R. Race and gender affect outcomes of lower extremity bypass. J Vasc Surg. 2014 Nov;60(5):1275–81. doi: 10.1016/j.jvs.2014.04.069. [DOI] [PubMed] [Google Scholar]
- 11.Loja MN, Brunson A, Li C-S, Carson JG, White RH, Romano PS, et al. Racial disparities in outcomes of endovascular procedures for peripheral arterial disease: an evaluation of California hospitals, 2005–2009. Ann Vasc Surg. 2015 Jul;29(5):950–9. doi: 10.1016/j.avsg.2015.01.006. [DOI] [PMC free article] [PubMed] [Google Scholar]
- 12.Selvarajah S, Black JH, Haider AH, Abularrage CJ. Racial disparity in early graft failure after infrainguinal bypass. J Surg Res. 2014 Jul;190(1):335–43. doi: 10.1016/j.jss.2014.04.029. [DOI] [PubMed] [Google Scholar]
- 13.Brothers TE, Zhang J, Mauldin PD, Tonnessen BH, Robison JG, Vallabhaneni R, et al. Better survival for African and Hispanic/Latino Americans after infrainguinal revascularization in the Society for Vascular Surgery Vascular Quality Initiative. J Vasc Surg. 2017 Feb 8; doi: 10.1016/j.jvs.2016.10.105. [DOI] [PubMed] [Google Scholar]
- 14.Rosenberg BL, Kellar JA, Labno A, Matheson DHM, Ringel M, VonAchen P, et al. Quantifying Geographic Variation in Health Care Outcomes in the United States before and after Risk-Adjustment. Taniyama Y, editor. PLoS One. 2016 Dec 14;11(12):e0166762. doi: 10.1371/journal.pone.0166762. [DOI] [PMC free article] [PubMed] [Google Scholar]
- 15.Ibrahim AM, Ghaferi AA, Thumma JR, Dimick JB. Variation in Outcomes at Bariatric Surgery Centers of Excellence. JAMA Surg. 2017 Apr 26; doi: 10.1001/jamasurg.2017.0542. [DOI] [PMC free article] [PubMed] [Google Scholar]
- 16.Healy MA, Regenbogen SE, Kanters AE, Suwanabol PA, Varban OA, Campbell DA, et al. Surgeon Variation in Complications With Minimally Invasive and Open Colectomy. JAMA Surg. 2017 Jun 14; doi: 10.1001/jamasurg.2017.1527. [DOI] [PMC free article] [PubMed] [Google Scholar]
- 17.Birkmeyer JD, Stukel TA, Siewers AE, Goodney PP, Wennberg DE, Lucas FL. Surgeon Volume and Operative Mortality in the United States. N Engl J Med. 2003 Nov 27;349(22):2117–27. doi: 10.1056/NEJMsa035205. [DOI] [PubMed] [Google Scholar]
- 18.Finks JF, Osborne NH, Birkmeyer JD. Trends in Hospital Volume and Operative Mortality for High-Risk Surgery. N Engl J Med. 2011 Jun 2;364(22):2128–37. doi: 10.1056/NEJMsa1010705. [DOI] [PMC free article] [PubMed] [Google Scholar]
- 19.Ghaferi AA, Birkmeyer JD, Dimick JB. Variation in Hospital Mortality Associated with Inpatient Surgery. N Engl J Med. 2009 Oct 10;361(14):1368–75. doi: 10.1056/NEJMsa0903048. [DOI] [PubMed] [Google Scholar]
- 20.Dartmouth Atlas of Health Care [Internet] [cited 2017 Jun 26]. Available from: http://www.dartmouthatlas.org/
- 21.Goodney PP, Holman K, Henke PK, Travis LL, Dimick JB, Stukel TA, et al. Regional intensity of vascular care and lower extremity amputation rates. J Vasc Surg. 2013 Jun;57(6):1471–1480.e3. doi: 10.1016/j.jvs.2012.11.068. [DOI] [PMC free article] [PubMed] [Google Scholar]
- 22.Birkmeyer JD, Reames BN, McCulloch P, Carr AJ, Campbell WB, Wennberg JE. Understanding of regional variation in the use of surgery. Lancet. 2013 Sep 28;382(9898):1121–9. doi: 10.1016/S0140-6736(13)61215-5. [DOI] [PMC free article] [PubMed] [Google Scholar]
- 23.Zettervall SL, Soden PA, Buck DB, Cronenwett JL, Goodney PP, Eslami MH, et al. Significant regional variation exists in morbidity and mortality after repair of abdominal aortic aneurysm. J Vasc Surg. 2017 May;65(5):1305–12. doi: 10.1016/j.jvs.2016.08.110. [DOI] [PMC free article] [PubMed] [Google Scholar]
- 24.Shean KE, McCallum JC, Soden PA, Deery SE, Schneider JR, Nolan BW, et al. Regional variation in patient selection and treatment for carotid artery disease in the Vascular Quality Initiative. J Vasc Surg. 2017 Jul;66(1):112–21. doi: 10.1016/j.jvs.2017.01.023. [DOI] [PMC free article] [PubMed] [Google Scholar]
- 25.Goodney PP, Travis LL, Brooke BS, DeMartino RR, Goodman DC, Fisher ES, et al. Relationship Between Regional Spending on Vascular Care and Amputation Rate. JAMA Surg. 2014 Jan 1;149(1):34. doi: 10.1001/jamasurg.2013.4277. [DOI] [PMC free article] [PubMed] [Google Scholar]
- 26.Meadows TA, Bhatt DL, Cannon CP, Gersh BJ, Röther J, Goto S, et al. Ethnic differences in cardiovascular risks and mortality in atherothrombotic disease: insights from the Reduction of Atherothrombosis for Continued Health (REACH) registry. Mayo Clin Proc. 2011 Oct;86(10):960–7. doi: 10.4065/mcp.2011.0010. [DOI] [PMC free article] [PubMed] [Google Scholar]
- 27.Ayanian JZ, Landon BE, Newhouse JP, Zaslavsky AM. Racial and ethnic disparities among enrollees in Medicare Advantage plans. N Engl J Med. 2014 Dec 11;371(24):2288–97. doi: 10.1056/NEJMsa1407273. [DOI] [PMC free article] [PubMed] [Google Scholar]
- 28.Rowe VL, Weaver FA, Lane JS, Etzioni DA. Racial and ethnic differences in patterns of treatment for acute peripheral arterial disease in the United States, 1998–2006. J Vasc Surg. 2010 Apr;51(4 Suppl):21S–26S. doi: 10.1016/j.jvs.2009.09.066. [DOI] [PubMed] [Google Scholar]
- 29.Brothers TE, Robison JG, Sutherland SE, Elliott BM. Racial differences in operation for peripheral vascular disease: results of a population-based study. Cardiovasc Surg. 1997 Feb;5(1):26–31. doi: 10.1016/s0967-2109(96)00073-7. [DOI] [PubMed] [Google Scholar]
- 30.Soden PA, Zettervall SL, Curran T, Vouyouka AG, Goodney PP, Mills JL, et al. Regional variation in patient selection and treatment for lower extremity vascular disease in the Vascular Quality Initiative. J Vasc Surg. 2016 doi: 10.1016/j.jvs.2016.06.105. [DOI] [PMC free article] [PubMed] [Google Scholar]
- 31.Eslami MH, Zayaruzny M, Fitzgerald GA. The adverse effects of race, insurance status, and low income on the rate of amputation in patients presenting with lower extremity ischemia. J Vasc Surg. 2007;45(1):55–9. doi: 10.1016/j.jvs.2006.09.044. [DOI] [PubMed] [Google Scholar]
- 32.Centers for Medicare and Medicaid Services. March 31, 2016; HHS-Operated Risk Adjustment Methodology Meeting White Paper. [Google Scholar]
- 33.Bradley CJ, Dahman B, Given CW. Treatment and Survival Differences in Older Medicare Patients With Lung Cancer as Compared With Those Who Are Dually Eligible for Medicare and Medicaid. J Clin Oncol. 2008 Nov;26(1)(31):5067–73. doi: 10.1200/JCO.2008.16.3071. [DOI] [PMC free article] [PubMed] [Google Scholar]
- 34.Rahman M, Tyler D, Thomas KS, Grabowski DC, Mor V. Higher Medicare SNF Care Utilization by Dual-Eligible Beneficiaries: Can Medicaid Long-Term Care Policies Be the Answer? Health Serv Res. 2015 Feb;50(1):161–79. doi: 10.1111/1475-6773.12204. [DOI] [PMC free article] [PubMed] [Google Scholar]
- 35.Guadagnolo BA, Liao K-P, Giordano SH, Elting LS, Shih Y-CT. Variation in Intensity and Costs of Care by Payer and Race for Patients Dying of Cancer in Texas. Med Care. 2015 Jul;53(7):591–8. doi: 10.1097/MLR.0000000000000369. [DOI] [PMC free article] [PubMed] [Google Scholar]
- 36.Kimmel PL, Fwu C-W, Abbott KC, Ratner J, Eggers PW. Racial disparities in poverty account for mortality differences in US medicare beneficiaries. SSM - Popul Heal. 2016 Dec;2:123–9. doi: 10.1016/j.ssmph.2016.02.003. [DOI] [PMC free article] [PubMed] [Google Scholar]


