

Abstract
Inherited retinal diseases (IRDs) are heterogeneous phenotypes caused by variants in a large number of genes. Disease prevalence and the frequency of carriers in the general population have been estimated in only a few studies, but are largely unknown. To this end, we developed two parallel methods to calculate carrier frequency for mutations causing autosomal-recessive (AR) IRDs in the Israeli population. We created an SQL database containing information on 178 genes from gnomAD (including genotyping of 5706 Ashkenazi Jewish (AJ) individuals) and our cohort of >2000 families with IRDs. Carrier frequency for IRD variants and genes was calculated based on allele frequency values and the Hardy–Weinberg (HW) equation. We identified 399 IRD-causing variants in 111 genes in Israeli patients and AJ controls. For the AJ subpopulation, gnomAD and HW-based regression analysis showed high correlation, therefore allowing one to use HW-based data as a reliable estimate of carrier frequency. Overall, carrier frequency per subpopulation ranges from 1/2.2 to 1/9.6 individuals, with the highest value obtained for the Arab-Muslim subpopulation in Jerusalem reaching an extremely high carrier rate of 44.7%. Carrier frequency per gene ranges from 1/31 to 1/11994 individuals. We estimate the total carrier frequency for AR-IRD mutations in the Israeli population as over 30%, a relatively high carrier frequency with marked variability among subpopulations. Therefore, these data are highly important for more reliable genetic counseling and genetic screening. Our method can be adapted to study other populations, either based on allele frequency data or cohort of patients.
Introduction
The number of autosomal-recessive (AR) mutations causing Mendelian diseases that are carried by unaffected human individuals is unknown, but recent studies revealed interesting insights into this topic. By studying the North-American Hutterite population for common AR diseases, a carrier burden of 1.096 has been calculated with 0–5 mutations that are carried by each individual [1]. Studying the same population, an average of 0.58 AR lethal mutations per genome were calculated [2]. An analysis of 185 whole-genome sequencing (WGS) samples aiming to systematically identify loss-of-function (LoF) alleles showed that a human genome contains ~100 LoF variants, the vast majority of which are unlikely to be pathogenic, and only 0.13 LoF variants per genome are predicted to cause a severe disease [3]. One of the major obstacles in calculating the accurate carrier frequency for AR disease-causing mutations is the correct annotation of variants with respect to their pathogenicity. This problem is well-described in the analysis of 179 WGS control samples as part of the 1000 Genomes Pilot Project aiming to assess the number of potentially deleterious variants in the genomes of apparently healthy humans [4]. A large number of missense variants (281–515 per individual) that are predicted to be deleterious was identified, with 40–110 listed as pathogenic in the Human Genome Mutation Database (HGMD—http://www.hgmd.cf.ac.uk/ac/index.php). However, the authors pointed out that many of these variants are likely to represent disease-allele-annotation errors, and only 0–8 variants per individual are predicted to be highly damaging and provide information of medical relevance [4].
Inherited retinal diseases (IRDs) are caused by variants in genes that are responsible for retinal structure or function with a variable age of onset. IRDs are a group of genetically heterogeneous phenotypes and can be transmitted in different modes of inheritance, with AR and autosomal dominant (AD) being the most common [5]. The total number of IRD genes is still unknown and currently there are over 250 identified genes (RETNET database—https://sph.uth.edu/retnet/). The prevalence of retinitis pigmentosa (RP) has been studied in a few populations and found to range between 1:2086 and 1:4869 [5, 6]. Although IRD prevalence is relatively low, total carrier frequency of IRD-causing mutations is expected to be very high. The carrier frequency of mutations causing AR-IRDs in the worldwide population has been estimated in two studies thus far [7, 8]. In the earlier study, a carrier frequency calculation was solely based on the prevalence of autosomal recessive retinitis pigmentosa (ARRP) and the predicted number of causative genes with an equal contribution [8]. In the second study, null variants in IRD genes were screened in an analysis of 46 WGS of control individuals [7]. Both studies reached a similar conclusion that the carrier frequency for recessive IRD variants is estimated as 16–22% or 1 out of 4–6 control individuals.
The Israeli population includes many different subpopulations (Jews of various origins, Arab Muslims, Druze, Bedouins, and so on). The Jews in the Israeli population were divided into isolated ethnic groups that were separated geographically throughout practically the entire world. Within these semi-isolated ethnic groups, the need and desire to maintain religion and culture led to relatively high levels of intracommunity marriages. Similarly, individuals of Arab-Muslim origin tend to live in villages that were founded a few generations ago by a small number of individuals. In accordance with the customs of the Arab population throughout the Middle East, consanguineous marriages are common among Israeli Arabs, with a preference for first-cousin marriages. The Bedouin population is unique in its structure, which is tribal, and exhibits an extremely high level of consanguinity. All the above led to a higher prevalence of AR diseases, including IRDs, in the Israeli population compared to other populations around the world. Genetic analysis of AR diseases in the different subpopoulations led to the discovery and characterization of founder mutations that cause IRDs.
The development of new sequencing strategies known as next-generation sequencing (NGS) revolutionized genetic studies, mainly due to the high amount of sequencing data generated by these methods. Subsequently, a large number of highly important NGS-based databases is now available, including gnomAD [9], as well as those linking specific mutations to Mendelian diseases, including ClinVar [10], Leiden open variation database (LOVD) [11–13], and HGMD. These databases provide an excellent tool for studying the pattern and frequency of variants and diseases in different populations.
To date, there are no studies regarding IRD carrier frequency calculations in the Israeli population. To this end, we extracted information regarding IRD variants from various sources (including data of 5706 Ashkenazi Jewish (AJ) samples and a large cohort of Israeli patients with IRDs) to estimate carrier frequency of IRD mutations in different subpopulations in Israel. This information will assist in obtaining a more accurate genetic counseling in this population and is likely to serve as a basis for similar studies in other populations as well.
Methods
Recruitment of patients
The study protocols adhered to the tenets of the Declaration of Helsinki and received approval from the local Ethics Committee of all participant institutes: Hadassah Medical Center, Rambam Health Care Campus, Tel-Aviv Medical Center, Assaf Harofeh Medical Center, and the Soroka Medical Center. Prior to donation of a blood sample, a written informed consent was obtained from all individuals who participated in this study, after explanation of the nature and possible consequences of the study.
Bioinformatic analyses
We used the GRCh37/hg19 version for all position descriptions. We established an SQL-based database containing 12272 variants that appear in 178 IRD genes (Table S1) in 5706 individuals of AJ origin based on the gnomAD database (version 2). The database also includes information on variants that were published in the scientific literature that was extracted from HGMD. Information regarding subpopulation size is presented in Table S2. Individual’s information has been deposited in the LOVD database (Individuals: 155314-155590).
Statistical data
The gnomAD database provides the following values for each subpopulation: “allele count” (the number of alleles that include the variant and identified in heterozygous and homozygous individuals; equals to 2pq + 2 × q2 in the Hardy–Weinberg (HW) equation), “allele number” (total number of genotyped alleles in the population; equals to twice the number of individuals), and “homozygote count” (total number of homozygous individuals). Based on these values, we calculated the following parameters (Table S3): minor allele frequency (MAF), total number of individuals, number of heterozygous individuals, number of wild-type individuals and carrier frequency. In addition, using the HW equation, we calculated carrier frequency values based on the number of affected individuals in our cohort of patients. Carrier frequency was calculated as 2pq where p = 1 − q and q was calculated as the root square of the number of homozygous patients plus half the number of compound heterozygous patients divided by the population size, as shown in the following equation (see also Table S3): q =
Statistical analyses
Outliers were defined as values over the following limits (fences) based on the respective Quartiles (Q) values: Q1−1.5 × IQ or Q3 + 1.5 × IQ, or Q1 − 3 × IQ or Q3 + 3 × IQ (where IQ = Q3 − Q1). Outliers were detected using the web tool outlier calculator (http://www.miniwebtool.com/outlier-calculator/). A correlation analysis (including p-value calculation) was performed on 32 variants that appear in both gnomAD and our cohort of patients.
Results
Establishing the carrier frequency database
We generated two major databases aiming to estimate carrier frequency of IRD mutations in the Israeli population (Fig. 1): “gnomAD-AJ-IRD DB” containing data of 5706 AJ controls extracted from gnomAD and “HW-IRD DB” containing data extracted from our cohort of Israeli patients with IRDs. While the former is specific to a single subpopulation (AJ), the latter includes information on all nine subpopulations studied here.
Fig. 1.
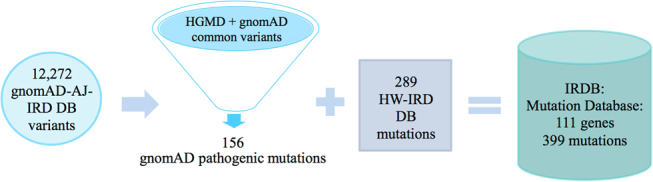
A diagram summarizing the establishment of different databases used in this study. We integrated data from AJ individuals in gnomAD (gnomAD-AJ-IRD DB), HGMD, and data obtained from our cohort of >2000 patients (HW-IRD DB) to establish an IRDB including 399 pathogenic mutations identified in 111 IRD genes in the Israeli population
To establish the “gnomAD-AJ-IRD DB”, we tabulated 12272 variants (Fig. 2) that were found in AJ samples in gnomAD in 178 known IRD genes (Table S1). We excluded from “gnomAD-AJ-IRD DB” 1398 variants that appear only once (identified heterozygously in only one individual). The remaining 10874 variants were divided into two subgroups, 10793 IRD variants, and 81 non-IRD variants (reported to cause a disease that does not include a retinal phenotype) based on previous studies and HGMD that were excluded from further analyses. The remaining 10793 IRD variants (Fig. 2) were subsequently divided into two groups based on the expected effect on the encoded proteins: the “Null variants” group includes 106 frameshift, splice-site, and nonsense variants and the “Other variants” group includes the remaining 10687 variants (Fig. 2). Although the “Null variants” group contains mainly pathogenic mutations, some non-pathogenic variants were also included and therefore were filtered-out from the analysis. We considered true pathogenic null variants if MAF (both in the AJ group and the overall value in gnomAD) was <0.005 (a total of 82 variants), except for one variant in PCDH15 that was excluded manually. The remaining 24 “null” variants were manually examined, leading to the verification of two variants, while the remaining 22 “Null variants” were considered non-pathogenic (Table S4). To accurately analyze the remaining 10687 “Other variants”, we considered variants as possibly pathogenic only if they were included in HGMD (a total of 244 variants). Since HGMD is known to include non-pathogenic variants [14, 15], we classified these 244 variants based on MAF values. Most of the variants (149 out of 244) had MAF values <0.005 and were examined manually by inspecting previous reports. We concluded that 82 of the variants are non-pathogenic while the remaining 67 were reported to cause IRD and are considered true pathogenic mutations. The 95 variants with MAF values over 0.005 that are listed in HGMD were also examined manually: 5 were considered pathogenic. Overall, from the manually checked variants in the “Other variants” group, we concluded that 172 variants are non-pathogenic (Table S5). We included in the pathogenic list one variant in SLC38A8 reported as pathogenic but not included in HGMD. These filtering steps resulted in a total of 156 likely disease-causing mutations in 80 known IRD genes from AJ individuals in gnomAD (blue box in Fig. 2). Interestingly, 9 individuals in AJ-gnomAD are homozygous for IRD-causing mutations (including those that are expected to result in congenital phenotypes—Table S6), resulting in an estimated IRD prevalence of 1:634 affected homozygous individuals.
Fig. 2.

A flow chart demonstrating the analysis scheme of variants downloaded from 178 gene entries in gnomAD. A total of 12272 variants were found in individuals of AJ origin, and after filtering out variants that were non-reliable and unlikely pathogenic, 156 pathogenic mutations were identified (blue box), 83 null and 73 other variants that are mainly missense variants
To establish the “HW-IRD DB” (Fig. 1), we collected data on Israeli IRD patients with a known cause of disease (a cohort of >2000 IRD families). For each disease-associated variant, we counted the number of homozygous patients as well as the number of compound heterozygous patients. These data were used to estimate carrier frequencies of IRD-causing mutations based on the HW equation as described in the M&M section and Table S3. Since the HW equation does not fully fit human populations, especially those with consanguineous and intracommunity marriages, we examined the correlation between carrier frequency values obtained in AJ for 32 variants that appear in both gnomAD-AJ-IRD DB and HW-IRD DB (Fig. 3). The analysis revealed one outlier, ABCA4-c.5882G>A, p.(Gly1961Glu) with carrier frequency of 4.5% in AJ compared to 0.3% based on HW (Fig. 3a), and therefore was excluded from further carrier frequency analyses. The regression analysis (Fig. 3b) showed a significant correlation (R2 = 0.50), therefore allowing one to use HW-based data as a reliable estimate of carrier frequency. For the remaining subpopulations, only HW-based data were available and used for further carrier frequency calculations. The HW-IRD DB includes 289 pathogenic mutations (Fig. 1) that were identified in IRD patients who have biallelic variants.
Fig. 3.
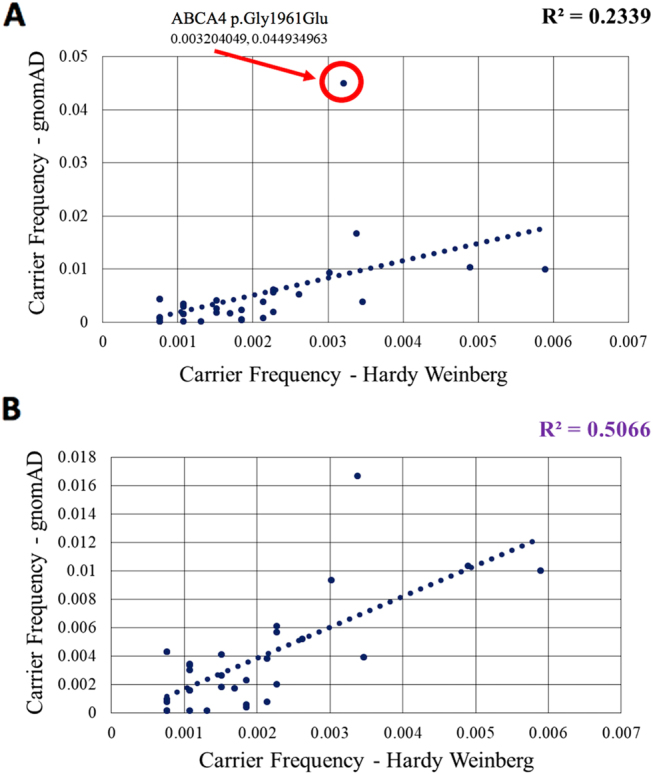
Carrier frequency correlation of mutations identified in AJ based on the Hardy–Weinberg equation and gnomAD including (a) and excluding (b) ABCA4-c.5882G>A. Only mutations in both databases were included. Note that ABCA4-c.5882G>A is an outlier and therefore correlation coefficiency is lower in a
Our final DB (IRDB) (Fig. 1 and Table S7) includes all 399 variants from “gnomAD-AJ-IRD DB” and “HW-IRD DB” that were considered here as pathogenic mutations in 111 known IRD genes. The list of variants (Table S7) includes carrier frequency data for each mutation in all nine studied subpopulations. Almost 42% of the variants (167 out of 399) are missense, followed by frameshift (76 variants), and splice-site (46). The lists provided in tables S7 and S8 allow one to perform a more efficient genetic screening of newly identified patients or carrier screening based on the combination of phenotype and subpopulation.
Carrier frequency of founder mutations
The most frequent variants in our cohort are founder mutations: 114 of the 289 variants found in HW-IRD DB were found in multiple families of the same origin, indicating a founder effect. An analysis of the most common IRD variants (Fig. 4a) revealed that most of them show a population-specific effect, e.g., their carrier frequency is low or absent in most subpopulations, but is very high in one specific subpopulation. For example, a founder splice-site mutation in CERKL (c.238+1G>A) has been identified only in patients of Yemenite Jewish (YJ) origin [16] with a carrier frequency of 4% (Fig. 4a), and was never identified in individuals of other origins. Similarly, the founder mutation CNGA3-p.(Ile314del) was found only in Arab Muslims of the vicinity of Jerusalem (AMJ) with a carrier frequency of 1.6%. On the other hand, some variants appear in multiple ethnic groups: the CNGA3-p.(Val529Met) founder mutation [17] that appears in both Oriental Jews (OJ) and AMJ (Fig. 4a) and the pan-ethnic variant ABCA4-c.5882G>A that is common in all Israeli subpopulations (ranging from 2.6 to 5%, Fig. 4a and Table S9).
Fig. 4.

Characterization of carrier frequencies for IRD mutations. a 3D distribution of the 10 most common disease-causing mutations in different Israeli subpopulations. b Calculated (darker bars) and extrapolated (transparent bars) carrier frequency values in each of the 9 studied subpopulations including all 399 mutations in IRDB. Please note that the carrier frequency value in AJ is composed of both gnomAD and HW databases and is therefore higher comparing the other subpopulations with HW data only. c Distribution of IRD genes by carrier frequency. d Calculated carrier frequency for each retinal phenotypes (in some IRD genes, mutations can cause multiple phenotypes, and this has been included in this analysis). AJ Ashkenazi Jews, OJ Oriental Jews, NAJ North African Jews, YJ Yemenite Jews, AMJ Arab Muslims from the vicinity of Jerusalem, AMO Arab Muslims residing in other regions (mainly the north part of the country), AC Arab Christians, BE Bedouins, DR Druze
Carrier frequency in subpopulations
Overall, carrier frequency for all IRD disease-causing mutations per subpopulation ranges from 1 out of 2.2 individuals to 1 out of 9.6 individuals (Fig. 4b—dark bars). Two subpopulations showed extremely high carrier frequency values: AMJ reaching a carrier frequency rate of 44.67% and AJ (34%). We estimated the total carrier frequency for at least one of the AR-IRD mutations in the Israeli population as 25%. This value will increase as additional mutations and disease-causing genes are identified. Taking into account that we were able to solve 52% of IRD cases in our cohort, we would expect the final number of alleles that carry disease-causing mutations to be at least twice the current one. We extrapolated our calculations multiplying the number of alleles for each variant by two (except the gnomAD data) (Fig. 4b—light bars). The carrier frequency in the AMJ subpopulation is still the highest with a carrier frequency of 63%. The carrier frequency in the AJ subpopulation was not affected by this extrapolation, since the original analysis was based mostly on gnomAD data. A few AJ variants did not appear in gnomAD mainly due to two reasons: they were not detected by NGS (e.g., the Alu insertion in the MAK gene) or had a low frequency and were not represented in gnomAD individuals. The remaining subpopulations showed much lower carrier frequencies ranging from 26% in the OJ subpopulation to 14.6% in the Arab Christian (AC) subpopulation. Carrier frequency per gene ranges from 1 out of 31 individuals to 1 out of 11,994 individuals in the different subpopulations with ABCA4, USH2A, and CNGA3, being the most common ones (Fig. 4c) with average carrier frequency of 1/31, 1/45, and 1/61, respectively. Carrier frequency analysis of the different phenotypes (Fig. 4d) shows that RP has the highest frequency, followed by Stargardt disease, Usher syndrome, and achromatopsia.
Discussion
One of the major open questions in human genetics is how many Mendelian disease-causing mutations each individual carries in their genome. For diseases that are inherited as either AD with full penetrance or X-linked in males, this can be estimated based on disease prevalence values in each subpopulation. However, AR heterozygous disease-causing mutations do not result in a phenotype, and therefore their frequency in a given population is usually unknown. To this end, large genetic sequencing databases (such as gnomAD) and mutation databases (such as HGMD) can be extremely useful in answering such questions. The gnomAD database includes NGS data of a large number of individuals, and assuming an unbiased sample collection, this provides the best tool for directly obtaining MAF and carrier frequency values for the vast majority of AR disease-causing mutations. Since about 10–20% of disease-causing mutations (including deep-intronic variants and large deletions/insertions) are more challenging for discovery (mainly by WES), recent studies reported on the development of successful tools for detecting such variants in about 10% of unsolved IRD samples [18, 19].
Although gnomAD provides an excellent tool for predicting carrier frequencies in some populations, most of the worldwide populations are not represented in this database, and therefore alternative methods should be explored to determine carrier frequency of a particular mutation, gene, or disease. To this end, large cohorts of patients with known genetic etiology of disease can be a valuable source, where using the HW equilibrium one can estimate carrier frequency of a particular mutation based on the number of affected individuals. Since HW equilibrium [20, 21] is based on several assumptions that do not fully fit any current human population, its usefulness for calculating carrier frequency in this regard needs to be established. Others and we [15] were able to show a strong correlation between these two methods thus paving the road for additional large-scale studies on various AR diseases that will unravel the question marks regarding the total carrier frequency of AR mutations.
Here, we took advantage of a subgroup in gnomAD (the AJ subpopulation) as well as our relatively large cohort of over 2000 IRD Israeli families to estimate carrier frequencies in different subpopulations. Our analysis show that carrier frequency for IRDs can be extremely high in specific subpopulations. For example, a total carrier frequency of almost 45% was identified in the Arab-Muslim population of Jerusalem. This is in agreement with our previously finding that the prevalence of RP is relatively high in this population (about three times higher than in other populations) [6].
Using the results of carrier frequency extrapolation calculation, we can predict that in the Israeli population as a whole, carrier frequency for any IRD mutation is likely to be around 30%, leading to an estimate of 2.6 million carriers in the population, some of whom are double carriers for disease-causing mutations in two different IRD genes. The current carrier frequency value based on the known disease-associated genes and solved cases is 25% (2.1 million individuals).
Full and accurate carrier frequency data is instrumental for effective genetic diagnosis and counseling. This information is useful for planning carrier screening programs and choosing the correct variants to screen specific ethnic groups in order to identify couples at risk. In addition, for patients or for known carriers of an IRD mutation, accurate carrier frequency data would allow a correct risk assessment and testing of spouses. Couples at risk can be offered pre-conception counseling and prenatal or pre-implantation genetic diagnosis for the prevention of birth of an affected offspring.
By calculating carrier frequency values for IRD mutations, we noted a clear outlier—ABCA4-c.5882G>A that is considered a pathogenic mutation (Table S9). However, while there seems to be concordance between MAF and its frequency among patients with Stargardt disease in the European and American populations, data presented here as well as data provided elsewhere on control individuals from Somalia (MAF of 5.65%) [22] raise the possibility that, at least in some populations, not all ABCA4-c.5882G>A alleles are pathogenic, otherwise one should expect over 6000 individuals homozygous for this variant (and hence affected by Stargardt disease in Israel alone). However, our cohort (covering roughly 1/3 of the total expected number of affected individuals in the population) includes only 31 homozygous and 41 compound heterozygous patients for this mutation. Since ABCA4-c.5882G>A is a pan-ethnic ancient allele with a relatively small shared haplotype, it is possible that another variant, possibly an intronic one, similar to those reported to be pathogenic in ABCA4 [23–26], could have occurred on an c.5882G>A-bearing allele, leading to two similar ABCA4 haplotypes, both containing c.5882G>A but only one (the relatively younger allele) contains the intronic variant. In such scenario, more ancient populations, including the African/Asian/Middle-Eastern populations, will have the tendency to harbor both alleles with a higher frequency of the ancient (non-pathogenic) one, while the European and North-American populations might be enriched with the newer (pathogenic) allele. This hypothesis will need to be verified by sequencing the whole ABCA4 gene in different alleles carrying c.5882G>A. If this presumption proves to be true, it will have a tremendous effect on genetic counseling in the relevant populations.
It should be noted that some likely disease-causing mutations with relatively high MAF values in the gnomAD-AJ cohort were not identified in our cohort of patients. This includes the following variants: ABCA4-c.5055G>A, CNGA3-c.101+1G>A and RGS9BP-c.307_326del. For some, however, the discrepancy can be explained by mutation effect on the protein and resulted phenotype. The ABCA4-c.5055G>A, p.(Val1686Met) variant has been reported to cause Stargardt disease when it appears in a compound heterozygous state with a null allele, and it is possible that it is not pathogenic in a homozygous state, as suggested for a few hypomorphic ABCA4 varants [12]. On the other hand, the lack of AJ patients with the RGS9BP-c.307_326del variant (showing a carrier frequency of 0.9% in gnomAD-AJ-DB) can be explained by the relatively mild retinal phenotype named bradyopsia (difficulty adapting to sudden changes in luminance levels) that has been reported to be caused by variants in this gene [27], therefore we predict that individuals who are homozygous for this variant were not diagnosed with a retinal disease and hence were not recruited for the study.
In summary, we present here, to the best of our knowledge, the first comprehensive analysis of carrier frequencies for AR mutations causing heterogeneous phenotypes. While it is straightforward to perform such analysis on a large cohort of control individuals (which is available in gnomAD), we showed that reliable data can be also extracted from large cohorts of patients identified as a result of research efforts for many AR diseases. Once similar data are obtained for other AR diseases, a clearer picture of the prevalence of disease-causing mutations in the human genome will be obtained (for different mutations, genes, and phenotypes), allowing more efficient gene identification and genetic counseling.
Electronic supplementary material
Acknowledgements
This study was funded by the Israeli Ministry of Health (grant numbers 3-10999 to D.S. and T.B.Y. and 3-12583 to H.N., E.P., L.G., E.B., T.B.Y., and D.S.).
Compliance with ethical standards
Conflict of interest
The authors declare that they have no conflict of interest.
Footnotes
Electronic supplementary material
The online version of this article (10.1038/s41431-018-0152-0) contains supplementary material, which is available to authorized users.
References
- 1.Chong JX, Ouwenga R, Anderson RL, Waggoner DJ, Ober C. A population-based study of autosomal-recessive disease-causing mutations in a founder population. Am J Hum Genet. 2012;91:608–20. doi: 10.1016/j.ajhg.2012.08.007. [DOI] [PMC free article] [PubMed] [Google Scholar]
- 2.Gao Z, Waggoner D, Stephens M, Ober C, Przeworski M. An estimate of the average number of recessive lethal mutations carried by humans. Genetics. 2015;199:1243–54. doi: 10.1534/genetics.114.173351. [DOI] [PMC free article] [PubMed] [Google Scholar]
- 3.Macarthur DG, Balasubramanian S, Frankish A, et al. A systematic survey of loss-of-function variants in human protein-coding genes. 2012;335:823–8. [DOI] [PMC free article] [PubMed]
- 4.Xue Y, Chen Y, Ayub Q, et al. Deleterious- and disease-allele prevalence in healthy individuals: insights from current predictions, mutation databases, and population-scale resequencing. Am J Hum Genet. 2012;91:1022–32. doi: 10.1016/j.ajhg.2012.10.015. [DOI] [PMC free article] [PubMed] [Google Scholar]
- 5.Hartong DT, Berson EL, Dryja TP. Retinitis pigmentosa. Lancet. 2006;368:1795–809. doi: 10.1016/S0140-6736(06)69740-7. [DOI] [PubMed] [Google Scholar]
- 6.Sharon D, Banin E. Nonsyndromic retinitis pigmentosa is highly prevalent in the Jerusalem region with a high frequency of founder mutations. Mol Vis. 2015;21:783–92. [PMC free article] [PubMed] [Google Scholar]
- 7.Nishiguchi KM, Rivolta C. Genes associated with retinitis pigmentosa and allied diseases are frequently mutated in the general population. PLoS ONE. 2012;7:5–7. doi: 10.1371/journal.pone.0041902. [DOI] [PMC free article] [PubMed] [Google Scholar]
- 8.Rivolta C, Sharon D, DeAngelis MM, Dryja TP. Retinitis pigmentosa and allied diseases: numerous diseases, genes, and inheritance patterns. Hum Mol Genet. 2002;11:1219–27. doi: 10.1093/hmg/11.10.1219. [DOI] [PubMed] [Google Scholar]
- 9.Lek M, Karczewski KJ, Minikel EV, et al. Analysis of protein-coding genetic variation in 60,706 humans. Nature. 2016;536:285–91. doi: 10.1038/nature19057. [DOI] [PMC free article] [PubMed] [Google Scholar]
- 10.Landrum MJ, Lee JM, Benson M, et al. ClinVar: public archive of interpretations of clinically relevant variants. Nucleic Acids Res. 2016;44:D862–8. doi: 10.1093/nar/gkv1222. [DOI] [PMC free article] [PubMed] [Google Scholar]
- 11.Cremers FPM, Dunnen JT, den, Ajmal M, et al. Comprehensive registration of DNA sequence variants associated with inherited retinal diseases in Leiden Open Variation Databases. Hum Mutat. 2014;35:147–8. doi: 10.1002/humu.22458. [DOI] [PMC free article] [PubMed] [Google Scholar]
- 12.Cornelis SS, Bax NM, Zernant J, et al. In silico functional meta-analysis of 5,962 ABCA4 variants in 3,928 retinal dystrophy cases. Hum Mutat. 2017;38:400–8. doi: 10.1002/humu.23165. [DOI] [PubMed] [Google Scholar]
- 13.Fokkema IF, Taschner PE, Schaafsma GC, Celli J, Laros JF, den Dunnen JT. LOVD v.2.0: the next generation in gene variant databases. Hum Mutat. 2011;32:557–63. doi: 10.1002/humu.21438. [DOI] [PubMed] [Google Scholar]
- 14.Stenson PD, Mort M, Ball EV, Shaw K, Phillips AD, Cooper DN. The Human Gene Mutation Database: building a comprehensive mutation repository for clinical and molecular genetics, diagnostic testing and personalized genomic medicine. Hum Genet. 2014;133:1–9. doi: 10.1007/s00439-013-1358-4. [DOI] [PMC free article] [PubMed] [Google Scholar]
- 15.Sleat DE, Gedvilaite E, Zhang Y, Lobel P, Xing J. Analysis of large-scale whole exome sequencing data to determine the prevalence of genetically-distinct forms of neuronal ceroid lipofuscinosis. Gene. 2016;593:284–91. doi: 10.1016/j.gene.2016.08.031. [DOI] [PMC free article] [PubMed] [Google Scholar]
- 16.Auslender N, Sharon D, Abbasi AH, Garzozi HJ, Banin E, Ben-Yosef T. A common founder mutation of CERKL underlies autosomal recessive retinal degeneration with early macular involvement among Yemenite Jews. Invest Ophthalmol Vis Sci. 2007;48:5431–8. doi: 10.1167/iovs.07-0736. [DOI] [PubMed] [Google Scholar]
- 17.Zelinger L, Greenberg A, Kohl S, Banin E, Sharon D. An ancient autosomal haplotype bearing a rare achromatopsia-causing founder mutation is shared among Arab Muslims and Oriental Jews. Hum Genet. 2010;128:261–7. doi: 10.1007/s00439-010-0846-z. [DOI] [PubMed] [Google Scholar]
- 18.Khateb S, Hanany M, Khalailah A, et al. Identification of genomic deletions causing inherited retinal degenerations by coverage analysis of whole exome sequencing data. J Med Genet. 2016;53:600–7. doi: 10.1136/jmedgenet-2016-103825. [DOI] [PubMed] [Google Scholar]
- 19.Van Cauwenbergh C, Van Schil K, Cannoodt R, et al. arrEYE: a customized platform for high-resolution copy number analysis of coding and noncoding regions of known and candidate retinal dystrophy genes and retinal noncoding RNAs. Genet Med. 2017;19:457–66. doi: 10.1038/gim.2016.119. [DOI] [PMC free article] [PubMed] [Google Scholar]
- 20.Hardy GH. Mendelian proportions in a mixed population. Science. 1908;28:49–50. doi: 10.1126/science.28.706.49. [DOI] [PubMed] [Google Scholar]
- 21.Weinberg W. Über den Nachweis der Vererbung beim Menschen. Jahresh Des Ver für Vaterl Nat Württemberg. 1908;64:368–82. [Google Scholar]
- 22.Guymer RH, Heon E, Lotery AJ, et al. Variation of codons 1961 and 2177 of the Stargardt disease gene is not associated with age-related macular degeneration. Arch Ophthalmol. 2001;119:745–51. doi: 10.1001/archopht.119.5.745. [DOI] [PubMed] [Google Scholar]
- 23.Schulz HL, Grassmann F, Kellner U, et al. Mutation spectrum of the ABCA4 gene in 335 Stargardt disease patients from a multicenter german cohort—impact of selected deep intronic variants and common SNPs. Invest Ophthalmol Vis Sci. 2017;58:394–403. doi: 10.1167/iovs.16-19936. [DOI] [PMC free article] [PubMed] [Google Scholar]
- 24.Bax NM, Sangermano R, Roosing S, et al. Heterozygous deep-intronic variants and deletions in ABCA4 in persons with retinal dystrophies and one exonic ABCA4 variant. Hum Mutat. 2015;36:43–7. doi: 10.1002/humu.22717. [DOI] [PubMed] [Google Scholar]
- 25.Braun TA, Mullins RF, Wagner AH, et al. Non-exomic and synonymous variants in ABCA4 are an important cause of Stargardt disease. Hum Mol Genet. 2013;22:5136–45. doi: 10.1093/hmg/ddt367. [DOI] [PMC free article] [PubMed] [Google Scholar]
- 26.Bauwens M, De Zaeytijd J, Weisschuh N, et al. An augmented ABCA4 screen targeting noncoding regions reveals a deep intronic founder variant in Belgian Stargardt Patients. Hum Mutat. 2015;36:39–42. doi: 10.1002/humu.22716. [DOI] [PubMed] [Google Scholar]
- 27.Nishiguchi KM, Sandberg MA, Kooijman AC, et al. Defects in RGS9 or its anchor protein R9AP in patients with slow photoreceptor deactivation. Nature. 2004;427:75–8. doi: 10.1038/nature02170. [DOI] [PubMed] [Google Scholar]
Associated Data
This section collects any data citations, data availability statements, or supplementary materials included in this article.