Abstract
The Cretaceous-Paleogene (K-Pg) mass extinction eradicated 76% of species on Earth1,2. It was caused by the impact of an asteroid3,4 on the Yucatán carbonate platform in the southern Gulf of Mexico at 66.0 Ma5 which formed the Chicxulub impact crater6,7. Following the mass extinction, recovery of the global marine ecosystem, measured in terms of primary productivity, was geographically heterogeneous8, as export production in the Gulf of Mexico and North Atlantic/Tethys took 300 kyr to return to Late Cretaceous quantities, slower than most other regions8–11. Delayed recovery of marine productivity closer to the crater implies an impact-related environmental control, like toxic metal poisoning12, on recovery times. Conversely, if no such geographic pattern exists, the best explanation for the observed heterogeneity is ecological, based on trophic interactions13, species incumbency and competitive exclusion by opportunists14, and “chance”8,15,16. Importantly, this question has bearing on the inherent predictability (or lack thereof) of future patterns of recovery in modern anthropogenically perturbed ecosystems. If there is a relationship between the distance from the impact and the recovery of marine productivity, we would expect recovery rates to be slowest in the crater itself. Here, we present the first record of foraminifera, calcareous nannoplankton, trace fossils, and elemental abundance data from the first ~200 kyr of the Paleocene within the Chicxulub Crater. We show that life reappeared in the basin just years after the impact and a thriving, high-productivity ecosystem was established within 30 kyr, faster than many sites across the globe. This is a clear indication that proximity to the impact did not delay recovery and thus there was no impact-related environmental control on recovery. Ecological processes likely controlled the recovery of productivity after the K-Pg mass extinction and are therefore likely to be significant in the response of the ocean ecosystem to other rapid extinction events.
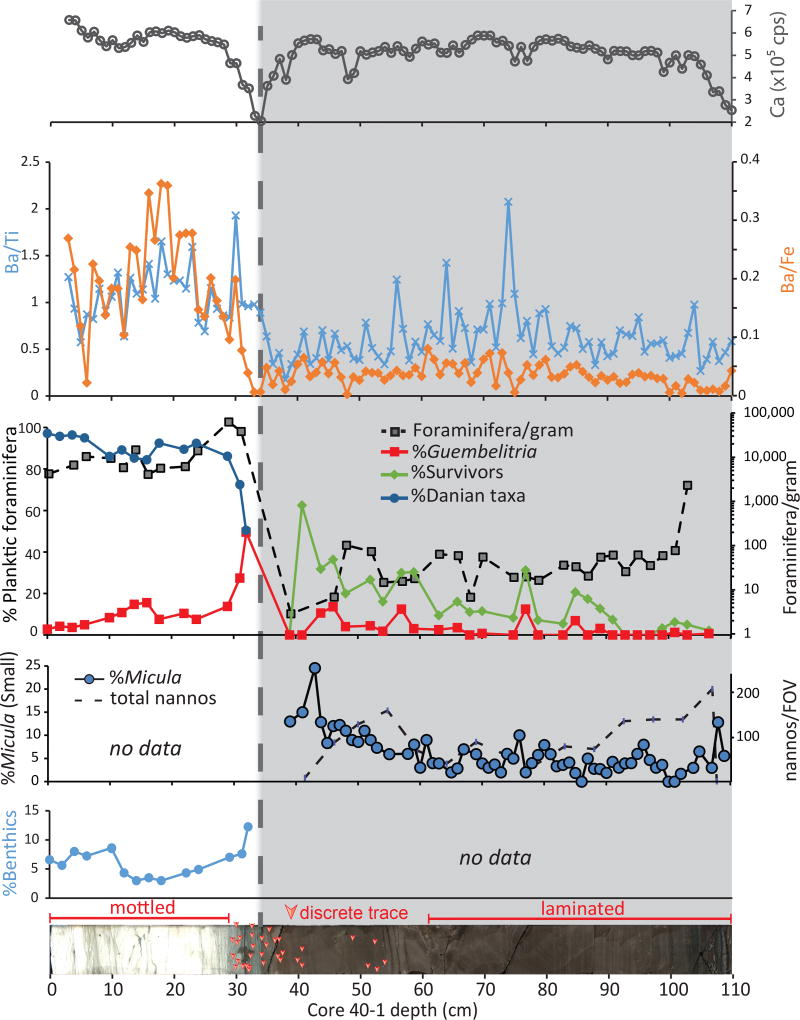
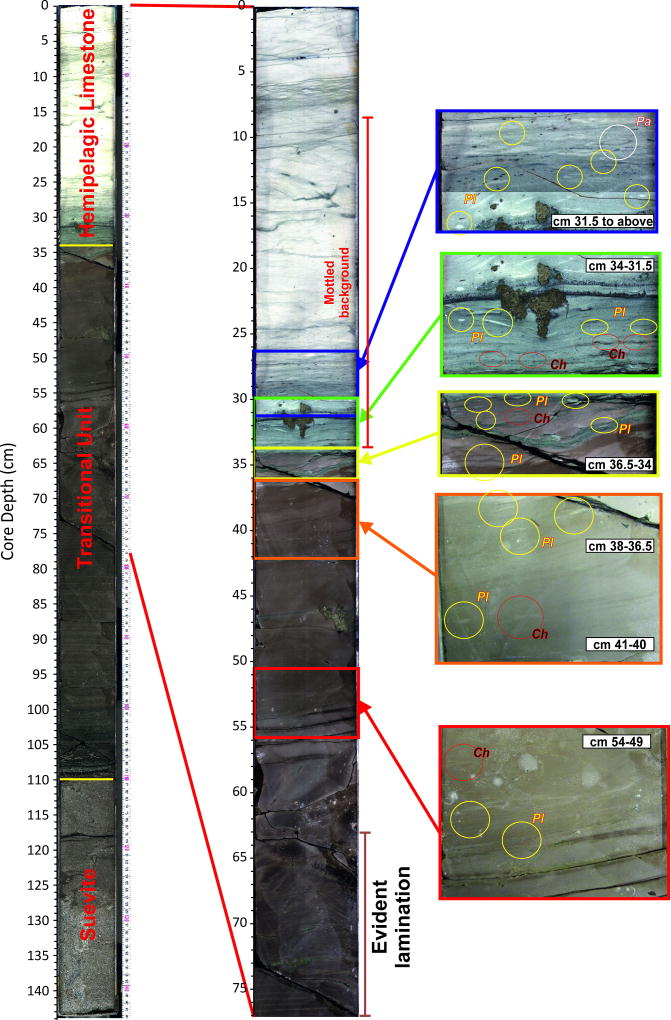
The recent joint Expedition 364 of the International Ocean Discovery Program and International Continental Drilling Program recovered the first record of the few hundred thousand years immediately after the impact within the Chicxulub Crater. Site M0077, drilled into the crater’s peak ring7 (Extended Data Fig. 1), sampled a ~130 m thick generally upward-fining suevite (i.e., melt-bearing impact breccia) overlying impact melt rocks and fractured granite17. The boundary between the suevite and overlying earliest Paleocene pelagic limestone is in Core 40-1 (Fig. 1), and is comprised of a 76 cm upward-fining, brown, fine-grained, micritic limestone that we term the transitional unit. The lower portion of the transitional unit is laminated below 54 cm core depth and contains no trace fossils (Fig. 1, Extended Data Fig. 2). The laminations are thin graded beds with sub-mm scale cross bedding that indicate bottom currents and are likely due to the movement of wave energy, including tsunami and/or seiches, in the days after the impact. The fine grain size (primarily clay to silt, with some sand-sized grains concentrated in the graded beds) suggests that much of the material in the transitional unit was deposited from resuspension and settling. The transitional unit is overlain by a white pelagic limestone. The lowermost sample taken in this limestone (34 cm) contains the planktic foraminifer Parvularugolobigerina eugubina, which marks the base of Zone Pα, as well as P. extensa, P. alabamensis, and Guembelitria cretacea. Because many other species that originate within Zone Pα first appear a few cm higher in the section (31–32 cm), we conclude that the base of the limestone lies very near the base of this zone, 30 kyr post-impact18.
Fig. 1. Paleoproductivity indicators in the earliest Paleocene at Site M0077.
The shaded area is the transitional unit and the dashed line represents the contact with the overlying pelagic limestone. Top to bottom: XRF-derived calcium abundance in counts per second (cps); Ba/Ti and Ba/Fe ratios; %abundances key planktic foraminiferal groups, including %Guembelitria, %survivors (i.e., Cretaceous species known to survive the impact), and % Danian taxa (i.e., species which evolved after the impact), as percentage of total foraminifera; foraminifera per gram of sediment, plotted on a log scale; %Micula smaller than 2µm (against total nannoplankton) and nannoplankton abundance (total occurrences per field of view – FOV); %benthic foraminifera (against total foraminifera); Core image of 364-M0077A-40R-1 0–110 cm Core 40R-1, 34 to 110 cm (616.58 to 617.33 meters below seafloor) with discrete trace fossils highlighted by arrows (see Extended Data Fig. 2 for larger version of this image).
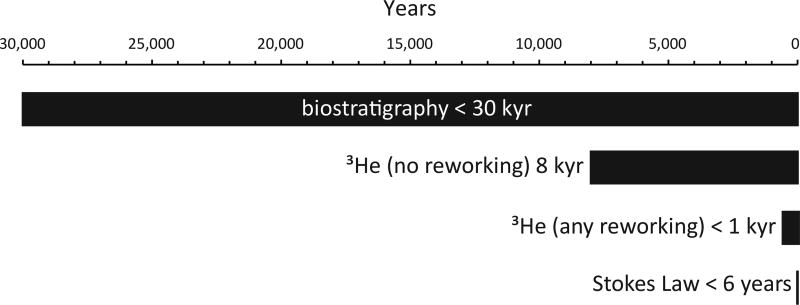
Biostratigraphy and basic assumptions about depositional and crater processes indicate that the transitional unit was deposited between several years and 30 kyr after impact (Fig. 2). To better constrain this, we utilize the abundance of extraterrestrial 3He to determine sediment accumulation rates (see Methods). This proxy provides a firm upper limit of 8 kyr for deposition, assuming none of the 3He is reworked. If even a small amount of 3He is reworked (very likely, given the prevalence of reworked microfossils and impact debris), then the transitional unit was deposited in a period of time below the resolution of the method, < ~1 kyr. With no sediment source other than settling of material suspended by the impact and subsequent tsunami and seiches, a more realistic estimate for the duration of this unit is based on Stoke’s law, which suggests ~6 years for the settling of a 2 µm grain of carbonate (an upper limit, as most grains are much larger; see SI for further discussion). The lower portion of the overlying limestone, which contains fossils which appear ~30 kyr post impact, appears conformable with the transitional unit and must therefore be condensed due to low pelagic sedimentation in the first few 10s of kyrs post impact.
Figure 2. Constraints on the age of the transitional unit.
Clear, discrete trace fossils, including Planolites and Chondrites, characterize the upper 20 cm of the transitional unit (above 54 cm) (Fig. 1, Extended Data Fig. 2), providing unequivocal evidence for benthic life in the crater within years of the impact. Flattening of the structures indicates that the traces were formed while the sediment was still soft, during or shortly after deposition of the transitional unit. Infilling of the burrows with brown, fine-grained micrite also suggests traces were syndepositional and not derived from mixing of the Danian limestone above the transitional unit. Trace fossils produced during deposition of the limestone, as indicated by light infilling material, are distinct and only occur in the uppermost few cm of the transitional unit (Extended Data Fig. 2).
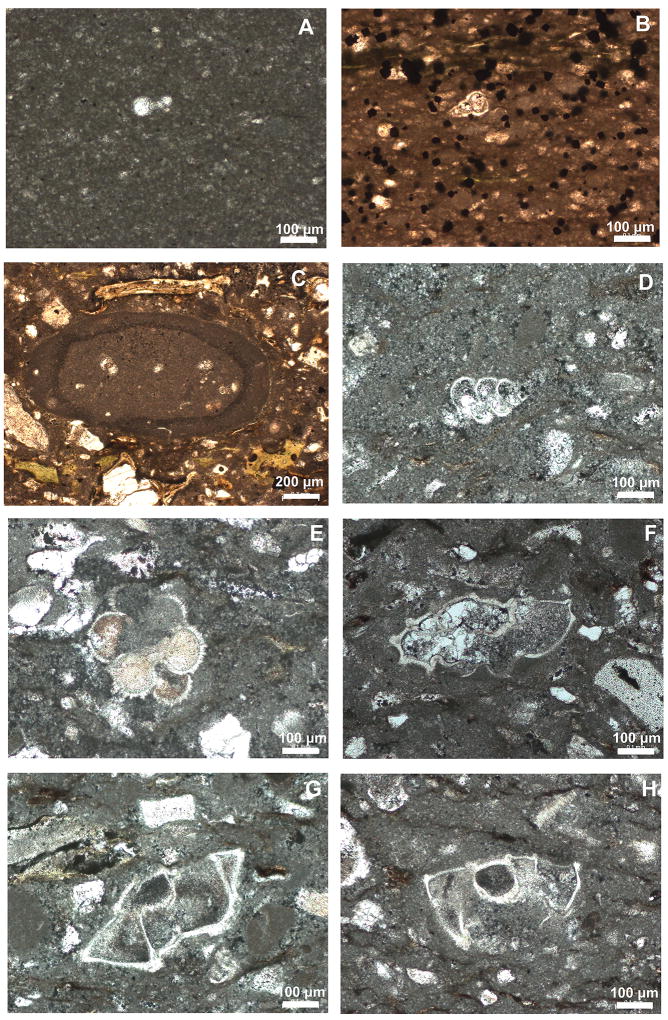
The transitional unit microfossils are dominated by clearly reworked Maastrichtian foraminifera and nannoplankton, known across the Gulf of Mexico and Caribbean as the K-Pg Boundary Cocktail19 (Extended Data Fig. 3, Table S1). Although overall foraminiferal abundance (plotted as foraminifera per gram of sedimentary rock; Fig. 1) is high at the base of the unit, species known to range across the boundary (“survivor species”) are rare in the lower transitional unit and become more common upsection even as total foraminifera decline (Fig. 1). Survivors, here defined as Guembelitria cretacea, Muricohedbergella monmouthensis, and M. holmdelensis20, dominate a depauperate assemblage in the upper 20 cm of the transitional unit, coinciding with the first appearance of trace fossils (Extended Data Figs. 4 and 5).
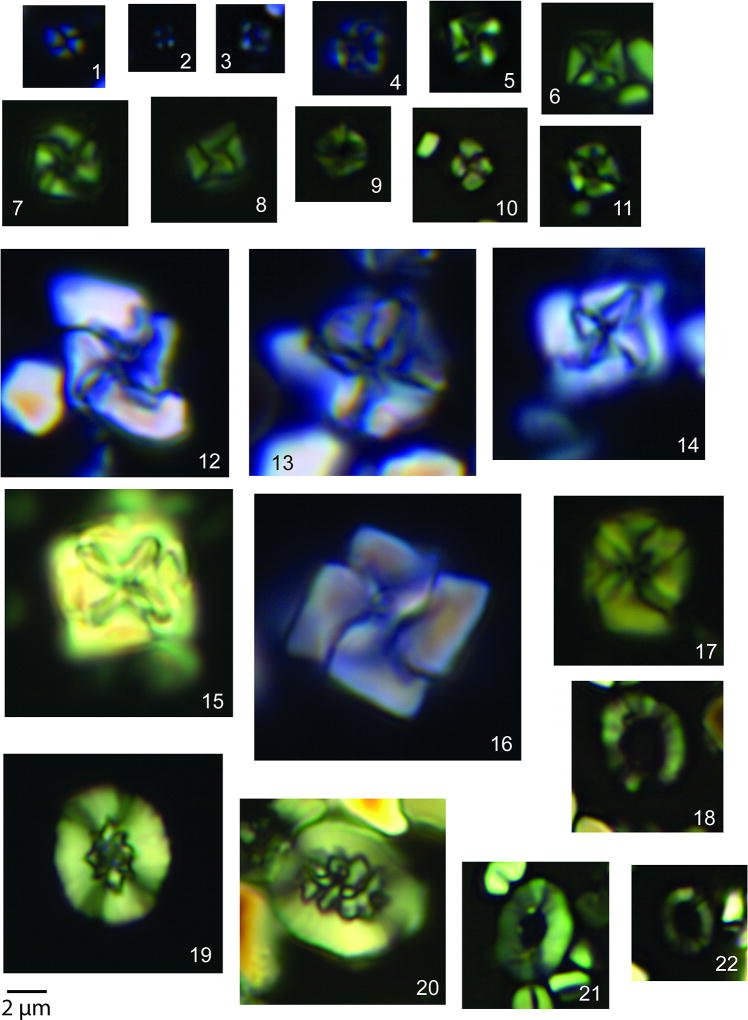
The nannofossil assemblage in the transitional unit contains reworked Cretaceous specimens, including a group of clearly overgrown species that became extinct near the Campanian-Maastrichtian boundary, such as Aspidolithus parcus and Eiffellithus eximius. The remainder of the Cretaceous species, which dominate the assemblage, range to the top of or beyond the latest Maastrichtian (Table S2). Unusually small (<2 µm) and delicate specimens of Micula are observed throughout the transitional unit and increase in abundance upsection (Fig. 1), along with small Retecapsa (Extended Data Fig. 6). Taxa common at other sites in the earliest Danian are also present, including disaster genera like Thoracosphaera and Braarudosphaera. Unlike the foraminifera, there are no clear stratigraphic trends in overall nannoplankton abundance (Fig. 1).
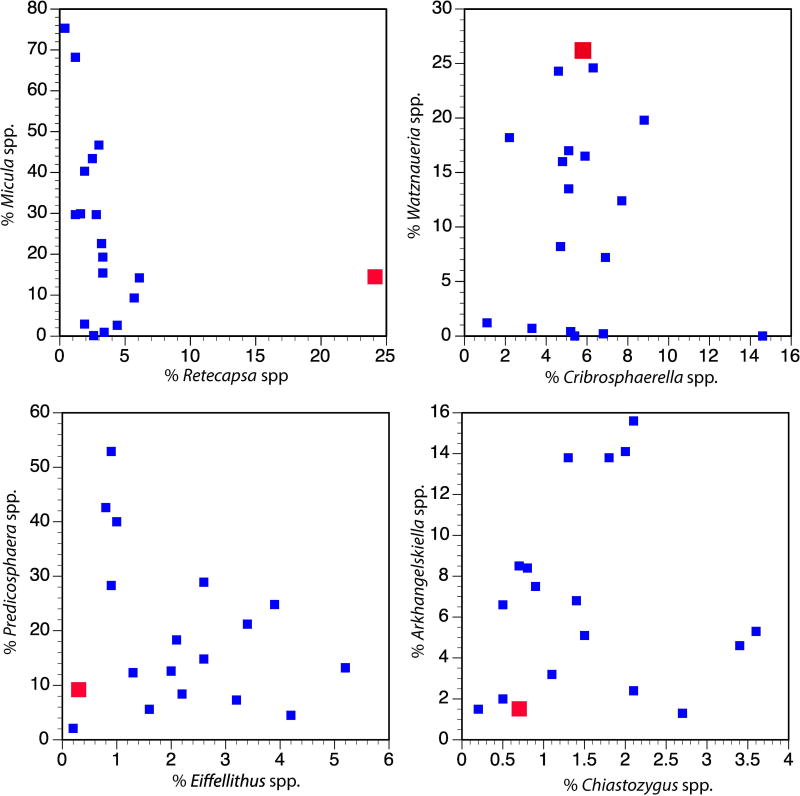
Because survivor species lived both before and after the K-Pg mass extinction, it is impossible to determine for certain if individual specimens in the transitional unit colonized the crater post-impact. However, the populations of foraminifera and nannoplankton are significantly different from those of the latest Cretaceous12 (i.e., the expected population if the whole assemblage was reworked), suggesting that these taxa were true survivors (Fig. 1, Extended Data Fig. 6). Guembelitria cretacea, a common component of the survivor assemblage in the upper transitional unit, was restricted to marginal marine waters during the Maastrichtian and would not have been present at the pre-impact site, which was >100 m deep21 and >500 km from shore22. The nannofossil assemblage in the transitional unit is significantly different from typical latest Maastrichtian assemblages, with some genera over-represented (Watznaueria and Retecapsa) and others under-represented (Eiffellithus, not including E. eximius, Arkhangelskiella, Chiastozygus, and Prediscosphaera) (Extended Data Fig. 6). Additionally, Micula, a robust taxon often used as a proxy for dissolution, is not as abundant as elsewhere, indicating that these unusual abundances are not due to poor or selective preservation (Extended Data Fig. 6).
This initial appearance of life is remarkably fast, especially because crater-specific factors do not seem to have had a negative impact on the local recovery of life. A vigorous, high-temperature hydrothermal system was established within the crater and may have persisted for millions of years after the impact23, especially across the peak ring where rocks exhumed from deep in the crust were extensively fractured7. Nevertheless, the appearance of burrowing organisms within years of the impact indicates that the hydrothermal system did not adversely affect seafloor life. Impact-generated hydrothermal systems are hypothesized to be potential habitats for early life on Earth24 and on other planets, particularly below the surface. However, for marine impact craters in open ocean communication, like Chicxulub (Extended Data Fig. 1), our data indicate that locally significant but still comparatively small volumes of hydrothermal fluids were overwhelmed by the 1.3×10⁴ km3 of well-mixed ocean water that filled the basin.
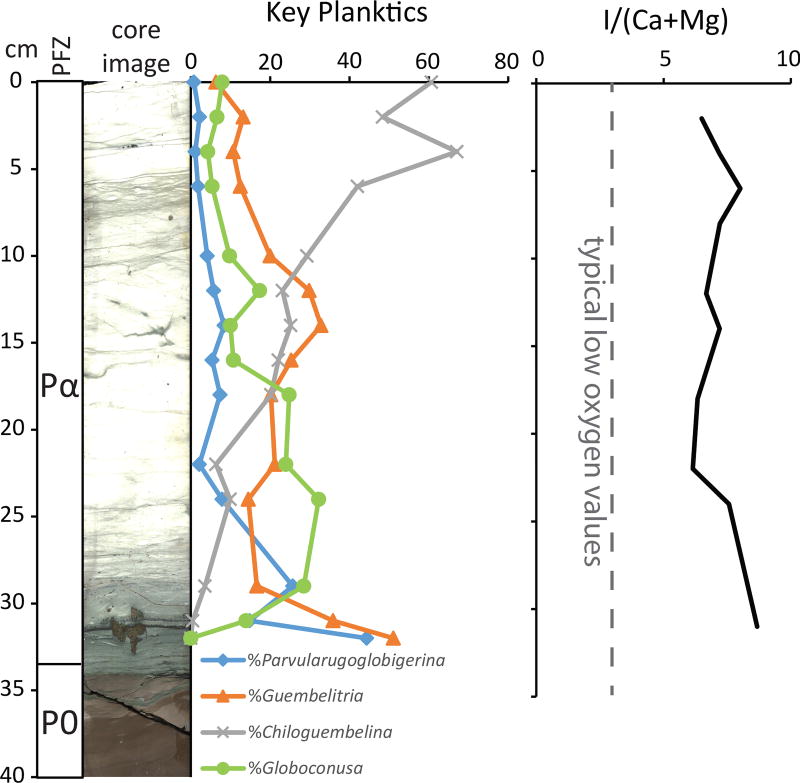
Likewise, the open connection with the Gulf of Mexico prevented the development of anoxia in the crater. Our analyses of iodine to calcium ratios suggest that local dissolved oxygen was high and stable in Zone Pα (Fig. 3). This is in contrast to the smaller (85-km wide) Eocene Chesapeake Bay impact crater in Virginia, USA, where anoxia due to restriction is attributed as the cause of delayed recovery of the benthic ecosystem on the crater floor25. This comparison suggests that the establishment of life within marine impact craters is controlled more by circulation (and thus crater geometry) than by the magnitude of the impact or global environmental effects.
Figure 3. Early Danian foraminifer abundances and I/(Ca+Mg) oxygenation proxy.
Left: Key Danian planktic foraminifera. Normal perforate planktics (Eoglobigerina, Globanomalina, Parasubbotina, and Praemurica) are rare throughout the study interval and not plotted here; all are plotted as % total planktic foraminifera. Right: I/(Ca+Mg) redox proxy, indicating well-oxygenated conditions in the Chicxulub crater through this interval.
The overlying pelagic limestone, which was deposited within Zone Pα (30–200 kyr post impact) contains abundant evidence of high productivity in a thriving ecosystem. The planktic foraminifer assemblage in Zone Pα is diverse and abundant (Fig. 3). Good preservation in the lowermost sample (34 cm) allowed the identification of over 60 species of benthic foraminifera, and benthics make up 12% of the assemblage at this level (Table S1). This percentage of benthics26 and the overall benthic assemblage27 are both typical of an upper to middle bathyal paleo water depth (~600–700 m)10,27. At this level, trace fossils increase in size, abundance, and diversity. The abundance and diversity of benthic organisms indicate that by ~30 kyr after the impact, seafloor conditions had returned to normal and sufficient organic matter flux existed to sustain a diverse, multilayer benthic community.
Conversely, the nannoplankton assemblage in the Danian limestone is dominated by Braarudosphaera and calcareous dinoflagellate cysts (e.g., Thoracosphaera), common disaster taxa in the early recovery interval. Large, foraminifer-sized calcispheres appear after ~100 kyr. Calcareous phytoplankton in the earliest Danian clearly represent a low-diversity, high-productivity bloom. Genera like Neobiscutum and Prinsius, common bloom taxa in the recovery interval at other Northern Hemisphere sites, do not become common until several meters higher in the section, >1 myr after the impact. Organic microfossils are completely absent from the study interval, likely due to poor preservation of organic material.
Geochemical paleoproductivity proxies, particularly Ba/Ti and Ba/Fe ratios, also indicate high productivity in the post-impact Danian limestone (Fig. 1). Ba/Ti ratios of ~1.0 at the base of the limestone (~30 kyr post impact) and ~2.0 above that (15 cm higher or ~100 kyr post impact) indicate relatively high and increasing productivity in the Chicxulub Basin in the earliest Danian.
The recovery of productivity in the crater is faster than at many sites, including those in the Gulf of Mexico, some of which took 300 kyr or more to recover to a similar extent8,11. Therefore, we find that proximity to the impact was not a control on recovery in marine ecosystems. The wide range of rates of recovery in the oceans show no relationship with geographic distance to the crater and so are best explained by natural ecological interactions between organisms within recovery ecosystems like incumbency and competitive exclusion8,14. These trends can be used to understand the rates of recovery after other major extinction events and, critically, predict the long-term recovery of modern ecosystems affected by pollution and climate change.
Methods
IODP-ICDP Expedition 364 drilled the peak ring of the Chicxulub crater in the spring of 2016 (Extended Data Fig. 1). Samples were taken at the Bremen IODP Core Repository during the Exp. 364 sampling party. Core depth in centimeters, with zero at the top of the section (616.24 m below sea floor), are reported throughout. Core material was indurated, and ~0.5 cm quarter-rounds were cut out with a rock saw. Due to the need to reserve core material for rare earth element geochemistry (which will be presented in a separate manuscript), the lowermost ~1.5 cm of the Danian limestone was not sampled. Individual samples were subdivided for foraminifer, calcareous nannoplankton, and discrete geochemical analyses.
Forty-three samples were examined for planktic and benthic foraminifera from Core 40 from 0–110 cm depth. Samples were weighed, crushed with a mortar and pestle, soaked overnight (or longer) in a 10% solution of hydrogen peroxide buffered with borax, and washed over a 43 µm sieve to ensure capture of small Danian taxa. The sieve was soaked in methylene blue dye between samples to identify contaminated specimens. Samples were then dried in an oven, split to obtain a manageable volume of material, and examined for foraminifera, calcispheres, and other sand-sized particles. In the Danian limestone, at least 300 specimens were counted to establish a statistically robust population28 and the rest of the residue was then examined for biostratigraphically significant taxa. Low abundances in the transitional unit precluded 300 specimen counts. However, we demonstrate that our values are sufficient to reject the null hypothesis (that the observed enrichments in survivor taxa are the result of random noise) with binomial confidence limits. This calculation traditionally provides the basis for the 300-specimen “rule:” counting 300 specimens provides statistical confidence at a 95% confidence interval that a species that makes up 1% of the population is represented in the count28. As we show, fewer specimens are sufficient to demonstrate the presence of a survivor population in our samples. Binomial confidence limits for samples with fewer than 300 specimens are reported in Table S1. Additionally, a single unusually well-preserved sample at the base of the post-impact limestone was examined for rare benthic species to determine the true diversity of benthics at the base of the unit (Table S1). Planktic foraminifer biozonation follows the P Zones of Berggren and Pearson29 as modified by Wade et al.18.
Ninety-seven samples were examined for nannofossils. Samples were disaggregated in water and smear slides were made from the supernatant. Slides were observed in a transmitted light microscope at 1600× until at least 100 specimens were observed (Table S2). Standard taxonomy was applied (http://www.mikrotax.org/Nannotax3/index.php?dir=Coccolithophores). The abundance of taxa at Site M0077 was compared to the global K-Pg nannoplankton compilation of Jiang et al.12.
Ichnological analysis was conducted from 0–110 cm. Ichnological observations were conducted on core material and a detailed and continuous analysis of digital images. To improve visibility of ichnological features, images were treated by a digital image methodology, based on modification of image adjustments as levels, brightness and vibrance30,31. Ichnotaxonomical classification of trace fossils was based on the overall shape and the presence of diagnostic criteria such as size and presence of branches32. Special attention was given to the infilling material of biogenic structures.
The measurement of I/(Ca+Mg) was carried out using a procedure similar to that described by Lu et al.33. For each sample and geostandard approximately 3–4 mg of carbonate powder was weighed out, dissolved in ~0.45M nitric solution, and then diluted using 0.1M nitric acid and 0.5% TMAH solution. All reported measurements are with samples that had a matrix of 50 ± 5 ppm Ca solution to ensure the most precise iodine measurement. Dissolved samples had TMAH solution added within an hour to avoid any possible loss of volatilized iodine33. Samples were measured using an Agilent inductively coupled plasma mass spectrometer 7500cs housed within the geochemistry group of the National High Magnetic Field Laboratory at Florida State University. A previously reported known sample, Key Largo (KL 1-1) was used to ensure reliable reproducibility. Our value of 5.51 µmol/mol was within error of the reported value of 5.55 µmol/mol (46). Hardisty et al.34 found that a generally low oxygen conditions correspond to ~2.6 µmol/mol for I/(Ca+Mg). Values are reported in Table S3.
Section 1 of Core 40 was scanned with an AVAATECH XRF Core Scanner II at MARUM, Bremen, Germany during the onshore phase of Expedition 364 (Fig. 1). The split core was covered with a 4 µm thick SPEX CertiPrep Ultralene foil to avoid contamination. XRF data was acquired with a Canberra X-PIPS silicon drift detector with 1550 eV resolution, a Canberra DAS 1000 digital spectrum analyzer, and an Oxford Instruments 50W XTF011 X-ray tube with rhodium target material. X-ray spectra were processed with WIN AXIL software from Canberra Erisys at a resolution of 12 mm and a step of 10 mm. Scans were conducted at different voltages to determine a range of element concentrations: 50 kV, with a beam current of 1 mA (Ba and Sr; average dead time of 5%), and 10 kV with a beam current of 0.15 mA (Al, Si, K, Ca, Ti, Fe, Mn, and S; average dead time of 11%). For each scan, sampling time was 20 seconds per spot.
3He is delivered to the Earth's surface by cosmic dust grains and over short time spans (~ Myr) can be used as a constant flux proxy35. Previous work has shown that the K-Pg impactor was not associated with enhanced 3He flux, and the mean extraterrestrial 3He flux from cosmic dust accretion at the end of the Cretaceous (106 ×10−15 cc STP/g/cm2/kyr) was used to estimate the duration over which the K-Pg boundary clay was deposited at Gubbio and El Kef36. We use a similar approach here to establish the sedimentation rate of the transitional unit, which we use to develop an age model.
Helium isotope ratios and concentrations were measured on ~1g aliquots of sediment following standard analytical procedures31. Extraterrestrial 3He concentrations were computed from measured He isotopic compositions using an isotopic deconvolution model36. Results are shown in Extended Data Table 1. 3He concentrations and 3He/4He ratios are generally low compared to typical marine sediments of similar age37,38. Nevertheless, with the exception of the lowest sample in the transitional unit (106.5 cm), the fraction of 3He attributable to an extraterrestrial source is high, ranging from ~0.70 to 0.96. The deepest sample has a similar 3He concentration to other samples in the transitional unit, but ~5 times more 4He. This elevated 4He likely arises from a higher concentration of terrigenous 4He-bearing material deposited rapidly after the impact.
We see no evidence for extraterrestrial He carried in impactor fragments, such as highly elevated and/or highly variable 3He and 3He/4He ratios. The absence of such a signal is consistent with either a) the absence of impactor fragments in the material analyzed, or b) loss of extraterrestrial 3He from the impactor via heating, vaporization or fusion. Note that, unlike many tracers of the impactor (such as Ir), deposition of fused or vaporized impactor will leave no trace in the sedimentary record because once He is lost into the atmosphere, it can no longer be retained in sediments.
Extended Data
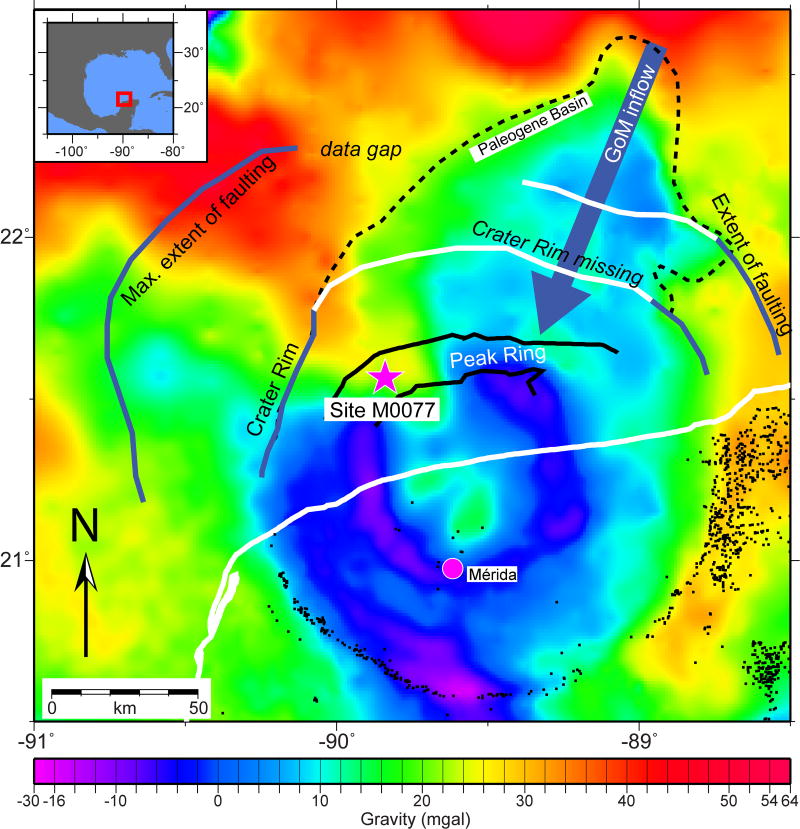
Extended Data Figure 1. Location of Site M0077 in the Chicxulub Crater as seen on gravity data.
Black dots are cenotes. Modified from Gulick et al.21.
Extended Data Figure 2. Trace fossils in Core 40 Section 1 of IODP Hole M0077A.
Discrete burrows in the upper transitional unit and the lower limestone are circled and labelled by the genus. Above the base of the limestone, trace fossils are abundant; representative examples are highlighted in the lower 10 cm of this interval. Ch: Chondrites; Pl: Planolites; Pa: Paleophycus.
Extended Data Figure 3. Reworked Cretaceous foraminifera in the transitional unit.
A Globigerinelloides sp., 364-M0077A-40R-1-W 55–56 cm; B Heterohelix sp. 364-M0077A-40R-1-W 104–105 cm; C clast of pelagic limestone containing older Cretaceous planktic foraminifera 364-M0077A-40R-1-W 106–110 cm; D Praegublerina pseudotessera 364-M0077A-40R-1-W 118–129cm ; E Racemiguembelina powelli 364-M0077A-40R-1-W 118–129 cm; F Globotruncana bulloides 364-M0077A-40R-1-W 110–118 cm; G Globotruncanita stuartiformis 364-M0077A-40R-1-W 118–129 cm; H Globotruncanita elevata 364-M0077A-40R-1-W 118–129 cm. Scale bars are all 100 µm.
Extended Data Figure 4. Scanning electron micrographs of planktic foraminifera from Core 40.
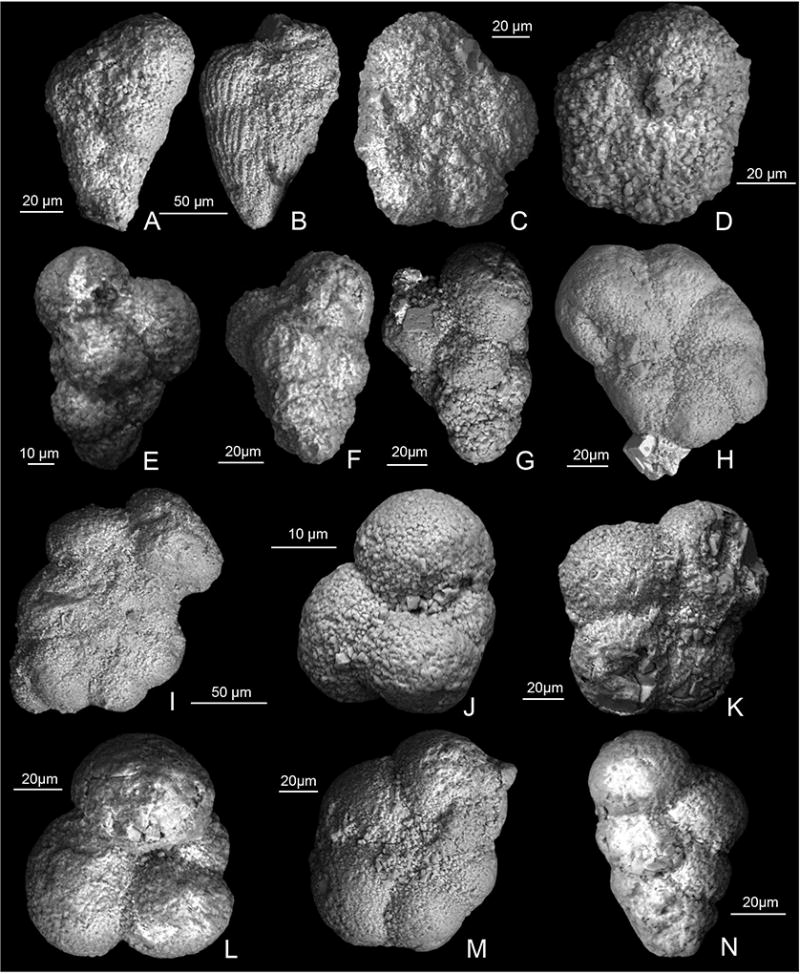
A–B, examples of common reworked Cretaceous biserials, 364-M0077A-40R-1 102–103 cm; C Muricohedbergella monmouthensis 364-M0077A-40R-1-W 102–103 cm; D Muricohedbergella holmdelensis 364-M0077A-40R-1-W 44–45 cm; E Guembelitria cretacea 364-M0077A-40R-1-W 44–45; F Guembelitria cretacea 364-M0077A-40R-1-W 29–30 cm; G Guembelitria cretacea 364-M0077A-40R-1-W 29–30 cm; H Parvularugoglobigerina eugubina 364-M0077A-40R-1-W 31–32 cm; I Parvularugoglobigerina eugubina 364-M0077A-40R-1-W 31–32 cm; J Globoconusa daubjergensis 364-M0077A-40R-1-W 31–32 cm; K Eoglobigerina eobulloides 364-M0077A-40R-1-W 29–30 cm; L Eoglobigerina edita 364-M0077A-40R-1-W 29–30 cm; M Praemurica taurica 364-M0077A-40R-1-W 10–11 cm; N Chiloguembelina morsei 364-M0077A-40R-1-W 10–11 cm.
Extended Data Figure 5. Small and regular sized nannofossils in the transitional unit.
All photographs from Core 364-M0077-40R-1-W. Plates 1–11, small Micula spp. 1. 55–56 cm; 2. 41–42 cm; 3. 95–96 cm; 4. 41–42 cm; 5. 90–91 cm; 6. 94–95 cm; 7. 91–92 cm; 8. 91–92 cm; 9. 45–46 cm; 10. 100–101 cm; 11. 81–82 cm. Plates12–17 Regular-sized Micula spp. 12. 44–45 cm; 13. 41–42 cm; 14. 51–52 cm; 15. 105–106 cm; 16. 97–98 cm; 17. 36–37 cm. Plates 19–20 Regular-sized Retecapsa spp. 19. 85–86 cm; 20. 100–101 cm. 18, 21, 22 Small Retecapsa spp. 21. 71–72 cm, 22. 100–101 cm, 18. 100–101 cm. Scale bar is 2 µm.
Extended Data Figure 6. Relative abundance of major Maastrichtian calcareous nannoplankton.
Small blue squares are Maastrichtian sites from the global compilation12; larger red squares are from the transitional unit at Site M0077. These data demonstrate the unusual abundance of Watznaueria and Retecapsa at our site.
Extended Data Table 1.
3He data.
| Sample | start cm |
stop cm |
3He pcc/g |
4He ncc/g |
Absolute 3He/4He |
Fraction 3He ET |
Maximum 3He -Based Model Age (kyr) |
|---|---|---|---|---|---|---|---|
| KT39 | 39 | 40 | 0.0068 | 13.6 | 5.04E-07 | 0.96 | 6.0 |
| KT48 | 48 | 49 | 0.0055 | 35.4 | 1.56E-07 | 0.87 | 4.9 |
| KT59 | 59 | 60 | 0.0064 | 23.1 | 2.78E-07 | 0.92 | 4.0 |
| KT68 | 68 | 69 | 0.0042 | 31.6 | 1.33E-07 | 0.84 | 2.9 |
| KT79 | 79 | 80 | 0.0036 | 18.3 | 1.99E-07 | 0.9 | 1.9 |
| KT89 | 89 | 90 | 0.0105 | 34.7 | 3.04E-07 | 0.93 | 0.9 |
| KT99 | 99 | 100 | 0.0045 | 64.3 | 6.99E-08 | 0.70 | 0.1 |
| KT106.5 | 107 | 108 | 0.0109 | 327 | 3.32E-08 | 0.37 | 0.0 |
Supplementary Material
Acknowledgments
This research used samples and data provided by IODP. Expedition 364 was jointly funded by the European Consortium for Ocean Research Drilling (ECORD) and ICDP, with contributions and logistical support from the Yucatán State Government and Universidad Nacional Autónoma de México (UNAM). We thank Tessa Cayton for assistance crushing and washing samples; Serena Dameron, Renata Moura de Mello, and Mark Leckie for helpful discussions on benthic foraminifer taxonomy; James Maner for assistance with the UT ESEM laboratory and Rowan Martindale for assistance with petrographic microscope imaging. We are particularly grateful for assistance of the staff of the IODP Core Repository in Bremen, Germany for their assistance taking these samples and running “shipboard” analyses. The authors acknowledge Post-Expedition Awards from the U.S. Science Support Program for CL and TB, NSF OCE 1737351, and NASA NNX16AJ60G. Funding for FR-T was provided by Project CGL2015-66835-P (Secretaría de Estado de I+D+I, Spain), and Scientific Excellence Unit UCE-2016-05 (Universidad de Granada).
Footnotes
Data Availability Statement: XRF data are published the IODP Proceedings volume for Expedition 364 (https://doi.org/10.14379/iodp.proc.364.2017). The authors declare that all other data supporting the findings of this study are available within the paper and its supplementary information files.
Supplementary Information is linked to the online version of the paper at www.nature.com/nature.
Author Contributions All authors participated in sampling and data collection offshore and/or onshore during IODP/ICDP Expedition 364. CML, TJB, FJR, HJ, and JS collected and analyzed microfossil data, MTW provided detailed sedimentology, JDO, PC, and KF collected trace element, XRF, and He isotope data, respectively. All authors contributed to writing/editing of the manuscript.
The authors declare no competing financial interests.
References
- 1.Jablonski D. Extinctions in the fossil record. In: Lawton JH, May RM, editors. Extinction Rates. New York: Oxford University Press; 1995. pp. 25–44. [Google Scholar]
- 2.Schulte P, et al. The Chicxulub asteroid impact and mass extinction at the Cretaceous-Paleogene Boundary. Science. 2010;327:1214–1218. doi: 10.1126/science.1177265. [DOI] [PubMed] [Google Scholar]
- 3.Alvarez LW, Alvarez W, Asaro F, Michel HV. Extraterrestrial cause for the Cretaceous/Tertiary extinction. Science. 1980;208:1095–1108. doi: 10.1126/science.208.4448.1095. [DOI] [PubMed] [Google Scholar]
- 4.Smit J, Hertogen J. An extraterrestrial event at the Cretaceous-Tertiary boundary. Nature. 1980;285:198–200. [Google Scholar]
- 5.Renne PR, et al. Time scales of critical events around the Cretaceous-Paleogene Boundary. Science. 2013;339:684–687. doi: 10.1126/science.1230492. [DOI] [PubMed] [Google Scholar]
- 6.Hildebrand AR, et al. Chicxulub Crater: A possible Cretaceous/Tertiary boundary impact crater in the Yucatán Peninsula, Mexico. Geology. 1991;19:867–871. [Google Scholar]
- 7.Morgan J, et al. The formation of peak rings in large impact craters. Science. 2016;354:878–882. doi: 10.1126/science.aah6561. [DOI] [PubMed] [Google Scholar]
- 8.Hull PM, Norris RD. Diverse patterns of ocean export productivity change across the Cretaceous-Paleogene boundary: New insights from biogenic barium. Paleoceanography. 2011;26:PA3205. [Google Scholar]
- 9.Alegret L, Thomas E. Cretaceous/Paleogene boundary bathyal paleo-environments in the central North Pacific (DSDP Site 465), the northwestern Atlantic (ODP Site 1049), the Gulf of Mexico, and the Tethys: The benthic foraminiferal record. Palaeogeography, Palaeoclimatology, Palaeoecology. 2005;224:53–82. [Google Scholar]
- 10.Alegret L, Molina E, Thomas E. Benthic foraminifera at the Cretaceous-Tertiary boundary around the Gulf of Mexico. Geology. 2001;29:891–894. [Google Scholar]
- 11.Alegret L, Arenillas I, Arz JA, Molina E. Foraminiferal event-stratigraphy across the Cretaceous/Paleogene boundary. Neues Jahrbuch für Geologie und Paläontologie – Abhandlungen. 2004;231:25–50. [Google Scholar]
- 12.Jiang S, Bralower TJ, Patzkowsky ME, Kump LR, Schueth JD. Geographic controls on nannoplankton extinction across the Cretaceous/Paleogene Boundary. Nature Geoscience. 2010;2010:280–285. [Google Scholar]
- 13.Solé RV, Montoya JS, Erwin DH. Recovery after mass extinction: evolutionary assembly in large-scale biosphere dynamics. Philosophical Transactions of the Royal Society of London. 2002;357:697–707. doi: 10.1098/rstb.2001.0987. [DOI] [PMC free article] [PubMed] [Google Scholar]
- 14.Schueth JD, Bralower TJ, Jiang S, Patzkowsky ME. The role of regional survivor incumbency in the evolutionary recovery of calcareous nannoplankton from the Cretaceous/Paleogene (K/Pg) mass extinction. Paleobiology. 2015;41:661–679. [Google Scholar]
- 15.Hull PM, Norris RD, Bralower TJ, Schueth JD. A role for chance in marine recovery from the end-Cretaceous extinction. Nature Geoscience. 2011;4:856–860. [Google Scholar]
- 16.Yedid G, Ofria CA, Lenski RE. Selective press extinctions, but not random pulse extinctions, cause delayed ecological recovery in communities of digital organisms. The American Naturalist. 2009;173:E1. doi: 10.1086/597228. [DOI] [PubMed] [Google Scholar]
- 17.Gulick SPS, et al. Expedition 364 Preliminary Report: Chicxulub: Drilling the K-Pg Impact Crater. International Ocean Discovery Program; 2017. [DOI] [Google Scholar]
- 18.Wade BS, Pearson PN, Berggren WA, Pälike H. Review and revision of Cenozoic tropical planktonic foraminiferal biostratigraphy and calibration to the geomagnetic polarity and astronomical time scale. Earth Science Reviews. 2011;104:111–142. [Google Scholar]
- 19.Bralower TJ, Paull CK, Leckie RM. The Cretaceous-Tertiary boundary cocktail: Chicxulub impact triggers margin collapse and extensive sediment gravity flows. Geology. 1998;26:331–334. [Google Scholar]
- 20.Olsson DK, Hemleben C, Berggren WA, Huber B. T, Atlas of Paleocene Planktonic Foraminifera. Vol. 85. Smithsonian Contributions to Paleobiology; 1999. [Google Scholar]
- 21.Gulick SPS, et al. Importance of pre-impact crustral structure for the asymmetry of the Chicxulub impact crater. Nature Geoscience. 2008;1:131–135. [Google Scholar]
- 22.Sohl N. Upper Cretaceous. Geology of North America, Volume J. Gulf of Mexico Basin. 1991:205–244. [Google Scholar]
- 23.Abramov O, Kring DA. Numerical modeling of impact-induced hydrothermal activity at the Chicxulub crater. Meteoric and Planetary Science. 2007;42:93–112. [Google Scholar]
- 24.Cockell CS. The origin and emergence of life under impact bombardment. Phil. Trans. R. Soc. B. 2006;361:1845–1856. doi: 10.1098/rstb.2006.1908. [DOI] [PMC free article] [PubMed] [Google Scholar]
- 25.Poag CW. Paleoenvironmental recovery from the Chesapeake Bay bolide impact: The benthic foraminiferal record. In: Gohn GS, Koeberl C, Miller KG, Reimold WU, editors. The ICDP-USGS Deep Drilling Project in the Chesapeake Bay Impact Structure: Results from the Eyreville Core Holes, The Geological Society of America Special Paper. Vol. 458. 2009. pp. 747–773. [Google Scholar]
- 26.Leckie RM, Olson HC. Foraminifera as proxies for sea level change on siliciclastic margins. SEPM Special Publication. 2003;75:5–19. [Google Scholar]
- 27.Alegret L, Thomas E. Upper Cretaceous and lower Paleocene benthic foraminifera from northeastern Mexico. Micropaleontology. 2001;47:269–316. [Google Scholar]
- 28.Buzas MA. Another look at confidence limits for species proportions. Journal of Paleontology. 1990;64:842–843. [Google Scholar]
- 29.Berggren WA, Pearson PN. A revised tropical and subtropical Paleogene planktonic foraminiferal zonation. Journal of Foraminiferal Research. 2005;35:279–298. [Google Scholar]
- 30.Dorador J, Rodríguez-Tovar F. Digital image treatment applied to ichnological analysis of marine core sediments. Facies. 2014;60:39–44. [Google Scholar]
- 31.Dorador J, Rodríguez-Tovar FJ. Stratigraphic variation in ichnofabrics at the “Shackleton Site” (IODP Site U1385) on the Iberian Margin: Paleoenvironmental implications. Marine Geology. 2016;377:118–126. [Google Scholar]
- 32.Knaust D. Atlas of Trace Fossils in Well Core: Appearance, Taxonomy and Interpretation. Springer; 2017. [Google Scholar]
- 33.Lu Z, Jenkyns HC, Rickaby REM. Iodine to calcium ratios in marine carbonate as a paleo-redox proxy during oceanic anoxic events. Geology. 2010;38:1107–1110. doi: 10.1130/g31145.1. [DOI] [Google Scholar]
- 34.Hardisty DS, et al. Perspectives on Proterozoic surface ocean redox from iodine contents in ancient and recent carbonate. Earth and Planetary Science Letters. 2017;463:159–170. doi: 10.1016/j.epsl.2017.01.032. [DOI] [Google Scholar]
- 35.Farley KA, Eltgroth SF. An alternative age model for the Paleocene-Eocene thermal maximum using extraterrestrial 3He. Earth and Planetary Science Letters. 2003;208:135–148. [Google Scholar]
- 36.Patterson DB, Farley KA. Extraterrestrial 3He in seafloor sediments: Evidence for correlated 100 kyr periodicity in the accretion rate of interplanetary dust, orbital parameters, and Quaternary climate. Geochimica et Cosmochimica Acta. 1998;62:3669–3682. [Google Scholar]
- 37.Mukhopadhyay S, Farley KA, Montanari A. a 35 Myr record of helium in pelagic limestones from Italy: Implications for interplanetary dust accretion from the early Maastrichtian to the middle Eocene. Geochimica et Cosmochimica Acta. 2001a;65:653–669. [Google Scholar]
- 38.Mukhopadhyay S, Farley KA, Montanari A. A short duration of the Cretaceous-Tertiary boundary event: Evidence from extraterrestrial Helium-3. Science. 2001b;291:1952–1955. doi: 10.1126/science.291.5510.1952. [DOI] [PubMed] [Google Scholar]
Associated Data
This section collects any data citations, data availability statements, or supplementary materials included in this article.


