Using SEER‐Medicare data, this article demonstrates that considerable differences exist in expenditures across phases of care and varying patient characteristics. These findings can help to provide a better understanding of the drivers of payment variation across patient and tumor characteristics to inform efforts to decrease costs and increase quality of cancer care.
Keywords: Cancer, Costs, Disease continuum
Abstract
Purpose.
The aim of this study was to estimate Medicare payments for cancer care during the initial, continuing, and end‐of‐life phases of care for 10 malignancies and to examine variation in expenditures according to patient characteristics and cancer severity.
Materials and Methods.
We used linked Surveillance, Epidemiology and End Results‐Medicare data to identify patients aged 66–99 years who were diagnosed with one of the following 10 cancers: prostate, bladder, esophageal, pancreatic, lung, liver, kidney, colorectal, breast, or ovarian, from 2007 through 2012. We attributed payments for each patient to a phase of care (i.e., initial, continuing, or end of life), based on time from diagnosis until death or end of study interval. We summed payments for all claims attributable to the primary cancer diagnosis and analyzed the overall and phase‐based costs and then by differing demographics, cancer stage, geographic region, and year of diagnosis.
Results.
We identified 428,300 patients diagnosed with one of the 10 malignancies. Annual payments were generally highest during the initial phase. Mean expenditures across cancers were $14,381 during the initial phase, $2,471 for continuing, and $13,458 at end of life. Payments decreased with increasing age. Black patients had higher payments for four of five cancers with statistically significant differences. Stage III cancers posed the greatest annual cost burden for four cancer types. Overall payments were stable across geographic region and year.
Conclusion.
Considerable differences exist in expenditures across phases of cancer care. By understanding the drivers of such payment variations across patient and tumor characteristics, we can inform efforts to decrease payments and increase quality, thereby reducing the burden of cancer care.
Implications for Practice.
Considerable differences exist in expenditures across phases of cancer care. There are further differences by varying patient characteristics. Understanding the drivers of such payment variations across patient and tumor characteristics can inform efforts to decrease costs and increase quality, thereby reducing the burden of cancer care.
Introduction
As a leading cause of morbidity and mortality, a cancer diagnosis creates a human and financial impact. In the U.S., total spending for cancer exceeds $125 billion annually [1]. Despite declining cancer incidence, national expenditures for cancer care over the continuum are projected to increase further through 2020 [2]. This is despite current policy efforts, some initiated by the passage of the Affordable Care Act (ACA) in 2010, aimed at decreasing aggregate health care expenditures.
Underlying these aggregate trends are the costs of cancer care over the continuum from diagnosis through treatment and survivorship or end of life. In an era of increasing focus on enhancing value not only through improved quality, but also through decreasing payments, understanding current expenditures across phases of cancer care, and how they vary according to patient characteristics, is critical for both improving patient care and guiding health care policy. These data would provide unique insights into health care utilization and potential practice pattern variations and how these practices have changed over time. Identifying differences in payments over various patient demographics generates hypotheses that can be further evaluated and used to improve health care quality and decrease costs. In addition, it is critical to evaluate these differences prior to the initiation of alternative payment models in oncology (e.g., the Oncology Care Model from the Centers for Medicare and Medicaid Services [CMS]), where an improved understanding of utilization and payments is critical both in terms of successfully constructing the policy and for physicians considering engaging in it. Although the costs of cancer over the disease continuum have been previously estimated and future costs of cancer projected [2], [3], our analyses incorporate estimates around varying patient characteristics and include data for years subsequent to passage of the ACA.
In this context, we used linked Surveillance, Epidemiology and End Results (SEER)‐Medicare data to estimate payments made by the Medicare program for cancer care over the disease continuum (i.e., initial, continuing, and end‐of‐life phase) for 10 different cancers. We further examined overall and phase‐based payments according to patient demographics, cancer stage, geographic region, and year of diagnosis.
Materials and Methods
Data
We utilized data from SEER registries linked with Medicare claims from July 2007 through 2012. SEER‐Medicare is a patient‐level dataset that links Medicare claims with information about clinical characteristics, patient demographics, and outcomes from the SEER registries. Claims from this dataset are divided into five files: Medicare Provider Analysis and Review (MEDPAR; readmissions, index, skilled nursing facility [SNF]), Carrier (Professional), Outpatient, Home Health, and Hospice payment files. We used all five files for our analyses.
Patient Selection
Our study cohort included patients aged 66–99 years who were diagnosed with one of 10 cancers (prostate, bladder, esophageal, pancreatic, lung, liver, kidney, colorectal, breast, or ovarian) between 2006 and 2012. We initially identified these patients in SEER's Patient Entitlement and Diagnosis Summary File (PEDSF) using the International Classification of Diseases for Oncology, 3rd Edition (ICD‐O‐3) cancer site recode for the cancer of interest. We then confirmed the diagnosis by only including patients with the relevant ICD‐O‐3 histology codes for each cancer. We excluded cases in which the diagnosis was noted exclusively by autopsy or on the death certificate. We further excluded patients without continuous Medicare Parts A and B enrollment from 12 months prior to diagnosis until end of study interval or death and patients who participated in Medicare Health Maintenance Organizations.
Attribution of Patients to Phases of Care
Cancer care over its continuum has been described as occurring in three phases: the initial phase—the first 12 months after diagnosis; the continuing phase—the period between the initial and end‐of‐life phases; and the end‐of‐life phase—the last 12 months of life. Using these definitions, each patient was attributed to at least one phase of care, creating a patient‐phase dyad (i.e., individual patient in one phase of care). For patients who died during the study interval, the end‐of‐life phase was assigned first, then the initial phase, and last, the continuing phase. For patients who were diagnosed during the study interval and alive at the conclusion of the study interval, the first 12 months after diagnosis were assigned to the initial phase and the subsequent months to the continuing care phase. These attribution methods are consistent with other evaluations [2], [4]. Supplemental online Figure 1 provides an illustration of the patient attribution methods. Payments were evaluated for each patient‐phase dyad distinctly from the other phases with the exception of the overall estimates, where only patients attributed to all three phases were included in our analyses.
Estimating Standardized Costs of Cancer Care
For each patient‐phase of care dyad, we aggregated all standard payments for claims with a primary diagnosis code for the corresponding cancer for each Medicare data file (MEDPAR, Carrier Claims, outpatient, home health, and hospice). These methods are consistent with those previously published from our group [4]. We estimated the average payment per beneficiary in each data file and then for each beneficiary across all files. To account for differences in Medicare reimbursement based on geography, teaching status, and disproportionate share payments, we price‐standardized all costs using methods previously described by our research team [5]. These methods were adapted from the Dartmouth Institute for Health Policy and Clinical Practice and the Medicare Payment Advisory Commission.
Patient Characteristics, Tumor Stage, and Hospital Characteristics
We determined patient demographic and cancer characteristics, including gender, age, race, year of diagnosis, cancer stage, and histologic grade, using the SEER (PEDSF) file. Age was defined as the diagnosis date minus the birth date. It was then made a categorical variable. We limited race to white, black, and other. Charlson comorbidities were identified using established methods. We used the American Hospital Association Annual Survey data to determine hospital geographic region, which was categorized according to census regions: Northeast, Midwest, South, and West.
Statistical Analyses
To determine payments and whether the costs of cancer varied by patient demographics, geographic region, cancer stage, and year of diagnosis, we fit phase‐specific generalized estimating equation models with the gamma distribution and log link for each cancer type. We fit this model to better account the non‐normal distribution of cost data and to adjust for hospital‐level effects (i.e., differing numbers of patients receiving care at different hospitals). Finally, for each cancer type, we fit multivariable models to estimate the association between individual variables and spending across phases of care. The models included patient (gender, age, race, number of Charlson comorbidities), cancer (stage, year of diagnosis), and hospital (geographic region) characteristics as well as phase of cancer care.
All analyses were performed using SAS 9.4 (SAS Institute, Cary, NC) and at the 5% significance level. The University of Michigan's institutional review board deemed this study exempt from review.
Results
We identified 428,300 patients who were diagnosed with one of 10 cancers from 2006 through 2011. The distribution of patients by site of primary tumor was as follows: 23% lung, 22% prostate, 18% breast, 15% colon, 9% bladder, 5% pancreatic, 4% kidney, and 2% each for esophageal, liver, and ovarian.
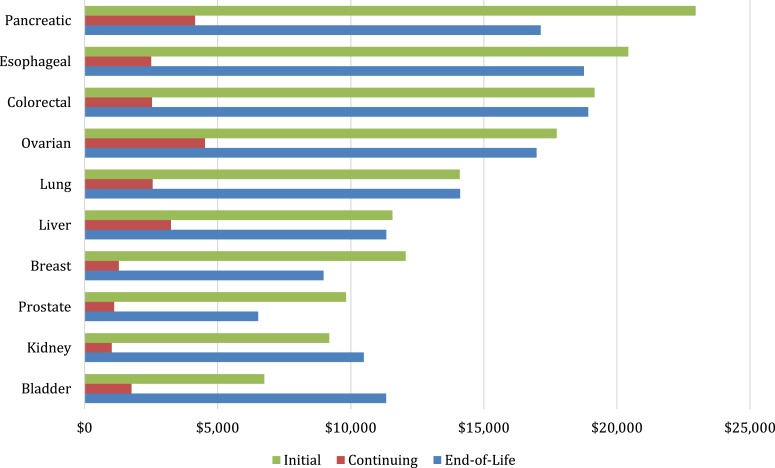
Figure 1 presents costs of cancer care by phase for each cancer type. For almost all cancer types, average annual costs are highest during the initial and end‐of‐life phases. In terms of phase‐specific expenditures, pancreatic, esophageal, and colorectal cancers had the highest costs for the initial phase at $22,964, $20,433, and $19,161, respectively; ovarian, pancreatic, and liver cancers were highest for the continuing phase, with estimated costs of $4,522, $4,154, and $3,250, respectively; and colorectal, esophageal, and pancreatic cancers were the highest at end of life, with estimated costs of $18,929, $18,760, and $17,141 (Fig. 1).
Figure 1.
Average annual payments for cancer care.
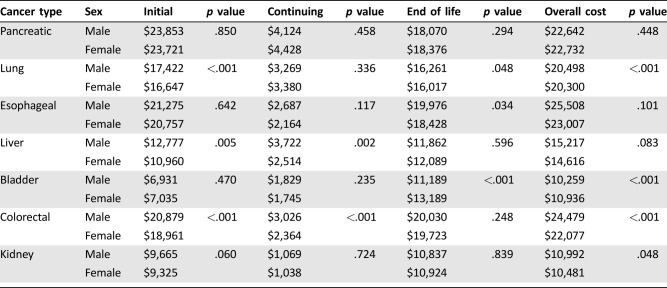
Overall, males had statistically significant higher expenditures for three of seven cancer types (lung, bladder, and colorectal). Although not statistically significant, esophageal had the greatest absolute difference by gender ($2,501, p = .101). Payments for males with colorectal and bladder cancer were, on average, $2,402 (p ≤ .001) and $677 (p < .001), respectively, more than for females. When evaluating costs by cancer phase, males had statistically significant higher costs of care for three of seven cancers in the initial phase (lung, liver, colorectal), two in the continuing phase (liver, colorectal), and two at the end of life (lung, bladder; Table 1).
Table 1. Annual payments for cancer care, by gender.
Costs of cancer care decrease with patient age both overall and for individual phases of care (supplemental online Fig. 2). Across all phases and cancers, costs for patients ≥80 years of age were 18% lower than for patients between the ages of 65–79. For three cancer sites (pancreatic, esophageal, and ovarian) spending differentials exceeded $10,000 from the youngest to oldest age category. One exception was bladder cancer, where the price differential between youngest and oldest was only $421.
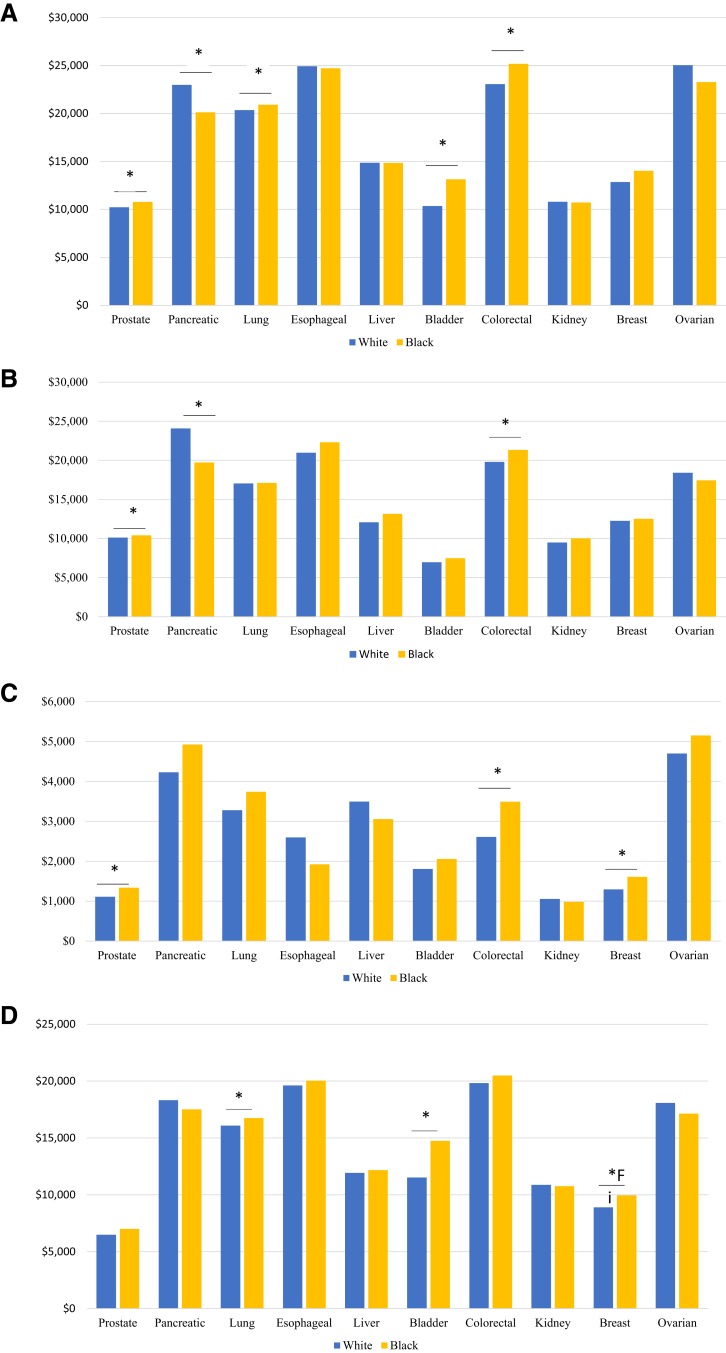
Figure 2 presents estimated expenditures by race. Black patients had higher overall expenditures for four of the five cancers (prostate, lung, bladder, and colorectal) in which we identified statistically significant differences by race. However, the largest differential occurred in pancreatic cancer, where average annual expenditures were $24,070 in white patients compared with $19,729 in black patients (p = .008). Black patients incurred significantly higher expenditures for three cancer types in the initial phase (prostate, pancreatic, breast), three in the continuing (prostate, colorectal, breast), and three at the end of life (lung, bladder, breast).
Figure 2.
Annual payments for cancer care, by race, for overall (A), initial (B), continuing (C), and end of life (D). *, p < .05.
As illustrated in supplemental online Figure 3, overall spending was similar across geographic regions. Although differences were modest, patients treated in the Northeast had the highest expenditures for 4 of 10 cancers. Differences between regions were smallest for patients with bladder and kidney cancer, with spending differentials of less than $450 between highest‐ and lowest‐cost regions.
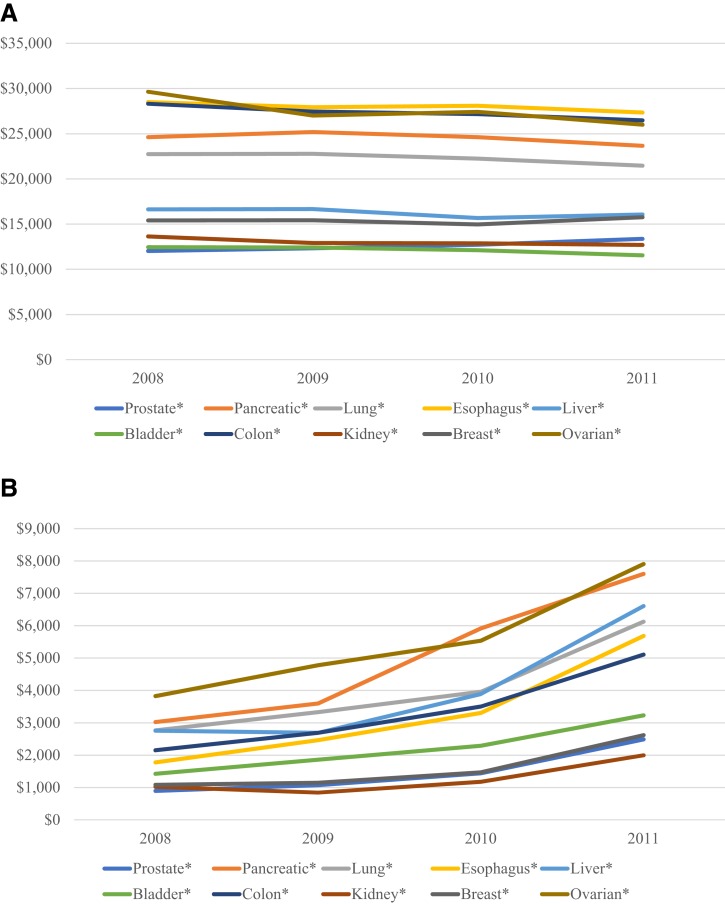
Average annual payments varied by cancer stage at diagnosis. Overall, annual costs were highest for patients presenting with stage II tumors for three cancers (pancreatic, lung, and liver), stage III tumors for four cancers (esophageal, bladder, breast, and ovarian), and stage IV tumors for three cancers (prostate, colorectal, and kidney; supplemental online Table 1). Overall costs of cancer care remained stable from 2008 to 2011 (Fig. 3), although phase‐specific payments increased for continuing care during this same period. As an illustration, treatment in the continuing phase for pancreatic cancer diagnosed in 2011 had $4,580 higher costs than that diagnosed in 2008.
Figure 3.
Annual payments for cancer care, by year of diagnosis, for overall (A) and continuing (B) phase of care. *, p < .05.
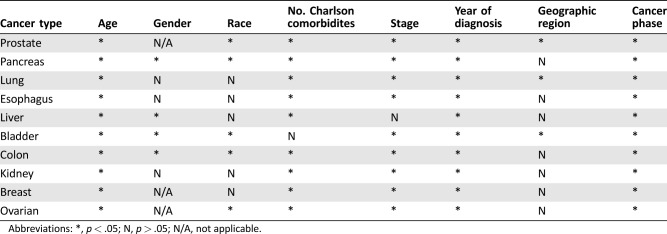
The variables independently associated with payments for cancer care, by cancer type, are presented in Table 2. Age, number of Charlson comorbidities, cancer stage, year of diagnosis, and cancer phase were fairly consistently associated with payments, whereas geographic region had little association.
Table 2. Variables independently associated with payments for cancer care, by cancer type.
Abbreviations: *, p < .05; N, p > .05; N/A, not applicable.
Discussion
In this study, we provide estimates of the costs of cancer across the care continuum for Medicare beneficiaries with 10 cancer types. We further classify these costs by care phase (i.e., initial, continuing, and end of life), patient demographics, and tumor characteristics. Considerable differences in payments exist across cancer type and discrete phases of care delivery. Expenditures tend to be highest in the initial phase, followed closely by payments during the end of life (i.e., last 12 months). In the initial phase, payments are highest for patients with the more aggressive tumors included in this analysis, such as esophageal and pancreatic cancer. In terms of patient characteristics, annual payments decrease with increasing age, vary by race for several cancers, but are largely stable for patients treated in different geographic regions. Overall payments tend to be the greatest when patients are diagnosed with stage II disease. Finally, aggregate expenditures remain fairly stable during the 4‐year study period.
Collectively, our findings are consistent with previous literature estimating costs of care over the cancer continuum [2], [3]. Our estimates are similar to previous analyses that only include payments for claims with the cancer of interest as the primary diagnosis, a method that is known to yield more conservative estimates for health care expenditure [4]. In contrast, our figures are lower than prior investigations that used noncancer controls to calculate costs. Our more modest estimates capture payments more specific to the cancer diagnosis and are thus perhaps more actionable on the part of the provider directly caring for the cancer patient. Our analyses further extend this literature by using more recent data and evaluate differences in costs by patient characteristics and cancer stage.
There are several potential reasons for the observed differences in expenditures by patient characteristics. First, the differing costs across gender, age, and race likely result from differences in health care utilization and patterns of care. For instance, prior studies have shown that treatment factors, including the use of chemo‐ and radiation therapy, play a significant role in differences in cancer expenditures [6], [7]. Chemotherapy is underutilized in women, black patients, and the elderly [8], [9], [10], perhaps contributing to the lower expenditures for these populations identified in this analysis. Additionally, women are less likely to undergo surgery at the time of diagnosis (i.e., initial phase) [11], [12], potentially further contributing to gender differences in initial phase expenditures. Likewise, older cancer patients may receive less aggressive care [13], possibly aimed at palliation rather than treatment, thus decreasing costs across all phases. Even older patients who are admitted to the hospital with advanced cancer have lower expenditures than their younger counterparts [14].
In contrast to the lower expenditures identified for women and patients older than 80 years of age, we observed higher costs for black patients across many cancer types and phases. The reasons for this finding are unclear. Although not evaluated specifically herein, one possibility is differences in access to care. Namely, prior research has determined that black patients with cancer often have less access to routine cancer care (including diagnostic tests and therapeutic interventions), with resultant increases in intensive care unit stays and inpatient hospital admissions at the end of life [15], [16], [17], [18].
Finally, the observed temporal stability in aggregate payments for Medicare patients highlights the potential impact (although admittedly early) of the Affordable Care Act and its emphasis on value‐based care and decreasing health care costs [2]. This finding among Medicare beneficiaries is, in fact, consistent with other work indicating that, although total expenditures for cancer care in the U.S. have increased, the share of costs paid by Medicare has decreased relative to patients with private insurance and Medicaid [19]. That being said, although the overall costs remained stable, payments in the continuing phase increased during the study interval. This finding may reflect, among other factors, the growing prevalence of more expensive chronic systemic therapies that allow patients to have longer survival in the continuing phase.
Our study has several limitations. First, we estimated costs of cancer care only for the Medicare population. As a result, our findings may not generalize to younger patients with cancer. Nonetheless, estimates from the Medicare program are very policy relevant given the burden of cancer in this population, including an incidence rate that is 10× higher, and a death rate from cancer that is 16× greater, than for patients <65 years [20]. Second, we do not include claims from Medicare Part D, including those for oral chemotherapy regimens. Moreover, our analyses focus on years prior to the introduction of some of the more expensive immunotherapy agents. The net effect of these concerns is that we will underestimate costs for certain cancers (e.g., kidney cancer) where the prevalence of such therapies increased rapidly during the study interval. In addition, there has been an increased emphasis on early palliative care and less use of chemotherapy at the end of life in the past 5 years, which our data would not capture. However, our data does include an important period of time spanning the implementation of the ACA, so the trends reported herein may foreshadow those for more recent years of the Medicare program. Third, we only include costs from claims associated with a primary diagnosis code of the diagnosed cancer. Although this approach may underestimate the true overall costs of cancer care, it is consistent with prior work and ensures substantial specificity for cancer‐related expenditures [4]. Furthermore, although using noncancer controls to evaluate payments may capture complications not otherwise included with a primary cancer diagnosis code, it is difficult to determine if these complications are directly related to the cancer diagnosis or rather reflect managing a cancer patient's comorbid conditions, so we decided to take the more conservative approach [3]. In addition, our analyses use actual, not projected, payments made to Medicare, which is more applicable to Medicare policy. Fourth, we only include data from the geographic regions included in the SEER program; these regions differ from the national population in terms of the proportion of white persons, cancer mortality rates, measures of socioeconomic status, and the availability of specialty health care services. Nonetheless, the ability to analyze data for most Medicare beneficiaries in these regions across 10 cancer types ensures that these findings are relevant for ongoing evaluations of cancer care delivery and policy in the U.S.
These limitations notwithstanding, our findings have important implications for both payers and policymakers. For payers, although some organizations are currently testing alternative payment models in oncology, many object to these out of concern that underlying disease and patient characteristics cannot be appropriately captured [21]. This work demonstrates the breadth of additional research that is required before oncology care payment bundles are initiated, specifically with regard to differences in costs by age, gender, race, and stage. For policymakers, the variation in costs across patient demographics indicates that important differences exist in how care is provided to and/or accessed by varying patient populations. Policy changes to address these disparities could potentially lead to improved patient care and cost savings across cancer types.
Conclusion
Moving forward, additional research needs to be performed on variations in treatment patterns, guideline‐concordant care, and access across gender, age, race, and stage. A critical component to these analyses is to evaluate the component payments of the overall costs, with particular attention paid to areas of over‐ and under‐spending. Some interesting questions to consider include the following: (a) How has the use of oral chemotherapy changed over time? (b) Are the lower expenditures with advanced age and for women secondary to underutilization of life‐extending services and/or care that is discordant with current guidelines? (c) Are the higher expenditures in black patients secondary to poor access, resulting in lower chemotherapy use, but also increased utilization of more acute hospital‐based services?
It will also be critical to evaluate what drives expenditure differentials prior to implementation of bundled services and to continue to assess these differences for ongoing value‐based purchasing efforts. For example, the Oncology Care Model, a bundled payment model introduced by CMS to improve care coordination and guideline‐concordant care for patients undergoing chemotherapy [22], has already been adjusted to define different target prices for high‐ and low‐risk bladder and prostate cancer.
Next, evaluating the effects of the Oncology Care Model across patient demographics and tumor characteristics will be critical for understanding how payer‐incentivized reimbursement models can impact quality and costs. In addition, there has been an increased emphasis on palliative care and reduced chemotherapy utilization at the end of life. Recognizing that cancer care at the end of life is personal, it will be essential to seek clarity on what components of care at the end of life may be reduced with no patient detriment and potentially improved quality of life.
Finally, as new and expensive immunotherapies are being introduced, it will be critical to understand how these agents impact both cost and survival and how they can be incorporated into alternative payment models. Only by understanding the drivers of payment differentials across patient demographics, cancer characteristics, and time can we both decrease costs and increase quality, thereby reducing the burden of cancer care.
See http://www.TheOncologist.com for supplemental material available online.
Supplementary Material
Acknowledgments
This project was supported by the National Cancer Institute (1‐R01‐CA‐174768‐01‐A1 to D.C.M. & 5‐T32‐CA‐180984‐03 to D.R.K.).
Footnotes
For Further Reading: Yen‐Ni Hung, Tsang‐Wu Liu, Fur‐Hsing Wen et al. Escalating Health Care Expenditures in Cancer Decedents' Last Year of Life: A Decade of Evidence from a Retrospective Population‐Based Cohort Study in Taiwan. The Oncologist 2017;22:460–469; first published on February 23, 2017.
Implications for Practice: Cancer‐care costs are highest during the end‐of‐life (EOL) period for cancer decedents. This population‐based study longitudinally examined EOL expenditures for cancer decedents. Mean annual EOL‐care expenditures for Taiwanese cancer decedents increased from U.S. $49,591 to U.S. $68,773 from the year 2000 to 2010, with one third of spending in patients' last month and more than for six developed non‐U.S. countries surveyed in 2010. To slow the increasing cost of EOL‐cancer care, interventions should target hospitals/clinicians less experienced in providing EOL care, who tend to provide aggressive EOL care to highrisk patients, to avoid the physical suffering, emotional burden, and financial costs of aggressive EOL care.
Author Contributions
Conception/design: Deborah R. Kaye, Chad Ellimoottil, David C. Miller
Collection and/or assembly of data: Deborah R. Kaye
Data analysis and interpretation: Deborah R. Kaye, Hye Sung Min, Lindsey A. Herrel, James M. Dupree, Chad Ellimoottil
Manuscript writing: Deborah R. Kaye, Hye Sung Min, Lindsey A. Herrel, James M. Dupree, Chad Ellimoottil
Final approval of manuscript: Deborah R. Kaye, Hye Sung Min, Lindsey A. Herrel, James M. Dupree, Chad Ellimoottil
Disclosures
The authors indicated no financial relationships.
References
- 1. Farina KL. The economics of cancer care in the United States. Am J Manage Care 2012;18:SP38–SP39. [PubMed] [Google Scholar]
- 2. Mariotto AB, Yabroff KR, Shao Y et al. Projections of the cost of cancer care in the United States: 2010–2020. J Natl Cancer Inst 2011;103:117–128. [DOI] [PMC free article] [PubMed] [Google Scholar]
- 3. Yabroff KR, Lamont EB, Mariotto AB et al. Cost of care for elderly cancer patients in the United States. J Natl Cancer Inst 2008;100:630–641. [DOI] [PubMed] [Google Scholar]
- 4. Skolarus TA, Zhang Y, Miller DC et al. The economic burden of prostate cancer survivorship care. J Urol 2010;184:532–538. [DOI] [PubMed] [Google Scholar]
- 5. Gottlieb DJ, Zhou W, Song Y et al. Prices don't drive regional medicare spending variations. Health Aff (Millwood) 2010;29:537–543. [DOI] [PMC free article] [PubMed] [Google Scholar]
- 6. Xu X, Herrin J, Soulos PR et al. The role of patient factors, cancer characteristics, and treatment patterns in the cost of care for medicare beneficiaries with breast cancer. Health Serv Res 2016;51:167–186. [DOI] [PMC free article] [PubMed] [Google Scholar]
- 7. Sagar B, Lin YS, Castel LD. Cost drivers for breast, lung, and colorectal cancer care in a commercially insured population over a 6‐month episode: An economic analysis from the payer perspective. J Med Econ 2017;20:1018–1023. [DOI] [PubMed] [Google Scholar]
- 8. Sheppard VB, Isaacs C, Luta G et al. Narrowing racial gaps in breast cancer chemotherapy initiation: The role of the patient‐provider relationship. Breast Cancer Res Treat 2013;139:207–216. [DOI] [PMC free article] [PubMed] [Google Scholar]
- 9. Green JB, Shapiro MF, Ettner SL et al. Physician variation in lung cancer treatment at the end of life. Am J Manag Care 2017;23:216–223. [PMC free article] [PubMed] [Google Scholar]
- 10. Sargent DJ, Goldberg RM, Jacobson SD et al. A pooled analysis of adjuvant chemotherapy for resected colon cancer in elderly patients. N Engl J Med 2001;345:1091–1097. [DOI] [PubMed] [Google Scholar]
- 11. Jazieh AR, Kyasa MJ, Sethuraman G et al. Disparities in surgical resection of early‐stage non–small cell lung cancer. J Thorac Cardiovasc Surg 2002;123:1173–1176. [DOI] [PubMed] [Google Scholar]
- 12. Shugarman LR, Mack K, Sorbero ME et al. Race and sex differences in the receipt of timely and appropriate lung cancer treatment. Med Care 2009;47:774–781. [DOI] [PubMed] [Google Scholar]
- 13. Rink M, Chun FK, Chromecki TF et al. Advanced bladder cancer in elderly patients. Prognostic outcomes and therapeutic strategies [in German]. Urologe A 2012;51:820–828. [DOI] [PubMed] [Google Scholar]
- 14. May P, Garrido MM, Aldridge MD et al. Prospective cohort study of hospitalized adults with advanced cancer: Associations between complications, comorbidity, and utilization. J Hosp Med 2017;12:407–413. [DOI] [PubMed] [Google Scholar]
- 15. Abdollah F, Sammon JD, Majumder K et al. Racial disparities in end‐of‐life care among patients with prostate cancer: A population‐based study. J Natl Compr Canc Netw 2015;13:1131–1138. [DOI] [PubMed] [Google Scholar]
- 16. Daniel CL, Gilreath K, Keyes D. Colorectal cancer disparities beyond biology: Screening, treatment, access. Front Biosci (Landmark Ed) 2017;22:465–478. [DOI] [PubMed] [Google Scholar]
- 17. Taioli E, Flores R. Appropriateness of surgical approach in black patients with lung cancer—15 years later, little has changed. J Thorac Oncol 2017;12:573–577. [DOI] [PubMed] [Google Scholar]
- 18. Brooks GA, Li L, Uno H et al. Acute hospital care is the chief driver of regional spending variation in Medicare patients with advanced cancer. Health Aff (Millwood) 2014;33:1793–1800. [DOI] [PMC free article] [PubMed] [Google Scholar]
- 19. Tangka FK, Trogdon JG, Richardson LC et al. Cancer treatment cost in the United States: Has the burden shifted over time? Cancer 2010;116:3477–3484. [DOI] [PubMed] [Google Scholar]
- 20. Berger NA, Savvides P, Koroukian SM et al. Cancer in the elderly. Trans Am Clin Climatol Assoc 2006;117:147–156. [PMC free article] [PubMed] [Google Scholar]
- 21.Deloitte. The evolution of oncology payment models: What can we learn from early experiments? Available at https://www2.deloitte.com/content/dam/Deloitte/us/Documents/life-sciences-health-care/us-lshc-evolution-of-oncology-payment-models.pdf. Accessed June 6, 2017.
- 22. Kline R, Adelson K, Kirshner JJ et al. The Oncology Care Model: Perspectives from the Centers for Medicare & Medicaid Services and participating oncology practices in academia and the community. Am Soc Clin Oncol Educ Book 2017;37:460–466. [DOI] [PubMed] [Google Scholar]
Associated Data
This section collects any data citations, data availability statements, or supplementary materials included in this article.


