Abstract
Purpose:
To report the normal characteristics and correlations of the foveal microvascular networks using optical coherence tomography angiography (OCTA) in a healthy Iranian population.
Methods:
Enface 3x3 OCTA images were obtained using the RTVue Avanti spectral-domain optical coherence tomography with AngioVue software (Optovue, Fremont, CA, USA). Foveal avascular zone (FAZ) area, central foveal point thickness and inner retinal thickness at the foveal center and the vascular density of the superficial retinal capillary plexus (SCP) and deep retinal capillary plexus (DCP) in the fovea were recorded.
Results:
Seventy normal eyes of 70 subjects (range, 9 to 71 years) were studied. Mean FAZ area was 0.32 ± 0.11 (range, 0.13-0.67) mm2 in SCP and 0.50 ± 0.13 (range, 0.19-0.94) mm2 in DCP. Mean SCP vessel density was 29.6 ± 4.7 (range, 16.3-40.3) % in the fovea. Mean DCP vessel density was 27.0 ± 5.9 (range, 15.0-45.2) % in the fovea. The FAZ area at SCP level was negatively correlated to the central subfield thickness (P < 0.001). The FAZ area at DCP level correlated negatively to the central subfield thickness and was significantly associated to age (both P < 0.001). The foveal SCP vessel density significantly correlated with foveal thickness and the foveal DCP vessel density correlated significantly with central foveal subfield thickness and was inversely related to age (all P < 0.05).
Conclusion:
In this study, central foveal subfield thickness was a major determinant of the FAZ size and foveal vessel density. Age was a determinant for FAZ area and whole image vessel density in DCP.
Keywords: Central Foveal Subfield Thickness, Deep Capillary Plexus, Foveal Avascular Zone, Optical Coherence Tomography Angiography, Superficial Capillary Plexus, Vessel Density
INTRODUCTION
Foveal microvascular network is affected in many retinal diseases, including diabetic retinopathy and retinal vascular occlusions. Foveal avascular zone (FAZ) area and capillary density are associated with visual acuity and are good indicators of the activity of a retinal disease.[1,2,3,4] Traditionally evaluation of the retinal microvascular network has been performed using fluorescein angiography (FA), which is an invasive and time-consuming procedure. In addition, FA images are two-dimensional, and significant leakage may complicate the interpretation.
Optical coherence tomography angiography (OCTA) is a novel noninvasive technique that provides high resolution three-dimensional maps of the retinal and choroidal microvasculature. The technique allows precise mapping and quantification of the superficial and deep retinal capillary plexi, and it can show pathologic changes in the foveal microvascular networks.[5,6]
Several studies have shown abnormalities in the foveal avascular zone and vessel density in various retinal diseases detectable by OCTA.[5,6] However, few studies have reported the characteristics of FAZ and vessel density in healthy eyes to validate the OCTA findings in abnormal eyes.[7,8,9,10,11,12,13] These characteristics are variable, and their correlations with various demographic and anatomic parameters are inconsistent. The aim of the current study is to report the normal characteristics of the foveal microvascular networks and their correlations in a sample of healthy Iranians.
METHODS
In this prospective observational case series, OCTA imaging was performed on healthy individuals in the eye clinic of Rassoul Akram Hospital from December 2016 to May 2017. Eye Research Center Ethics Committee approved the study, and informed consent was obtained from each study participant.
Healthy subjects were selected from the hospital employees and patients' attendants who had best-corrected visual acuity of 20/20 and normal ocular examination. Eyes with any ocular pathology, except for mild nuclear sclerotic cataract, and those with spherical equivalent refraction of more than 3 diopters of myopia or hyperopia were excluded. Furthermore, patients with diabetes and patients with a history of intraocular surgery, except for cataract surgery more than 6 months prior to recruitment, were excluded.
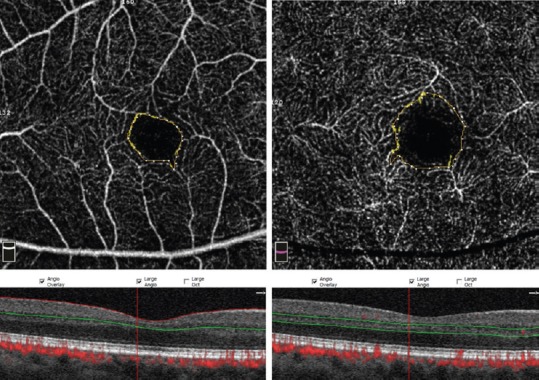
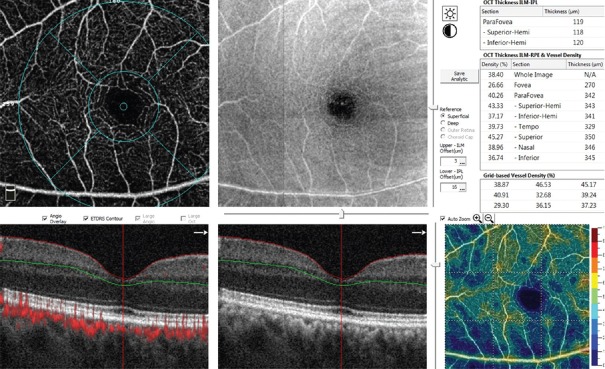
En face 3x3 OCTA images were obtained using the RTVue Avanti spectral-domain optical coherence tomography system with the AngioVue software (Version 2016.1.0.26; Optovue, Inc, Fremont, CA). Images with a scan quality of <40 and those with significant motion and segmentation artifacts were excluded. Two independent graders (DN and HS) measured the FAZ area, central foveal point thickness, and inner retinal thickness at the foveal center. The border of FAZ area was outlined manually, and the surface area was then measured in square millimeters using built-in software under the flow option of the instrument in the superficial retinal capillary plexus (SCP) and deep retinal capillary plexus (DCP) [Figure 1]. For the DCP, the graders tried to ignore the projection of the superficial vessels by performing meticulous comparison of vessels between the retinal slabs (generally, the first vascular loop inside the FAZ).[8] The SCP en face image was segmented using an inner boundary set at 3 μm beneath the internal limiting membrane and an outer boundary set at 15 μm beneath the inner plexiform layer. The DCP en face image was segmented using an inner boundary set at 15 μm beneath the inner plexiform layer and an outer boundary set at 70 μm beneath the inner plexiform layer. The macular map was defined based on Early Treatment of Diabetic Retinopathy Study (ETDRS). The grid consists of three concentric circles at the fovea with diameters of 1 mm, 3 mm, and 6 mm. Parafovea was considered as the area between the inner (1-mm) and middle (3-mm) rings. The vascular density of the SCP and DCP in the fovea (central 1 mm of the ETDRS grid) and parafovea (500 μm to 1500 μm from the foveal center) was automatically generated by the instrument and recorded [Figure 2].
Figure 1.

Measurement of foveal avascular zone size in the superficial (left) and deep (right) capillary plexus. Projection artifact of superficial vessels can be seen within borders of deep FAZ.
Figure 2.
The screen display for the measurement of vessel density at the level of superficial capillary plexus. The grid was centered on the foveal center using the thinnest point of the corresponding optical coherence tomography image.
The foveal OCT B scan was used to center the grid.[14] Central foveal point thickness (CFPT) and inner retinal thickness (IRT) were measured at the foveal center using the caliper of the software from the ILM to the top of RPE and from the ILM to interface of the inner nuclear and outer plexiform layers, respectively.
Central subfield and parafoveal ring thicknesses and vessel density of the central subfield and parafoveal ring were extracted from the automated software analysis.
Data were analyzed using SPSS software version 16 (SPSS Inc., Chicago Illinois). Only one eye of each patient was randomly selected for analysis. Intraclass correlation coefficient (ICC) and Bland-Altman plots were used to evaluate the agreement between two independent graders. The mean of the two measurements was used for further analysis.
Pearson correlation test and Chi square tests were used in the analysis. Multivariate analysis was performed using multiple linear regression test. Correlations between FAZ or VD and age, sex, spherical equivalent refraction, CFPT, central subfield thickness, and IRT were analyzed. A P value less than 0.05 was considered significant.
RESULTS
Seventy eyes of 70 healthy individuals comprising 30 males and 40 females with a mean age of 42.8 ± 17.2 (range, 9 to 71) years were included. Mean spherical equivalent refraction was -0.05 ± 0.9 (range, -2.75 to + 2.75) diopters. Forty-seven eyes were right eyes.
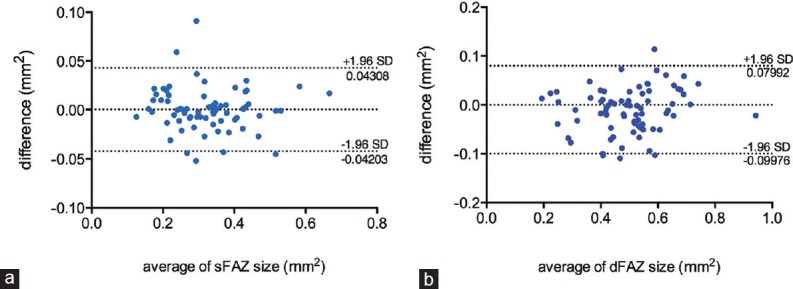
There was excellent agreement between the graders with respect to measurement of the FAZ area at SCP (ICC = 0.99) and DCP (ICC = 0.97) and measurement of CFPT (ICC = 0.94) and IRT (ICC = 0.89). Figure 3 is a Bland-Altman plot of the agreement between the two independent observers measuring the FAZ area at SCP and DCP levels. The mean difference between the graders was not significantly different from zero (P = 0.835 and P = 0.065 for superficial and deep FAZ size measurements, respectively).
Figure 3.

Bland and Altman plot showing agreement between the graders for the superficial foveal avascular zone (sFAZ) and deep foveal avascular zone (dFAZ) measurements (a and b, respectively).
Table 1 shows the foveal microvascular measurements according to the decades of age. The mean FAZ area was 0.32 ± 0.11 (range, 0.13-0.67) mm2 in SCP and 0.50 ± 0.13 (range, 0.19-0.94) mm2 in DCP. The mean SCP vessel density was 51.5 ± 4.2 (range, 38.4-58.1) % in the whole image, 29.6 ± 4.7 % (range 16.3-40.3) in the fovea, and 53.6 ± 4.6 % (range 37.7-60.9) in the parafoveal ring. The mean DCP vessel density was 57.4 ± 3.1 % (range, 46.7-63.0) in the whole image, 27.0 ± 5.9 % (range, 15.0-45.2) in the fovea, and 60.1 ± 3.7 % (range 49.4-66.7) in the parafoveal ring. The mean central subfield and parafoveal retinal thicknesses were 247.4 ± 21.3 (range, 192-300) μm and 317.8 ± 15.3 (range 279-357) μm, respectively. The mean CFPT and IRT was 205.2 ± 13.9 (range, 185.5-245.5) μm and 19.5 ± 5.7 (4-36) μm, respectively.
Table 1.
Foveal avascular zone dimensions and vascular densities in different age groups

In univariate analysis, the FAZ area in SCP correlated significantly with the central subfield thickness (r = -0.72, P < 0.001) and CFPT (r = -0.51, P < 0.001). The FAZ area in DCP correlated significantly with the central subfield thickness (r = -0.38, P = 0.01) and age (r = 0.50, P < 0.001). The FAZ area in both SCP and DCP was significantly larger in the females (0.35 ± 0.12 vs 0.29 ± 0.07 mm2, P = 0.031 for SCP and 0.53 ± 0.15 vs 0.47 ± 0.10 mm2, P = 0.045 for DCP). No significant associations were found between FAZ size at SCP or DCP level and inner retinal thickness measurements (all P > 0.05). Multiple linear regression analysis using FAZ size as an outcome variable and age, sex, central subfield, and central foveal point thickness as predictors revealed that, at the SCP level, the size of FAZ was independently associated with central subfield thickness (beta = -0.67, P < 0.001, R2 = 0.51); at the DCP level, the size of FAZ was independently associated with age and central subfield thickness (beta = 0.63, P < 0.001 and beta = -0.51, P < 0.001, respectively, R2 = 0.52).
In univariate analysis, superficial foveal, parafoveal, and whole-image vessel densities correlated significantly with CFPT (r = 0.45, P < 0.001; r = -0.27, P = 0.021; and r = -0.24, P = 0.045; respectively) and central subfield thickness (r = 0.58, P < 0.001; r = -0.323, P = 0.006; r = -0.27, P = 0.023; respectively). Similarly, deep foveal, parafoveal, and whole-image vessel densities correlated significantly with central subfield thickness (r = 0.62, P < 0.001; r = -0.38, P = 0.01; r = -0.29, P = 0.015; respectively). Deep foveal vessel density correlated significantly with CFPT (r = 0.33, P = 0.005). In addition, the deep parafoveal and whole-image vessel densities correlated significantly with age (both r = -0.51, P < 0.001). Multiple linear regression analysis using vessel densities as outcome variables and age, central subfield and central foveal point thickness as predictors revealed superficial foveal vessel density was independently associated with central subfield thickness (beta = 0.51, P < 0.001, R2 = 0.32); however, the superficial parafoveal and whole-image vessel densities were not independently associated with CFPT or central subfield thickness (all P > 0.05). At deep capillary plexus level, multiple linear regression revealed deep foveal vessel density was independently associated with central subfield thickness (beta = 0.708, P < 0.001, R2 = 0.38) and deep parafoveal and whole-image vessel densities were independently associated with age (beta = -0.45, P < 0.001, R2 = 0.30 and beta = -0.47, P < 0.001, R2 = 0.27, respectively).
DISCUSSION
Using OCTA to determine reference values for FAZ size and vessel density at SCP and DCP in healthy eyes may be useful in the extensive investigation of vascular retinal disorders and in identifying eyes at risk of developing various macular pathologies. We report FAZ area and vessel density using OCTA in a healthy Iranian population. In this study, a set of normative values are generated from a well-balanced sample comprising a wide range of age groups. FAZ size and vessel density at the level of the DCP and SCP are reported according to age group and sex, and the reliability of the measurements are confirmed.
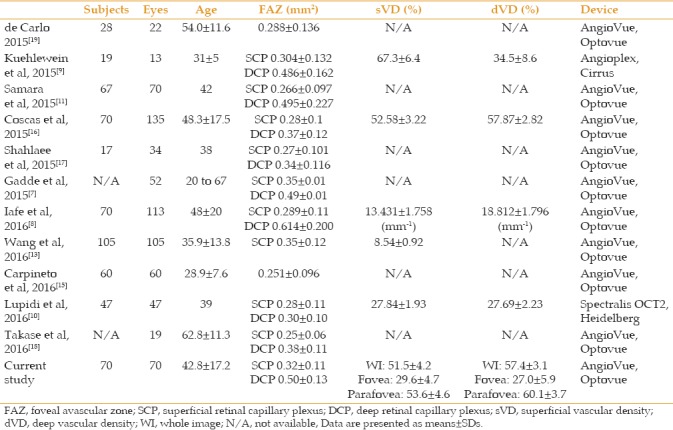
Several studies have reported the FAZ area and vessel density measurements using OCTA in healthy eyes [Table 2].[7,8,9,10,11,12,13,15,16,17,18,19] The measurements differ significantly between studies. This variability may be explained by differences in the study population (including age, sex, and ethnicity), study devices and software, or methods of measurements. The mean FAZ area at both SCP and DCP in the present study is similar to the values reported in a study in an Indian population.[7]
Table 2.
Comparison of foveal avascular zone size and vessel density measured by optical coherence tomography angiography of normal eyes in different studies

We observed a significant inverse association between FAZ area and foveal thickness at both the SCP and DCP levels. Similarly, other studies have shown that lower central foveal thickness is associated with a larger FAZ area.[11,20] It has been speculated that the higher metabolic requirement of a thicker retina is associated with a reduction of the FAZ area.[11] In addition, the association between FAZ and macular thickness may reflect the stages of foveal development; during foveal development, the FAZ size determines the extent of centrifugal migration of inner retinal layers and thus the central macular thickness.[18,20,21] However, we could not find a correlation between the inner retinal thickness and FAZ area measurements.
The findings of this study indicate that the size of the FAZ area and parafoveal vessel density are significantly associated with age at the DCP level; as age increases, the FAZ area in DCP enlarges and the parafoveal vessel density diminishes. Although the results in a number of prior studies suggest that the FAZ area increases with age, there are other studies that have shown contrasting findings.[2,3,22,23,24] Coscas et al.[16] have shown that the FAZ area in SCP significantly decreases in older age, and Lafe et al.[8] recorded decreased vessel density in both DCP and SCP and increased FAZ area with age. Coscas et al.[16] suggested that the reduction in FAZ size and vessel density with age might be attributed to age-related occlusive and atrophic changes in macular capillaries.
We have demonstrated an excellent agreement between two independent graders measuring FAZ size and CPFT manually. This finding has also been observed in other studies evaluating the reliability of FAZ measurement using OCTA.[7,13,15] However, some studies have reported low agreement between graders during DCP measurements.[17] Lower rates of projection artifact from superficial vessels or proper training of the graders to recognize and ignore these projections may account for the excellent agreement in measuring deep FAZ area in the present study.
There are some limitations in the current study. First, only subjects with small refractive errors (-3 to + 3) were included; hence, the possible effects of higher levels of myopia or hyperopia on the foveal microvasculature were not assessed. Second, the relatively small sample size may limit the generalizability of our findings. In addition, study subjects were healthy Iranian people who may not represent the entire Iranian population. Despite the small sample size, the number of subjects in early and late decades of life was greater than in similar studies, which can be considered a strength of the current study. Third, there are some intrinsic limitations of OCTA, such as various types of artifacts, and there are limitations in the software's accuracy in measurements.[17,25,26] Imaging artifacts occur more frequently in people with ocular pathology and poor cooperation; consequently, assessment of foveal microvasculature is more complicated in diseased subjects.
In conclusion, OCTA is a non-invasive tool for accurate measurement of the FAZ and assessment of the foveal vasculature. We observed that the FAZ size in SCP and DCP is inversely associated with foveal thickness, and the FAZ size increases with older age in DCP. In addition, foveal thickness affects vessel density measurements.
Financial Support and Sponsorship
Nil.
Conflicts of Interest
There are no conflicts of interest.
REFERENCES
- 1.Arend O, Wolf S, Harris A, Reim M. The relationship of macular microcirculation to visual acuity in diabetic patients. Arch Ophthalmol. 1995;113:610–614. doi: 10.1001/archopht.1995.01100050078034. [DOI] [PubMed] [Google Scholar]
- 2.Bresnick GH, Condit R, Syrjala S, Palta M, Groo A, Korth K. Abnormalities of the foveal avascular zone in diabetic retinopathy. Arch Ophthalmol. 1984;102:1286–1293. doi: 10.1001/archopht.1984.01040031036019. [DOI] [PubMed] [Google Scholar]
- 3.Mansour A, Schachat A, Bodiford G, Haymond R. Foveal avascular zone in diabetes mellitus. Retina. 1993;13:125–128. doi: 10.1097/00006982-199313020-00006. [DOI] [PubMed] [Google Scholar]
- 4.Parodi MB, Visintin F, Della Rupe P, Ravalico G. Foveal avascular zone in macular branch retinal vein occlusion. Int Ophthalmol. 1995;19:25–28. doi: 10.1007/BF00156415. [DOI] [PubMed] [Google Scholar]
- 5.Chalam K, Sambhav K. Optical coherence tomography angiography in retinal diseases? J Ophthalmic Vis Res. 2016;11:84–92. doi: 10.4103/2008-322X.180709. doi: 10.4103/2008-322x.180709. [DOI] [PMC free article] [PubMed] [Google Scholar]
- 6.Falavarjani KG, Sarraf D. Optical coherence tomography angiography of the retina and choroid; current applications and future directions. J Current Ophthalmol. 2017;29:1. doi: 10.1016/j.joco.2017.02.005. [DOI] [PMC free article] [PubMed] [Google Scholar]
- 7.Gadde SG, Anegondi N, Bhanushali D, Chidambara L, Yadav NK, Khurana A, et al. Quantification of vessel density in retinal optical coherence tomography angiography images using local fractal dimension. Invest Ophthalmol Vis Sci. 2016;57:246–252. doi: 10.1167/iovs.15-18287. [DOI] [PubMed] [Google Scholar]
- 8.Iafe NA, Phasukkijwatana N, Chen X, Sarraf D. Retinal capillary density and foveal avascular zone area are age-dependent: Quantitative analysis using optical coherence tomography angiography. Invest Ophthalmol Vis Sci. 2016;57:5780–5787. doi: 10.1167/iovs.16-20045. [DOI] [PubMed] [Google Scholar]
- 9.Kuehlewein L, Tepelus TC, An L, Durbin MK, Srinivas S, Sadda SR. Noninvasive visualization and analysis of the human parafoveal capillary network using swept source OCT optical microangiography. Invest Ophthalmol Vis Sci. 2015;56:3984–3988. doi: 10.1167/iovs.15-16510. [DOI] [PubMed] [Google Scholar]
- 10.Lupidi M, Coscas F, Cagini C, Fiore T, Spaccini E, Fruttini D, et al. Automated quantitative analysis of retinal microvasculature in normal eyes on optical coherence tomography angiography. Am J Ophthalmol. 2016;169:9–23. doi: 10.1016/j.ajo.2016.06.008. [DOI] [PubMed] [Google Scholar]
- 11.Samara WA, Say EA, Khoo CT, Higgins TP, Magrath G, Ferenczy S, et al. Correlation of foveal avascular zone size with foveal morphology in normal eyes using optical coherence tomography angiography. Retina. 2015;35:2188–2195. doi: 10.1097/IAE.0000000000000847. [DOI] [PubMed] [Google Scholar]
- 12.Shahlaee A, Samara WA, Hsu J, Say EA, Khan MA, Sridhar J, et al. In vivo assessment of macular vascular density in healthy human eyes using optical coherence tomography angiography. Am J Ophthalmol. 2016;165:39–46. doi: 10.1016/j.ajo.2016.02.018. [DOI] [PubMed] [Google Scholar]
- 13.Wang Q, Chan S, Yang JY, You B, Wang YX, Jonas JB, et al. Vascular density in retina and choriocapillaris as measured by optical coherence tomography angiography. Am J Ophthalmol. 2016;168:95–109. doi: 10.1016/j.ajo.2016.05.005. [DOI] [PubMed] [Google Scholar]
- 14.Falavarjani KG, Khadamy J, Safi H, Karimi N, Amirkourjani F. Effect of grid decentration on macular thickness measurements in normal subjects and patients with diabetic macular edema. Eur J Ophthalmol. 2015;25:218–221. doi: 10.5301/ejo.5000539. [DOI] [PubMed] [Google Scholar]
- 15.Carpineto P, Mastropasqua R, Marchini G, Toto L, Di Nicola M, Di Antonio L. Reproducibility and repeatability of foveal avascular zone measurements in healthy subjects by optical coherence tomography angiography. Br J Ophthalmol. 2016;100:671–676. doi: 10.1136/bjophthalmol-2015-307330. [DOI] [PubMed] [Google Scholar]
- 16.Coscas F, Sellam A, Glacet-Bernard A, Jung C, Goudot M, Miere A, et al. Normative data for vascular density in superficial and deep capillary plexuses of healthy adults assessed by optical coherence tomography angiography. Invest Ophthalmol Vis Sci. 2016;57:OCT211–OCT223. doi: 10.1167/iovs.15-18793. [DOI] [PubMed] [Google Scholar]
- 17.Shahlaee A, Pefkianaki M, Hsu J, Ho AC. Measurement of foveal avascular zone dimensions and its reliability in healthy eyes using optical coherence tomography angiography. Am J Ophthalmol. 2016;161:50–55e1. doi: 10.1016/j.ajo.2015.09.026. [DOI] [PubMed] [Google Scholar]
- 18.Takase N, Nozaki M, Kato A, Ozeki H, Yoshida M, Ogura Y. Enlargement of foveal avascular zone in diabetic eyes evaluated by en face optical coherence tomography angiography. Retina. 2015;35:2377–2383. doi: 10.1097/IAE.0000000000000849. [DOI] [PubMed] [Google Scholar]
- 19.de Carlo TE, Chin AT, Bonini Filho MA, Adhi M, Branchini L, Salz DA, et al. Detection of microvascular changes in eyes of patients with diabetes but not clinical diabetic retinopathy using optical coherence tomography angiography. Retina. 2015;35:2364–2370. doi: 10.1097/IAE.0000000000000882. [DOI] [PubMed] [Google Scholar]
- 20.Tick S, Rossant F, Ghorbel I, Gaudric A, Sahel J-A, Chaumet-Riffaud P, et al. Foveal shape and structure in a normal population. Invest Ophthalmol Vis Sci. 2011;52:5105–5110. doi: 10.1167/iovs.10-7005. [DOI] [PubMed] [Google Scholar]
- 21.Falavarjani KG, Iafe NA, Velez FG, Schwartz SD, Sadda SR, Sarraf D, et al. Optical coherence tomography angiography of the fovea in children born preterm. Retina. 2017;37:2289–2294. doi: 10.1097/IAE.0000000000001471. [DOI] [PubMed] [Google Scholar]
- 22.Conrath J, Giorgi R, Raccah D, Ridings B. Foveal avascular zone in diabetic retinopathy: Quantitative vs qualitative assessment. Eye. 2005;19:322. doi: 10.1038/sj.eye.6701456. [DOI] [PubMed] [Google Scholar]
- 23.Laatikainen L, Larinkari J. Capillary-free area of the fovea with advancing age. Invest Ophthalmol Vis Sci. 1977;16:1154–1157. [PubMed] [Google Scholar]
- 24.Wu L, Huang Z, Wu D, Chan E. Characteristics of the capillary-free zone in the normal human macula. Jpn J Ophthalmol. 1985;29:406–411. [PubMed] [Google Scholar]
- 25.Al-Sheikh M, Falavarjani KG, Akil H, Sadda SR. Impact of image quality on OCT angiography based quantitative measurements. Int J Retina Vitreous. 2017;3:13. doi: 10.1186/s40942-017-0068-9. [DOI] [PMC free article] [PubMed] [Google Scholar]
- 26.Falavarjani KG, Al-Sheikh M, Akil H, Sadda SR. Image artefacts in swept-source optical coherence tomography angiography. Br J Ophthalmol. 2017;101:564–568. doi: 10.1136/bjophthalmol-2016-309104. [DOI] [PubMed] [Google Scholar]


