

Abstract
At similar smoking levels African American’s lung cancer risk is as much as twice that of whites. We hypothesized that racial/ethnic differences in UDP-glucuronosyltransferase (UGT)-catalyzed glucuronidation of 4-(methylnitrosamino)-1-(3-pyridyl)-1-butanol (NNAL), a detoxication pathway for the tobacco-specific lung carcinogen NNK (4-(methylnitrosamino)-1-(3-pyridyl)-1-butanone), may contribute to this variable risk. UGT2B10 catalyzes NNAL N-glucuronidation and a UGT2B10 splice variant is common among African Americans. Smokers from two independent studies were genotyped for this variant (rs116294140) and an Asp67Tyr variant (rs61750900), and urinary NNAL and NNAL glucuronide concentrations were quantified. In the first, no significant differences in NNAL-N-glucuronidation between African Americans (n=257) and whites (n=354), or between homozygous carriers of UGT2B10 variants (genetic score 2) and non-carriers (score 0) were detected. However, total NNAL glucuronidation by score 2 compared to score 0 smokers was lower (68.9% vs 71.2%, p<0.0001). To more precisely quantify NNAL N-glucuronide in a second study, a sensitive high resolution LC-MS/MS-based method, which separated NNAL, NNAL-O-glucuronide and NNAL-N-glucuronide prior to analysis, was developed. In this study, the excretion of total NNAL (free plus glucuronides) by African American (n=52) and white (n=54) smokers was not different, however, total NNAL glucuronidation by African Americans (64.0%) was slightly less than by whites (68.3%, p=0.05). The mean NNAL N-glucuronidation by African Americans was much lower than for whites (14% vs 24.9%, p<0.00001) but the NNAL O-glucuronidation was greater (50.0% vs 43.3%, p=0.013). UGT2B10 genotype influenced NNAL N-glucuronidation; the geometric mean percentage N-glucuronidation was 22.5% for smokers with genetic score 0 (n=57) and 11.2% for score 2 (n=11). In summary, the high prevalence of a UGT2B10 splice variant among African Americans results in lower NNAL N-glucuronidation but only a small decrease in total NNAL glucuronidation. Therefore despite the significant contribution of UGT2B10 to NNAL-N-glucuronidation, UGT2B10 genotype does not play a large role in NNAL detoxication. Any decrease in N-glucuronidation was accompanied by a parallel increase in O-glucuronidation.
TOC Figure

Introduction
Worldwide, in 2012 there were over 1.6 million deaths from lung cancer.1 In the United States, lung cancer is the leading cause of cancer-related death; its incidence is second only to breast cancer in woman and prostate cancer in men.2 Smoking cigarettes is the main cause of lung cancer, accounting for 90% of the deaths from this disease in the U.S. However, only 11–24% of smokers develop lung cancer and for the same quantity of cigarettes smoked the risk of lung cancer varies by racial/ethnic group.3 For similar low levels of cigarettes smoked per day (10–15) the lung cancer risk of African Americans is twice that of whites.4 This discrepancy in risk appears in part to be explained by a greater intensity of smoking per cigarette by African Americans compared to white smokers.5, 6 However, racial/ethnic differences in tobacco carcinogen metabolism, activation or detoxication, may also play a role.
Among the more than 70 carcinogens in tobacco smoke, the tobacco specific nitrosamine 4-(methylnitrosamino)-1-(3-pyridyl)butanone (NNK) is considered an important causative agent for lung cancer. As the result of numerous studies in laboratory animals and epidemiological investigations, NNK was classified as a human lung carcinogen by the International Agency for Research on Cancer.7 In smokers, NNK is metabolized by three pathways, N-oxidation, α-hydroxylation and reduction to 4-(methylnitrosamino)-1-(3-pyridyl)-1-butanol (NNAL, Scheme 1).8 NNAL is carcinogenic, and like NNK it is metabolically activated by P450-catalyzed α-hydroxylation.8 Detoxication of NNAL, which occurs by UDP-glucuronosyltransferase (UGT)-catalyzed glucuronidation, is also an important pathway for the detoxication of NNK. Both NNAL N-glucuronide (NNAL-N-gluc) and NNAL O-glucuronide (NNAL-O-gluc) are excreted in smokers’ urine (Scheme 1). UGT2B7, UGT2B17 and UGT1A9 are catalysts of NNAL O- glucuronidation,9–11 whereas UGT2B10 and UGT1A4 catalyze NNAL N-glucuronidation.12, 13 However, it has been reported that UGTB10 is a more efficient catalyst of NNAL-N-glucuronidation and that this enzyme may be the more important catalyst in smokers, since smokers who carry the Asp67Tyr UGT2B10 variant excreted lower levels of NNAL-N-gluc.11, 13
Scheme 1.
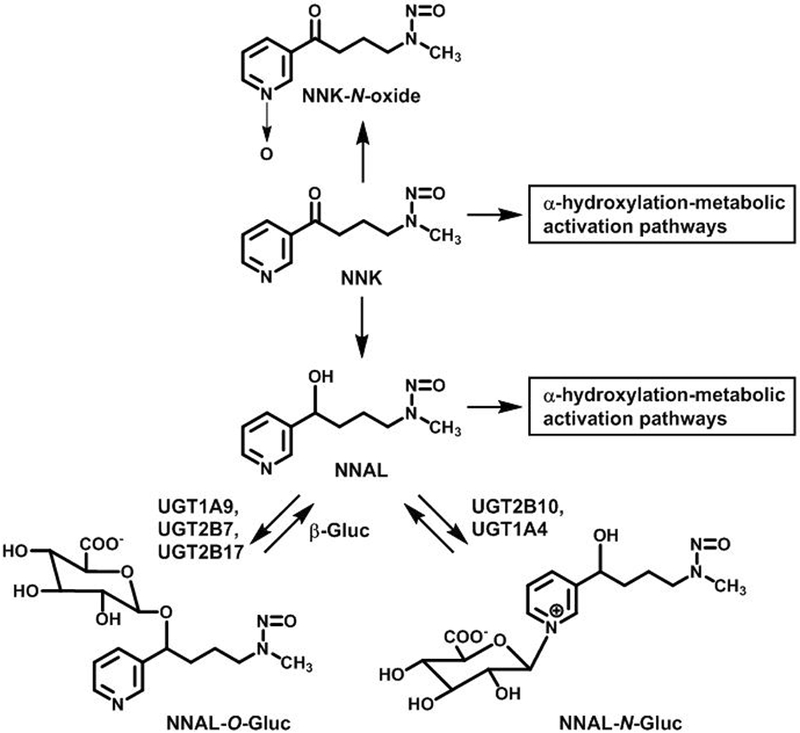
NNK metabolism and NNAL glucuronidation pathways.
Nicotine and its primary metabolite cotinine are also metabolized by N-glucuronidation of the pyridine ring. In vitro, both UGT2B10 and UGT1A4 are catalysts of these reactions.14–16 However, in smokers, UGT2B10 is the only enzyme that contributes significantly to cotinine and nicotine N-glucuronidation.17, 18 Individuals who have no functional UGT2B10 enzyme excrete little if any cotinine or nicotine glucuronide.18 Two single nucleotide polymorphisms in UGT2B10, a missense mutation, Asp67Tyr and a splice variant, result in the expression of no functional enzyme.14, 18, 19 Smokers who are heterozygous for these variant alleles excrete approximately 50% as much nicotine and cotinine glucuronide as do smokers who carry neither allele.17, 18
The UGT2B10 splice variant (rs116294140) has an allele frequency of between 35 and 39% in African Americans,18–20 and its prevalence in African Americans results in significantly lower levels of nicotine and cotinine glucuronidation and this contributes to the higher plasma cotinine concentrations typically observed in African American smokers compared to whites.21 We hypothesize that analogously African American smokers may have decreased NNAL N-glucuronidation and potentially decreased detoxication of the tobacco specific lung carcinogen NNK. In the study presented here we report on the influence of UGT2B10 genotype on NNAL glucuronidation in African American compared to white smokers.
Experimental Procedures
Study Population and urine samples
Urine samples analyzed were from two studies, both approved by the University of Minnesota Institutional Review Board. The subjects of Study 1 are the Multiethnic Cohort (MEC)22 participants who were current smokers at the time of (overnight or first morning) urine collection (n=2393), for whom cotinine and total nicotine equivalents (TNE, the sum of total cotinine, total nicotine, total 3-hydroxycotinine and nicotine N-oxide,) were previously quantified and with TNE values >1.27 nmol/ml.18 “Total” refers to the analyte and its glucuronide conjugate. UGT2B10 genotype was available on 2239 of these subjects18 and among these samples 1901 had available measures for all three biomarkers: total NNAL, NNAL and NNAL-N-gluc.5 In addition, for this study’s analyses if total NNAL was <0.45 pmol/ml (n=137) or >10 pmol/ml (extreme outliers, N=10) samples were excluded, leaving 1754 samples. Study 2 consisted of 106 subjects (54 white and 52 African Americans) for whom 24h urine was collected. These were baseline samples collected for a study of NNK metabolism in which current smokers with a smoking history of at least 10 cigarettes daily for 1 year or more were recruited. Subjects were asked to collect a 24 h urine sample and bring it to a research clinic at the University of Minnesota. Urine samples were stored at -20 °C before analysis.
UGT2B10 genotyping
For the MEC study, UGT2B10 genotypes were extracted from Illumina 1M imputed data.23 Genotyping for two UGT2B10 variants in Study 2 participants was performed at University of Hawaii Cancer Center Genomics Shared Resources. The UGT2B10 splice variant (rs116294140/rs2942857) and the Asp67Tyr variant (rs61750900) were genotyped using either lymphocyte or oral cell DNA, and custom designed (Dr. Tiirikainen) TaqMan allele discrimination assays (Applied Biosystems, Carlsbad, CA). The genotype frequencies were consistent with Hardy-Weinberg equilibrium in each ethnic group (P > 0.05). Concordance rate across the ~5% blinded duplicate samples genotyped with the study samples was 100%. The genotyping call rate was 99%.
Analysis of NNAL, NNAL-N-gluc, and NNAL-O-gluc
The urinary concentrations of NNAL and its glucuronide conjugates for the subjects of Study 1 were quantified previously.24 For the NNAL glucuronide analysis, 3 independent aliquots were processed for each urine sample. One aliquot was untreated, one base treated to releases NNAL from NNAL-N-gluc and one treated with ß-glucuronidase to release NNAL from both NNAL-N-gluc and NNAL-O-gluc. The NNAL concentration in each aliquot was quantified by LC-MS-MS and the concentration of NNAL-N-gluc was calculated by subtracting the concentration of free NNAL in the untreated aliquot from the NNAL in the base treated aliquot, and the concentration of NNAL-O-gluc was calculated by subtracting the NNAL in the base treated sample from that in the ß-glucuronidase treated aliquot. As noted above only samples with total NNAL concentrations greater than 0.45 pmol/ml were included in the analysis. This was done to minimize the error in the calculation of the NNAL glucuronides, which would be greatest when two small values are subtracted.
For Study 2, a new method was developed that used a single aliquot of urine and separated NNAL, NNAL-N-gluc and NNAL-O-gluc on a solid phase extraction (SPE) column (Figure 1). In the development of this method a number of SPE columns were tested with various different elution protocols for 1) the retention of NNAL-N-gluc on the column and 2) the complete separation of NNAL-N-gluc, NNAL and NNAL-O-gluc. The NNAL-N-gluc was not retained on any of the 9 SPE column tested (Phenomenex Strata X and Strata XAW and Strata XA, Waters Oasis MAX and MCX, Resprep C18, Hypersep NH2 and CN, Sola WCX, Bondelute PBA). Conditions were defined to efficiently and reproducible separate NNAL-N-gluc, NNAL and NNAL-O-gluc in three fractions on the Strata XA column. The complete separation of each metabolite from the other was confirmed by adding a known amount of one metabolite at increasing concentrations (up to 2.6 pmol/ml) to non-smokers urine and confirming that after β-glucuronidase treatment NNAL was detected only in the correct fraction (Figure 2).
Figure 1.
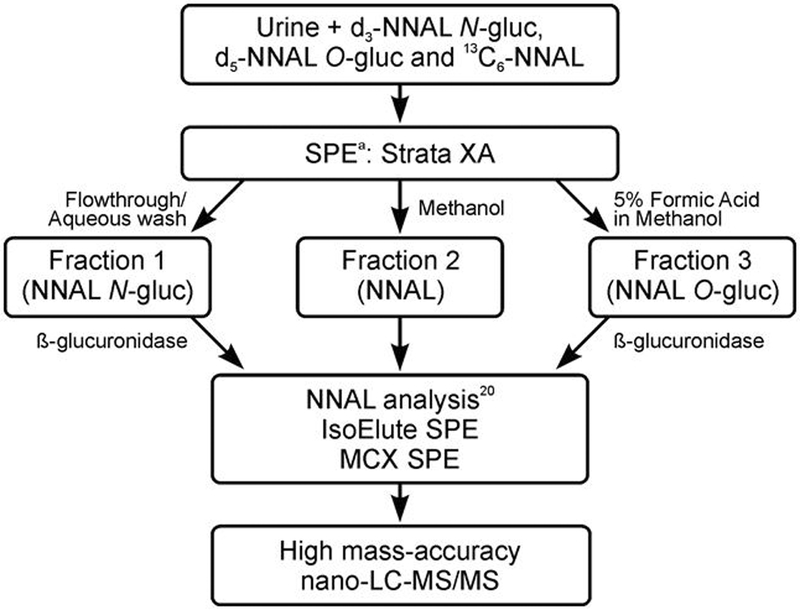
Outline of the high resolution nano-LC-MS/MS method for the analysis of NNAL, NNAL O-glucuronide and NNAL N-glucuronide in smoker’s urine. aSPE = solid phase extraction.
Figure 2.
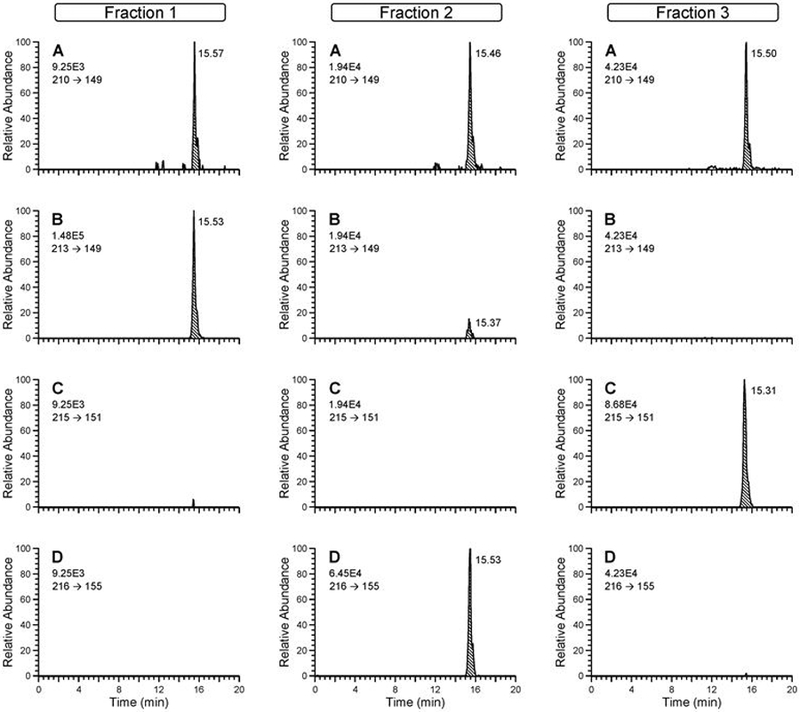
High resolution nano-LC-ESI-MS/MS chromatograms obtained from the analysis of NNAL in Fractions 1, 2 and 3 (Figure 1) of a smoker’s urine sample with three internal standards added (13C6-NNAL, d3-NNAL-N-gluc and d5-NNAL-O-gluc). Monitoring was for (A) 210.12 → 149.08349 (NNAL), (B) 213.14 → 149.08349 (d3-NNAL), (C) 215.14 → 151.09623 (d5-NNAL), and (D) 216.14 → 155.10365 (13C6-NNAL).
The method developed was as follows: Urine (200 ¼L) was mixed with 500 ¼L 25 mM ammonium acetate pH 8.5 containing three internal standards (0.5 pmol 13C6-NNAL, 0.7 pmol d3-NNAL-N-gluc and 0.4 pmol d5-NNAL-O-gluc) and loaded onto a Strata-XA column (30 mg, Phenomenex, Torrance, CA) that had been conditioned with 1 ml methanol (MeOH), 0.5 ml water and 0.5 ml 25 mM ammonium acetate pH 8.5. NNAL and its glucuronides were eluted with 2 ml water (2 ml), 1 ml MeOH and 0.5 ml 5% formic acid in MeOH. The flow through and water fraction containing NNAL-N-gluc were pooled (fraction 1). NNAL was eluted with MeOH (fraction 2) and NNAL-O-gluc was eluted with formic acid/MeOH (fraction 3). The volume of fraction 1 was reduced to about 1.5 ml under a gentle stream of N2. Fractions 2 and 3 were each evaporated to dryness under a stream of N2 and re-suspended in 1 ml phosphate buffered saline. Fractions 1 and 3 were incubated with ß-glucuronidase (E.Coli Sigma, 1600 Units) at 37°C overnight. Then the free NNAL present in each fraction was quantified by the method previously described by Carmella et al.24 with the following modifications: 1) Elution from the MCX 96 well plates was with 95:5 methanol/NH4OH and eluted samples were dried under a stream of N2 and re-suspended in 40 ¼l 10 mM ammonium acetate, and 2) LC-MS/MS analysis was on a high resolution/high mass accuracy instrument with nanoflow LC. Each sample (1 ¼L) was injected onto a nano-column (75 μm ID, 10 cm length, 15 μm orifice) created by hand packing a commercially available fused-silica emitter (New Objective, Woburn MA) with Luna C18 bonded separation media (Phenomenex, Torrance, CA). NNAL was eluted with a mobile phase of 80% 5 mM ammonium acetate: 20% acetonitrile and a flow rate of 1 ¼l/min for the first 5 minutes followed by a flow rate of 300 nL/min, and analyzed by nano electrospray mass spectrometry on an LTQ Orbitrap Velos instrument (Thermo Scientific, Waltham, MA). The electrospray source voltage was set at 2.2 kV. The capillary temperature was 350°C, and the S-Lens RF level was set at 66%. HRMS/MS monitoring was carried out at m/z 210.12 → m/z 149.0835 (NNAL), m/z 213.14 → m/z 149.0835 (d3 NNAL), m/z 215.16 → m/z 151.0962 (D5-NNAL), and m/z 216.14 → m/z 155.1037 (13C6-NNAL), with accurate mass monitoring of the fragment ions at 5 ppm utilizing the Orbitrap detector. In addition, m/z 210.12 → m/z 180.1257, m/z 213.14 → m/z 183.1449, m/z 215.16 → m/z 185.1572 and m/z 216.14 →1 m/z 186.1459 transitions were monitored as qualifying transitions. The fragmentation events were performed using the HCD collision cell with a 2 amu isolation width, collision energy of 35%, and the resolution set at 30,000 (at 400 amu) with an actual resolution of 55,000 (at 180 and 185 amu). The urinary concentrations of NNAL, NNAL-N-gluc and NNAL-O-gluc in each sample were calculated from the ratio of the area of the NNAL peak (m/z 210.12 → m/z 149.0835) to the corresponding internal standard. For free NNAL this is 13C6-NNAL, (m/z 216.14 → m/z 155.1037), for NNAL-N-gluc d3-NNAL (m/z 213.14 → m/z 149.0835), and for NNAL-O-gluc, d5-NNAL (m/z 215.16 → m/z 151.0962).
The limit of quantitation (LOQ) was 0.01 pmol/ml. To confirm the LOQ, two smoker’s samples (0.25 ml) with low NNAL N-gluc levels (0.031 and 0.05 pmol/ml) were spiked with 2.5, 5.0 and 10 fmol to increase the urine concentration by 0.01, 0.02 and 0.04 pmol/ml. The correlation coefficients (r2) for the expected concentration to the measured value for the 2 samples were 0.988, and 0.994, respectively. The interday precision (CV) for NNAL-N-gluc was 9.3%, for replicate analysis (n=4) of 8 samples (0.02 to 0.8 pmol NNAL-N-gluc/ml)
Statistical analysis
All metabolites, with the exception of the NNAL-O- gluc to NNAL-N-gluc ratio had a fairly normal distribution and, therefore, were untransformed; the latter was transformed by the natural log. For ease of interpretation the transformed ratio was back-transformed to its natural scale. To examine the difference of NNAL metabolites across the UGT2B10 genotypes, a UGT2B10 genetic score was created where 0 was assigned to those who were homozygous wildtype for both rs61750900 GG and rs116294140 AA, a score of 1 to those who were heterozygous for either genotype (rs61750900 GT or rs116294140 CA) and a score of 2 to those who carried rs61750900 TT or rs116294140 CC, or were heterozygotes for both rs61750900 GT and rs116294140 CA. The covariate-adjusted arithmetic and geometric (when applicable) means were computed for each ethnic/racial group at the mean covariate vector. Multivariable linear models were adjusted for age at time of urine collection (continuous), sex, TNE and body mass index (BMI) (natural log).
Results
In Study 1, the relative extent of NNAL-N- and O- glucuronidation was determined in 5 ethnic groups. After adjusting for age, sex, TNE and BMI, we found that the percentage of NNAL excreted as glucuronides was highest in African Americans followed by whites, Latinos, Native Hawaiians and lowest in Japanese Americans. When compared to whites, the difference in the NNAL glucuronide arithmetic means was slightly higher in African Americans (74%) compared to whites (72%, p=0.006, Table 1) and Latinos (71%). Whereas Native Hawaiians and Japanese Americans excreted the lowest percentage of NNAL as glucuronide conjugates, 69% and 68% (p<0.0001 compared to whites). In all ethnic groups, NNAL O-glucuronidation is the predominant NNAL glucuronidation pathway, accounting for between 46% and 54% of the NNAL excreted, compared to 20–23% for NNAL N-glucuronidation. NNAL O-glucuronidation was lowest in Native Hawaiians and Japanese American (46% and 47%, respectively) compared to whites (51%; p<0.0001, Table 1). Latino smokers also excreted a lower percentage of NNAL as an O-glucuronide compared to whites (48%, p=0.005), but African American smokers excreted a higher percentage (54%, p=0.008). NNAL N-glucuronidation accounted for 20–21% of the total NNAL excreted by whites, African Americans and Japanese Americans. A slightly higher percentage of NNAL N-glucuronide was excreted by Native Hawaiians (22%) and Latino smokers (23%), and in these two groups the ratio of O-glucuronidation to N-glucuronidation was significantly lower than in the other groups (2.3 vs 2.74 in whites).
Table 1.
Mean NNAL glucuronides as a proportion of total NNAL stratified by race/ethnicity, Study 1, the multiethnic cohort*
| African Americans N=297 |
Native Hawaiians N=246 |
Whites n=354 |
Latinos N=362 |
Japanese Americans N=504 |
|
|---|---|---|---|---|---|
| NNAL –glucuronides1 | 0.74 (0.73–0.75) | 0.69 (0.68–0.70) | 0.72 (0.71–0.73) | 0.71 (0.70–0.72) | 0.68 (0.67–0.69) |
| p-value (compared to whites) | 0.006 | 0.0001 | Ref | 0.239 | <0.0001 |
| NNAL O-glucuronides | 0.54 (0.52–0.55) | 0.46 (0.45–0.48) | 0.51 (0.50–0.52) | 0.48 (0.47–0.50) | 0.47 (0.46–0.48) |
| p-value (compared to whites) | 0.008 | <0.00001 | Ref | 0.005 | <0.0001 |
| NNAL N-glucuronides | 0.20 (0.19–0.21) | 0.22 (0.21–0.24) | 0.21 (0.20–0.22) | 0.23 (0.22– 0.24) | 0.21 (0.20– 0.22) |
| p-value (compared to whites) | 0.38 | 0.05 | Ref | 0.01 | 0.98 |
| Ratio of O- glucuronide/ N-glucuronide** | 2.99 (2.68–3.34) | 2.29 (2.03– 2.58) | 2.74(2.48 – 3.02) | 2.30 (2.09– 2.54) | 2.60 (2.39–2.83) |
| p-value (compared to whites) | 0.25 | 0.023 | Ref | 0.015 | 0.43 |
The proportion of the NNAL glucuronides present in urine was calculated from the following concentrations: NNAL glucuronides,( total NNAL minus free NNAL)/total NNAL; NNAL-N-glucuronidation, (NNAL after base treatment minus free NNAL)/total NNAL; NNAL O-glucuronides, (total NNAL minus NNAL N-gluc)/total NNAL. Values are arithmetic means (95% CI) adjusted for age, sex and BMI (natural log) except as noted
For the ratio of O-glucuronide/N-glucuronide, the geometric mean adjusted for age, sex and BMI was used.
To determine if UGT2B10-catalyzed N-glucuronidation contributed to the variation in NNAL glucuronidation across ethnic/racial groups, the relationship of UGT2B10 genotype to NNAL glucuronidation was determined. Previously, the subjects of this study were genotyped for the UGT2B10 splice variant (rs116294140) and the Asp67Tyr variant (rs61750900) and a UGT2B10 genetic score was defined.18 A score of 2 was assigned to individuals who were homozygous for either the splice variant or the Asp67Tyr variant or who carried one allele for each of these variants. We previously reported that smokers in this study with a genetic score of 2 excreted little or no cotinine or nicotine glucuronide, and heterozygous individuals (genetic score 1) excreted half as much cotinine and nicotine N-glucuronidation as smokers who carried neither variant (genetic score 0).18 From these data we concluded that UGT2B10 was essentially the only catalyst of cotinine and nicotine N-glucuronidation in smokers. This was not true for NNAL N-glucuronidation by these same smokers. The geometric mean proportion of the total NNAL excreted as NNAL-N-gluc for the 53 smokers with genetic score 2 was 0.206 and was not significantly lower than for smokers with genetic scores of 1 and 0 (P=0.512, Table 2). In contrast, the geometric mean of the proportion of cotinine glucuronide excreted by genetic score 2 smokers was 0.02.18 NNAL N-glucuronide was detected in individuals with a genetic score of 2, and was greater than 0.1 pmol/ml in 40 of these smokers. The concentration of NNAL-N-gluc ranged from <0.1 to 1.4 pmol/ml in these 40 smokers and accounted for 8 to 30% of the total NNAL excreted.
Table 2.
Geometric means of the proportion of NNAL excreted as glucuronide conjugates stratified by UGT2B10 genetic score, Study 1,the multiethnic cohort
| ALL* |
African Americans** |
|||||
|---|---|---|---|---|---|---|
| N | means | (95% CI) | N | means | (95% CI) | |
| NNAL total glucuronidation | ||||||
| genetic score = 0 | 1304 | 0.712 | ( 0.706– 0.717) | 109 | 0.739 | ( 0.722– 0.756) |
| genetic score=1 | 406 | 0.688 | ( 0.678– 0.697) | 146 | 0.724 | (0.709–0.738) |
| genetic score=2 | 53 | 0.689 | ( 0.637– 0.742) | 42 | 0.705 | ( 0.677– 0.732) |
| p-value | <.0001 | 0.0943 | ||||
| NNAL -N-glucuronidation | ||||||
| genetic score = 0 | 1304 | 0.215 | ( 0.209– 0.221) | 109 | 0.196 | ( 0.177–0.215) |
| genetic score=1 | 406 | 0.208 | ( 0.197– 0.218) | 146 | 0.202 | 0.185– 0.219) |
| genetic score=2 | 53 | 0.206 | (0.148– 0.265) | 42 | 0.188 | (0.157– 0.219) |
| p-value | 0.512 | 0.700 | ||||
The genetic score is based on the genotype for rs61750900 “risk” (variant) allele = T and for rs116294140 “risk” (variant) allele = C; score=0, rs61750900 GG and rs116294140 AA; score=1 rs61750900 GT or rs116294140 CA; and score=2 rs61750900 TT or rs116294140 CC, or both rs61750900 GT and rs116294140 CA.
adjusted for age, sex, BMI (natural log), TNE, and race
adjusted for age, sex, BMI (natural log) and TNE
Interestingly, NNAL total glucuronidation [(the sum of NNAL-N-gluc and NNAL-O-gluc)/total NNAL] was significantly lower in smokers with the UGT2B10 genetic score 2 compared to those with scores of 1 and 0 (Table 2, p<0.0001). However, the magnitude of the difference was quite small, smokers of genetic score 2 excreted 2.3% less NNAL as a glucuronide conjugate compared to smoker with genetic score 0. The proportion of total NNAL glucuronide was 0.712 for genetic score 0 and 0.689 for score 2. The majority of the smokers with score 2 were African American but the difference in total NNAL glucuronidation by genetic score was not significant within this group, although when the African American smokers of genetic scores 1 and 2 were combined and compared to those of genetic score 0 the p value approached significance (p= 0.06).
The significant levels of NNAL-N-gluc detected in the urine of smokers with no UGT2B10 activity (genetic score 2) led us to question the accuracy and specificity of the quantitation of this metabolite. NNAL-N-gluc was measured indirectly as the difference between the concentration of NNAL in urine before and after treatment with base. Base treatment of the sample will cleave the NNAL-N-gluc but not NNAL-O-gluc, but this treatment, unlike cleavage by β-glucuronidase, is not specific. A new LC-MS/MS based method that does not quantify NNAL-N-gluc as the difference in the NNAL concentration before and after hydrolysis was developed.
NNAL, NNAL-N-gluc and NNAL-O-gluc in smokers’ urine was separated into three fractions (Figure 1) using an anion exchange SPE column. NNAL-N-gluc was not retained on the column (or on any other SPE column tested when loaded in smokers’ urine) and was collected in the flow through and aqueous wash. NNAL was eluted with MeOH (fraction 2) and NNAL-O-gluc was eluted with 5% formic acid in MeOH (fraction 3). Ideally, one would quantify the intact glucuronides directly. However, due to the highly polar nature of the NNAL N-glucuronide, and despite significant effort, we were unable with any SPE column to separate this NNAL metabolite from the many equally polar compounds in urine which result in significant ion suppression during LC-MS/MS analysis. Therefore, we were unable to detect the NNAL-N-gluc conjugate in urine samples from a smoker at the pM concentrations required. It was possible to quantify the NNAL-N-gluc in a non-urine matrix at concentrations as low as 0.01pmol/ml, but the limit of quantification was more than 50 fold higher (and variable) when NNAL-N-glucuronide was added to urine (data not shown). To quantify NNAL-N-gluc, fraction 1 was treated with β-glucuronidase to release NNAL. Fraction 3, which contained NNAL-O-gluc was also treated with β-glucuronidase. The NNAL in each fraction was quantified with reference to the appropriate internal standard, [d3]-NNAL-N-gluc (fraction 1), [13C6]-NNAL (fraction 2) and, [d5]-NNAL-O-gluc (fraction 3). During the development of the method, the elution of each glucuronide in a fraction free from the other glucuronide or any unconjugated NNAL was confirmed.
LC-MS/MS chromatograms for each of the fractions are illustrated in Figure 2. The mass transitions displayed are characteristic for NNAL (panel A), d3-NNAL (panel B), d5-NNAL (panel C) and [13C6]-NNAL (panel D). In fraction 1 no d5-NNAL or [13C6]-NNAL is detected, therefore the NNAL present in this fraction (Panel A) was released from NNAL-N-gluc. The only internal standard detected in fraction 2 is [13C6]-NNAL, confirming the elution of unconjugated NNAL in this fraction. [The small peak in panel B that almost co-elutes with NNAL is present in the [13C6]-NNAL internal standard added]. Fraction 3 contained NNAL and d5-NNAL released from NNAL-O gluc and no d3-NNAL or [13C6]-NNAL.
There was not sufficient urine available to reanalyze the samples in Study 1 by this method. The method was used to quantify the concentrations of NNAL and its glucuronide conjugates in 24 hour urine from 106 smokers (52 African American and 54 white, Study 2). The urinary levels of TNE, and total NNAL for the African American smokers were not significantly different than the levels for white smokers (Table 3). However, the percentage of NNAL excreted as glucuronide conjugates by African Americans (64.0%) was slightly lower than the percentage excreted by whites (68.3%, p=0.05). The lower glucuronidation by African Americans is driven by decreased NNAL N-glucuronidation. The mean percentage of NNAL excreted as an N-gluc by African Americans was 14.0%, compared to 24.9% excreted by whites (p<0.00001). In contrast, the percentage of NNAL excreted as an O-glucuronide was greater in African Americans compared to whites (50.0% compared to 43.3%, p=0.013). Cotinine glucuronidation, which is a measure of UGT2B10 activity was significantly lower in African Americans compared to whites (Table 3, p<0.00001).
Table 3.
Mean Total Nicotine Equivalents, NNAL and the percentages of NNAL glucuronides in 24 h urine from African American and White smokers, Study 2*
| Glucuronides as percent of total NNAL |
||||||
|---|---|---|---|---|---|---|
| TNE (nmol/ml) | Total NNAL (pmol/ml) | both glucs | N-gluc | O-gluc | Cotinine glucuronidationb | |
| Whites (n=54) |
61.5 (35.3) | 1.17 (0.94) | 68.3(10.8) | 24.9(10.3) | 43.3(13.5) | 1.41(0.86) |
| African Americans (n=52) |
63.6 (39.9) | 1.14(0.60) | 64.0(11.3) | 14.0(10.8) | 50.0(13.7) | 0.783(1.40)* |
| p** | 0.773 | 0.873 | 0.05 | <0.00001 | 0.013 | <0.0001 |
Values are means (SD), cotinine glucuronidation is the ratio of cotinine glucuronide to cotinine
compared between groups using the two-sample t-test for unequal variances.
UGT2B10 genotypes for the Asp67Tyr and splice variants were determined for 103 of the subjects in Study 2, and each was assigned a genetic score as described above for Study 1. There was no difference in TNE, total NNAL or the total percentage of NNAL excreted as glucuronide conjugates across the three genetic scores (Table 4). The percentage of NNAL-N-gluc was significantly influenced by the UGT2B10 genetic score (p= 0.01, Table 4). The geometric mean of the percentage of NNAL (adjusted for race) excreted as an N-glucuronide was 22.5% in smokers with a genetic score of 0, 17.9% with a score of 1 and 11.2% with a score of 2. As the percentage of NNAL-N-gluc decreased the percentage of NNAL-O-gluc increased, but not significantly between genetic score 0 and score 2 (p=0.21). NNAL-N-gluc was detected in eight of the eleven smokers with genetic score 2 and ranged from 0.01 to 0.21 pmol/ml (supporting information, Table S1). The unadjusted arithmetic mean percent of NNAL-N-gluc excreted by the eleven smokers with genetic score 0 is 7% when the LOQ, 0.01pmol/ml is the value used for the smokers with no detectable NNAL-N-gluc, compared to 21% for smokers of genetic score 2.
Table 4.
Geometric means of NNAL glucuronides by UGT2B10 genetic score, Study 2
| Glucuronides as percent of total NNAL |
||||||
|---|---|---|---|---|---|---|
| UGT2B10 genetic score | TNE (nmol/ml) | Total NNAL (pmol/ml) | both glucuronides | N-gluc | O-gluc | Cotinine glucuronidationb |
|
0 (n=57) |
51.3 (42.8–61.5) |
0.98 (0.81–1.18) |
67.0 (63.9–70.1) |
22.6 (19.7–25.4) |
44.4 (40.6–48.2) |
1.19 (0.87–1.61) |
|
1 (n=35) |
55.5 (44.3–69.4) |
0.91 (0.72–1.15) |
66.2 (62.3–70.1) |
17.7 (14.2–21.3) |
48.5 (43.8– 3.1) |
0.53 (0.36–0.77) |
|
2 (n=11) |
49.4 (32.5–74.9) |
0.86 (0.55–1.34) |
63.0 (55.8–70.3) |
11.4 (4.8–17.9) |
51.7 (43.0–60.4) |
0.011 (0.006–0.023) |
| p-value | 0.81 | 0.85 | 0.63 | 0.01 | 0.27 | <0.0001 |
Values are means (95% CI), cotinine glucuronidation is the ratio of cotinine glucuronide to cotinine
The genetic score is based on carriers of the T or C variant for rs61750900 and rs116294140, respectively; score=0, rs61750900 GG and rs116294140 AA; score=1 rs61750900 GT or rs116294140 CA; and score=2 rs61750900 TT or rs116294140 CC, or both rs61750900 GT and rs116294140 CA.
Models adjusted for race/ethnicity and TNE.
Discussion
In the study presented here, we confirmed that UGT2B10 genotype contributes significantly to the amount of NNAL-N-gluc excreted by smokers. However, most smokers who express no functional UGT2B10 enzyme still excrete NNAL-N-gluc. In a relatively small study that quantified the NNAL-N-gluc in 24 h urine independently from the free NNAL and NNAL O-gluc, no significant difference was found in the total NNAL excreted or in the total percentage of NNAL excreted as glucuronide conjugates (the sum of NNAL-N-gluc and NNAL-O-gluc) by smokers with no active UGT2B10 enzyme compared to those who carried functional UGT2B10 (Table 4). In the larger multiethnic study of over 2000 smokers, individuals who carried neither the UGT2B10 slice variant nor the Asp67Tyr variant excreted a significantly higher proportion of NNAL as a glucuronide conjugate compared to homozygous carriers of these two variants, but the difference was quite small, 71.2% vs 68.9% (Table 2). Taken together these data lead us to conclude that despite the significant contribution of UGT2B10 to NNAL-N-glucuronidation, UGT2B10 genotype does not play a significant role in NNAL detoxication. Any decrease in NNAL N-glucuronidation appears to result in a parallel increase in NNAL O glucuronidation.
UGT2 B10 genotype has previously been shown to significantly influence the extent of NNAL- N-glucuronidation by smokers.11 In a study of ~180 white smokers, the urinary concentration of NNAL N-gluc was significantly lower for carriers of the UGT2B10 Asp 67Tyr variant. In that study, the four smokers homozygous for the Asp67Tyr variant excreted a mean of ~0.05 pmol/mg creatinine, therefore most of these smokers excreted no detectable NNAL-N-gluc. The authors reported this as a 95% reduction in N-glucuronidation, based on the comparison of average N-glucuronidation in smokers who carrier no Asp67Tyr variant to the “raw values” of NNAL-N-gluc. These values are not provided, but 5% of the mean NNAL-N-gluc levels in the study are well below the limit of detection (0.10 pmol/ml) and even further below the likely LOQ. The authors presented no LOQ for the detection of NNAL-N-gluc in smokers’ urine. The lowest concentration of NNAL N-gluc spiked into smoker’s urine in this study was 3 pmol/ml, which is ~5 times higher than the mean level of this glucuronide reported. Therefore, it is likely the reported 95% reduction of NNAL N-glucuronidation is an over estimation of the effect of UGT2B10 on this pathway of NNAL metabolism. The authors do not provide data on the effect of UGT2B10 genotype on total NNAL glucuronidation in the four smokers homozygous for the Asp 67Tyr variant. As noted above, in our studies any decrease in NNAL N-glucuronidation due to lower UGT2B10 activity appears to be balanced by an increase in NNAL O-glucuronidation.
In Study 2 presented here, we quantified NNAL-N-glucuronide in 8 of 11 smokers who express no functional UGT2B10 (genetic score 2). The LOQ for the analysis was 0.01pmol/ml, based on the addition of low levels of NNAL N-glucuronide to smokers’ urine. The urinary concentration of NNAL-N-gluc was > 0.1 pmol/ml for 4 of these smokers, three of whom were homozygous carriers of the splice variant and one was homozygous for the Asp76Tyr variant. Therefore, despite the importance of UGT2B10 as a catalyst of NNAL-N-glucuronidation, in some smokers another UGT, likely UGT1A4 contributes significantly to the N-glucuronidation of NNAL.
The proportions of NNAL excreted as an N-glucuronide by white smokers in the two studies presented here were similar, 21% in Study 1 and 25% in Study 2. These values agree well with the 23% NNAL N-glucuronidation reported for the study by Chen et al. described above.11 In Study 1, which quantified NNAL-N-gluc as the difference in the urinary concentration of NNAL before and after treatment with base, we did not detect a difference in NNAL-N-glucuronide between African American and white smokers. However, in the second study, using a newly developed high mass accuracy MS/MS-based method, which quantified NNAL-N-gluc, NNAL-O-gluc and NNAL independently in a single urine sample, we observed significantly lower NNAL N-glucuronidation by African Americans compared to whites.
Our inability to detect a difference in N-glucuronidation between African American and whites in the first study may be due to the challenge of accurately quantifying NNAL-N-gluc as a relatively small difference between two values. The interday precision (CV) for the analysis of 0.3 pmol/ml NNAL-N-gluc in a smoker’s urine sample by this method was 14%.24 The percent CV was likely higher for the lower urinary concentration of NNAL-N-gluc expected in many African American smokers, due to the prevalence of the UGT2B10 slice variant. Consistent with this conclusion, in study 1, we did not detect a significant difference in NNAL N-glucuronidation between smokers who expressed no functional UGT2B10 and those who did. Whereas, in study 2, when the high mass accuracy MS/MS-based method was used NNAL N-glucuronidation levels varied significantly with UGT2B10 genotype.
A large study of over 3000 smokers reported lower levels of total NNAL-glucuronidation (the sum of N- and O-glucuronidation) by African Americans compared to whites.25 In Study 2 reported here total NNAL glucuronidation was also lower in African Americans compared to whites. However, no difference was observed in Study 1 (from the MEC) either here or previously in the same, slightly expanded subset of this cohort.5 Urine samples from the MEC subjects were overnight or first morning urine samples, whereas the urine samples in Study 2 as well as the prior study of 3000 smokers were from 24 h collections. There is no data on the pharmacokinetics of NNAL glucuronide excretion, but given the polar nature of these molecules the half-life is expected to be much shorter than for NNAL. The different urine collection times might contribute to this discrepancy if the pharmacokinetic parameters of NNAL and its glucuronide conjugates differ. Although whatever the reason for the inconsistent outcomes among these studies, the observed difference in total glucuronidation between these two ethnic groups is relatively small.
Smokers who carry UGT2B10 variants (i.e. for rs61750900, allele ‘T’ and for rs116294140 allele ‘C’) that result in no expression of functional enzyme clearly excrete lower levels of NNAL N-gluc, but even in these individuals (all of whom were African American in Study 2) the effect on total glucuronidation of NNAL is small. The observed lower NNAL N-glucuronidation by African American smokers in Study 2 and the lower total NNAL glucuronidation reported here and in prior studies are likely due to the relatively high prevalence of the UGT2B10 splice variant in African Americans.19, 23 However, the magnitude of the effect of UGT2B10 genotype on total NNAL glucuronidation is small, likely due in part to the contribution of UGT1A4 to NNAL N-glucuronidation, but more importantly to the increase in NNAL-O-glucuronidation by many of these smokers. For the vast majority of smokers O-glucuronidation is the major pathway of NNAL glucuronidation, accounting for on average approximately 70% of total glucuronidation. Therefore, despite the prevalence of low NNAL N-glucuronidation among African American smokers, it does not appear likely that this small decrease in total NNAL detoxication contributes to the higher risk of lung cancer for African American compared to Whites. It is more likely that a major contributor to this difference in risk is the higher TNE levels we have reported in African American compared to White smokers who report smoking similar CPD 18.
Supplementary Material
Acknowledgments
Funding Sources.
This study was supported by NCI grant P01 CA-138338. The LC/MS/MS analysis was carried out in the Analytical Biochemistry Core of the University of Minnesota Cancer Center supported in part by NCI P30 CA-077598. Genotyping for the Study 2 was performed at the University of Hawaii Cancer Center Genomics Shared Resource, supported by NCI CCSG grant P30 CA-071789.
Abbreviations
- TNE
total nicotine equivalents
- NNAL-N-gluc
NNAL-N-glucuronide
- NNAL-O-gluc
NNAL–O-glucuronide
- MEC
multiethnic cohort
References
- (1).Torre LA, Bray F, Siegel RL, Ferlay J, Lortet-Tieulent J, and Jemal A (2015) Global cancer statistics, 2012. CA Cancer J. Clin 65, 87–108. [DOI] [PubMed] [Google Scholar]
- (2).Siegel RL, Miller KD, and Jemal A (2016) Cancer statistics, 2016. CA: A Cancer Journal for Clinicians 66, 7–30. [DOI] [PubMed] [Google Scholar]
- (3).Hecht SS (2012) Lung carcinogenesis by tobacco smoke. International Journal of Cancer 131, 2724–2732. [DOI] [PMC free article] [PubMed] [Google Scholar]
- (4).Haiman CA, Stram DO, Wilkens LR, Pike MC, Kolonel LN, Henderson BE, and Le Marchand L (2006) Ethnic and racial differences in the smoking-related risk of lung cancer. N. Engl. J. Med 354, 333–342. [DOI] [PubMed] [Google Scholar]
- (5).Park SL, Carmella SG, Ming X, Vielguth E, Stram DO, Le Marchand L, and Hecht SS (2015) Variation in levels of the lung carcinogen NNAL and its glucuronides in the urine of cigarette smokers from five ethnic groups with differing risks for lung cancer. Cancer Epidemiol Biomarkers Prev 24, 561–569. [DOI] [PMC free article] [PubMed] [Google Scholar]
- (6).Perez-Stable EJ, Herrera B, Jacob P III, and Benowitz NL (1998) Nicotine metabolism and intake in black and white smokers. JAMA 280, 152–156. [DOI] [PubMed] [Google Scholar]
- (7).Cancer, I. A. f. R. o. (2007) Smokeless tobacco and some tobacco-specific nitrosamines, In IARC Monographs on the Evaluation of Carcinogenic Risks to Humans, , IARC, Lyon, FR. [PMC free article] [PubMed] [Google Scholar]
- (8).Jalas JR, Hecht SS, and Murphy SE (2005) Cytochrome P450 enzymes as catalysts of metabolism of 4-(methylnitrosamino)-1-(3-pyridyl)-1-butanone (NNK), a tobacco-specific carcinogen. Chemical Research in Toxicology 18, 95–110. [DOI] [PubMed] [Google Scholar]
- (9).Ren Q, Murphy SE, Zheng Z, and Lazarus P (2000) O-Glucuronidation of the lung carcinogen 4-(methylnitrosamino)-1-(3-pyridyl)-1-butanol (NNAL) by human UDP-glucuronosyltransferases 2B7 and 1A9. Drug Metab. Dispos 28, 1352–1360. [PubMed] [Google Scholar]
- (10).Lazarus P, Zheng Y, Aaron RE, Muscat JE, and Wiener D (2005) Genotype-phenotype correlation between the polymorphic UGT2B17 gene deletion and NNAL glucuronidation activities in human liver microsomes. Pharmacogenet. Genomics 15, 769–778. [DOI] [PubMed] [Google Scholar]
- (11).Chen G, Luo S, Kozlovich S, and Lazarus P (2016) Association between Glucuronidation Genotypes and Urinary NNAL Metabolic Phenotypes in Smokers. Cancer Epidemiol Biomarkers Prev 25, 1175–1184. [DOI] [PMC free article] [PubMed] [Google Scholar]
- (12).Wiener D, Doerge DR, Fang JL, Upadhyaya P, and Lazarus P (2004) Characterization of N-glucuronidation of the lung carcinogen 4-(methylnitrosamino)-1-(3-pyridyl)-1-butanol (NNAL) in human liver: importance of UDP-glucuronosyltransferase 1A4. Drug Metab Dispos 32, 72–79. [DOI] [PubMed] [Google Scholar]
- (13).Chen G, Dellinger RW, Sun D, Spratt TE, and Lazarus P (2008) Glucuronidation of tobacco-specific nitrosamines by UGT2B10. Drug Metab. Dispos 36, 824–830. [DOI] [PMC free article] [PubMed] [Google Scholar]
- (14).Chen G, Blevins-Primeau AS, Dellinger RW, Muscat JE, and Lazarus P (2007) Glucuronidation of nicotine and cotinine by UGT2B10: loss of function by the UGT2B10 Codon 67 (Asp>Tyr) polymorphism. Cancer Res 67, 9024–9029. [DOI] [PubMed] [Google Scholar]
- (15).Kaivosaari S, Toivonen P, Hesse LM, Koskinen M, MH C, and Finel M (2007) Nicotine Glucuronidation and the Human UDP-Glucuronosyltransferase UGT2B10. Mol. Pharmacol 72, 761–768. [DOI] [PubMed] [Google Scholar]
- (16).Kuehl GE, and Murphy SE (2003) N-Glucuronidation of Nicotine and Cotinine by human liver microsomes and Heterologously-Expressed UDP-glucuronosyltransferases. Drug Metab. Dispos 31, 1361–1368. [DOI] [PubMed] [Google Scholar]
- (17).Berg JZ, von Weymarn LB, Thompson ET, Wickham KM, Weisensel NA, Hatsukami DK, and Murphy SE (2010) UGT2B10 genotype influences nicotine glucuronidation, oxidation and consumption. Cancer Epidemiol Biomarkers Prev 19, 1423–1431. [DOI] [PMC free article] [PubMed] [Google Scholar]
- (18).Murphy SE, Park SS, Thompson EF, Wilkens LR, Patel Y, Stram DO, and Le Marchand L (2014) Nicotine N-glucuronidation relative to N-oxidation and C-oxidation and UGT2B10 genotype in five ethnic/racial groups. Carcinogenesis 35, 2526–2533. [DOI] [PMC free article] [PubMed] [Google Scholar]
- (19).Fowler S, Kletzl H, Finel M, Manevski N, Schmid P, Tuerck D, Norcross RD, Hoener MC, Spleiss O, and Iglesias VA (2015) A UGT2B10 splicing polymorphism common in african populations may greatly increase drug exposure. J. Pharmacol. Exp. Ther 352, 358–367. [DOI] [PubMed] [Google Scholar]
- (20).Genomes Project, C., Abecasis GR, Altshuler D, Auton A, Brooks LD, Durbin RM, Gibbs RA, Hurles ME, and McVean GA (2010) A map of human genome variation from population-scale sequencing. Nature 467, 1061–1073. [DOI] [PMC free article] [PubMed] [Google Scholar]
- (21).Murphy SE, Sipe CK, Choi K, Raddatz LM, Koopmeiners JS, Hatsukami DK, and Donny EC (2017) Low cotinine gluronidation results in higher serum and saliva cotinine in African American compared to White smokers. Cancer Epidemiol. Biomarkers & Prev in press. [DOI] [PMC free article] [PubMed] [Google Scholar]
- (22).Kolonel LN, Henderson BE, Hankin JH, Nomura AM, Wilkens LR, Pike MC, Stram DO, Monroe KR, Earle ME, and Nagamine FS (2000) A multiethnic cohort in Hawaii and Los Angeles: baseline characteristics. Am. J. Epidemiol 151, 346–357. [DOI] [PMC free article] [PubMed] [Google Scholar]
- (23).Patel YM, Stram DO, Wilkens LR, Park SS, Henderson BE, Le Marchand L, Haiman CA, and Murphy SE (2015) The contribution of common genetic variation to nicotine and cotinine glucuronidation in multiple ethnic/racial populations. Cancer Epidemiol Biomarkers Prev 24, 119–127. [DOI] [PMC free article] [PubMed] [Google Scholar]
- (24).Carmella SG, Ming X, Olvera N, Brookmeyer C, Yoder A, and Hecht SS (2013) High throughput liquid and gas chromatography-tandem mass spectrometry assays for tobacco-specific nitrosamine and polycyclic aromatic hydrocarbon metabolites associated with lung cancer in smokers. Chem Res Toxicol 26, 1209–1217. [DOI] [PMC free article] [PubMed] [Google Scholar]
- (25).Sarkar M, Wang J, and Liang Q (2012) Metabolism of nicotine and 4-(methylnitrosamino)-l-(3-pyridyl)-lbutanone (NNK) in menthol and non-menthol cigarette smokers. Drug Metab Lett 6, 198–206. [DOI] [PubMed] [Google Scholar]
Associated Data
This section collects any data citations, data availability statements, or supplementary materials included in this article.