Abstract
Fluorine-18 fluorodeoxyglucose positron emission tomography with computed tomography attenuation correction (PET-CT) in myeloma can detect and enumerate focal lesions by the quantitative characterization of metabolic activity. The aim of this study was to determine the prognostic significance of the suppression of PET-CT activity at a number of time points post therapy initiation: day 7, post induction, post transplant, and at maintenance therapy. As part of the TT4-6 trial series, 596 patients underwent baseline PET-CT and were evaluated serially during their disease course using peak standardized uptake values above background red marrow signal. We demonstrate that the presence of more than 3 focal lesions at presentation identifies a group of patients with an adverse progression-free survival and overall survival. At day 7 of therapy, patients with complete focal lesion signal suppression revert to the same prognosis as those with no lesions at diagnosis. At later time points, the continued suppression of signal remains prognostically important. We conclude that for newly diagnosed patients with focal lesions, treatment until these lesions are suppressed is an important therapeutic goal as the prognosis of these patients is the same as those without lesions at diagnosis. (clinicaltrials.gov identifiers: 00734877, 02128230, 00869232, 00871013).
Introduction
A key strategy to improve outcomes in myeloma is to customize the treatment used based on the response to therapy. Such an approach is becoming increasingly feasible as the range of treatment options with different mechanisms of action increases. The number of tools available to monitor response to therapy is also increasing, with minimal residual disease (MRD) assessment of the bone marrow (BM) using flow cytometry and next generation sequencing being the most widely used.1,2 Imaging techniques such as magnetic resonance imaging (MRI) and fluorine-18 fluorodeoxyglucose positron emission tomography with computed tomography (FDG PET-CT) have also been used as a method to assess the extent and distribution of disease at presentation and pre and post autologous transplant.3–10 These two imaging approaches rely on different biological features of the tumor and as such offer important complementary information. Both technologies identify focal lesions (FLs), which are anatomical lesions seen during myeloma progression from monoclonal gammopathy of uncertain significance (MGUS) to plasma cell leukemia (PCL). They are more characteristic of the later stages of disease and are associated with adverse prognosis. However, in contrast to PET-CT, where the imaging features respond rapidly to exposure to therapy, classic MRI features are slow to resolve and can remain positive long term. Therefore, PET-CT is a useful monitoring tool for disease response.
Previously we have evaluated the role of PET-CT at presentation and have demonstrated that it can refine the assessment of prognosis, with both the number and size of FLs giving clinically useful prognostic information.3–7 We have also shown that total lesion glycolysis (TLG), a calculation that takes into account total disease volume and glucose metabolism, can improve the assessment of disease burden and outcome prediction.11 In order to further determine the value of PET-CT for disease monitoring and prognosis, we have utilized data collected in the TT4-TT6 clinical trials of our Total Therapy program,12,13 where PET-CT assessment was included both at presentation and during response as part of the clinical protocol. In a preliminary analysis, we also explored the potential for PET-CT analysis to enhance the value of conventional response assessment and MRD flow cytometry assessment.
Methods
Patients
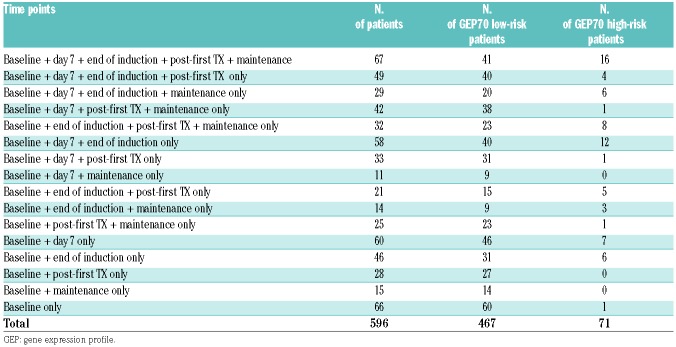
Of the 606 patients entered into the TT4-6 studies, 596 patients had PET-CT analysis available and were included in this study. Treatment included combination chemotherapy as induction with double autologous transplantation, post-transplant consolidation, and three years planned maintenance with lenalidomide, bortezomib, and dexamethasone.12,13 Protocols were approved by the Institutional Review Board of the University of Arkansas for Medical Sciences. All patients signed informed consent in keeping with institutional, federal, and international guidelines. Gene expression analysis and risk status (GEP70) were determined.14,15 The number of patients for analysis at each landmark is shown in Table 1. The most common reason for a missing PET-CT was lack of health insurance to cover the costs of the test. The 3-year survival estimates with corresponding 95% confidence intervals were 68% (65, 72) for progression-free survival (PFS) and 82% (78, 85) for overall survival (OS). Median follow up was 5.1 years (Table 2).
Table 1.
Positron emission tomography with computed tomography sample availability of cases entered into the TT4-6 studies at the different timepoints of assessment. Note that some patients did not have GEP data available and therefore could not be classified by GEP70 risk.
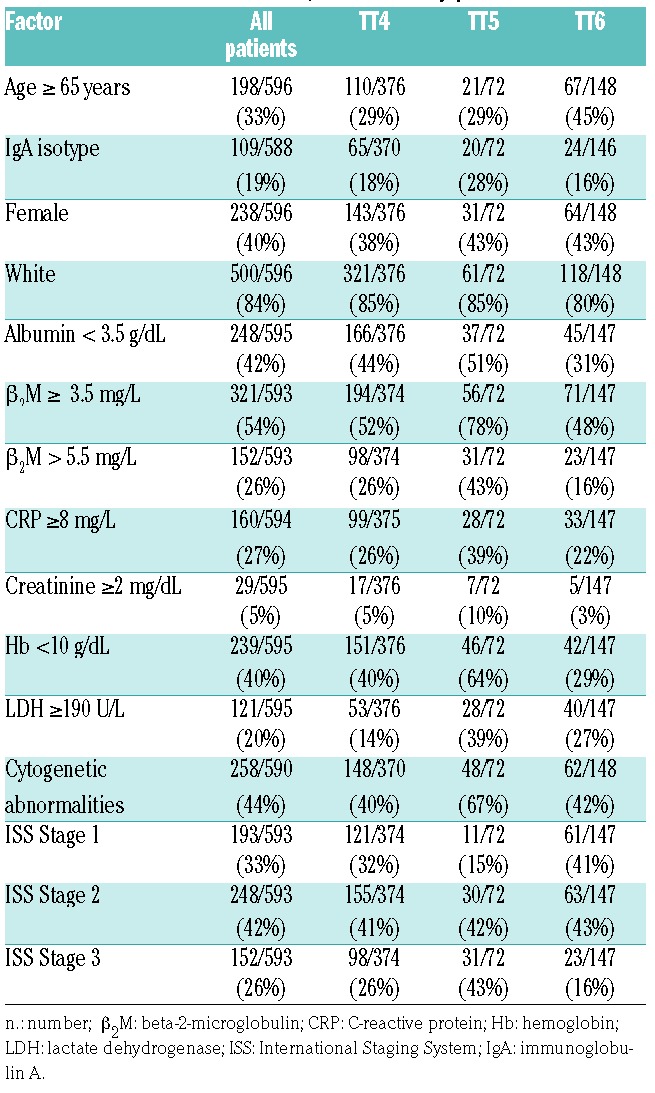
Table 2.
Patients’ characteristics, overall and by protocol.
PET-CT
Scans were performed using a standard clinical protocol following 6–8 hours of fasting and after intravenous administration of 10–15mCi (370–555Mbq) of fluorodeoxyglucose (FDG). After 50–70 minutes of uptake, images were acquired on either a CTI-Reveal or a Biograph 6 PET/CT system (Siemens Medical Systems), both with full ring LSO crystal configurations. PET images were generated by 3D iterative reconstruction on a 168×168 matrix, with a zoom of 1.0 FWHM filter of either 5.0 or 6.0 mm, and 2 iterations with 8 subsets. CT data were used for localization and attenuation correction. Images underwent a 3D region of interest (ROI) analysis of the axial and appendicular skeleton using the US Food and Drug Administration approved “Mirada Medical PET-CT XD Oncology Review” software (Oxford, UK). Background red marrow was defined using a 1 cm3 ROI in the most inferior vertebral body that did not demonstrate focally increased uptake. FLs were defined as areas, measuring at least 1 cm, not otherwise demonstrated to be artefacts by comparison with co-registered CT and exhibiting a peak SUV greater than the peak SUV for the background red marrow. Radiologists used a standardized approach for reporting. All data for analysis were extracted from clinical reports.
Response assessment
Clinical response assessment was performed using International Myeloma Working Group (IMWG) definitions.1 Minimal residual disease assessment was performed on BMs using an 8-color technique (CD138/CD38/CD19/CD45/CD27/CD81/CD56/CD20). A minimum of 2 million cells were analyzed, giving a sensitivity of 1 in 105.
Statistical analysis
The Kaplan-Meier method16 was used to estimate OS and PFS distributions. Cumulative incidences by GEP70 risk for complete response (CR), very good partial response (VGPR) and partial response (PR) were calculated.17 Group comparisons (overall and pairwise) for survival end points and cumulative incidence were performed using the log-rank test.18 Cox proportional hazards modeling was used to identify the association of risk factors with outcome. OS was defined as time from landmark to death from any cause. PFS was calculated as time from landmark to progression, relapse, or death from any cause. Patients experiencing none of these events were censored at the date of last contact. Fisher’s exact test was used to evaluate the association between categorical variables. P<0.05 was considered statistically significant. Cutoff points for FL parameters were applied as previously reported.6
Results
PET-CT at presentation and outcome
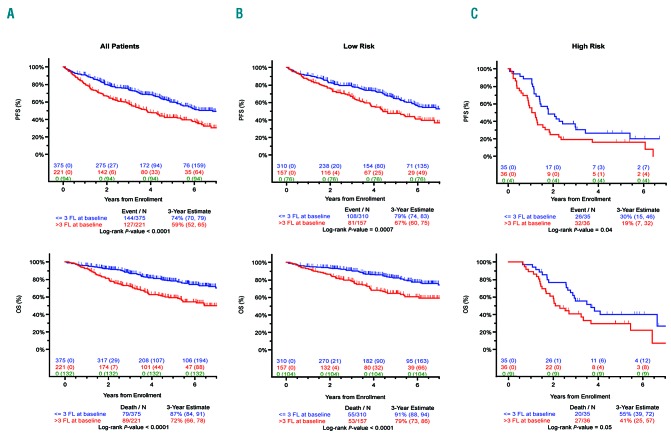
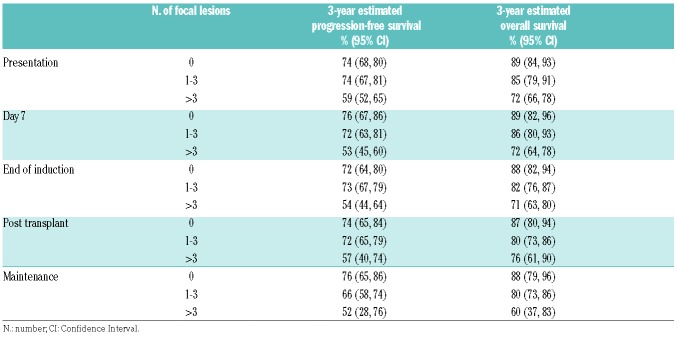
The presence of more than 3 FLs detected on PET-CT scan at baseline was associated with adverse PFS (P<0.0001) and OS (P<0.0001) (Figure 1). There was no significant difference in either PFS (P=0.3022) or OS (P=0.7842) between the patient groups with 0 and with 1–3 FLs (Table 3 and Online Supplementary Figure S1).
Figure 1.
Survival data according to number of focal lesions (FLs). Progression-free survival (PFS) (upper panel) and overall survival (OS) (lower panel) for patients entered into TT4-6 trials by the number of FL detected at presentation: (A) all patients, (B) GEP70 low-risk patients, and (C) GEP70 high-risk patients. A significant difference was observed for patients with FLs at baseline compared to patients with no FL at baseline for both PFS (P<0.0001) and OS (P<0.0001). These differences were significant when considering separately GEP70 low-risk patients (P=0.0007 for PFS, P<0.0001 for OS) and GEP70 high-risk patients (P=0.04 for PFS, P=0.05 for OS).
Table 3.
Progression-free and overall survival estimates at each positron emission tomography with computed tomography time point according to the number of focal lesions.
Suppression of FL signal at serial time points and its relationship to outcome
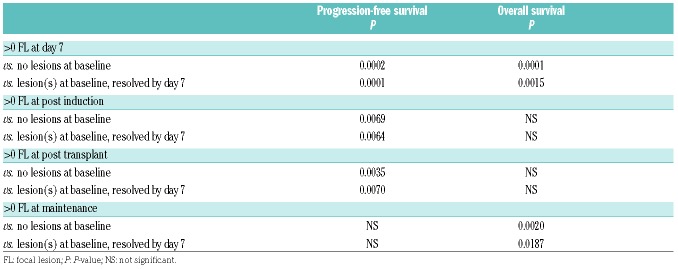
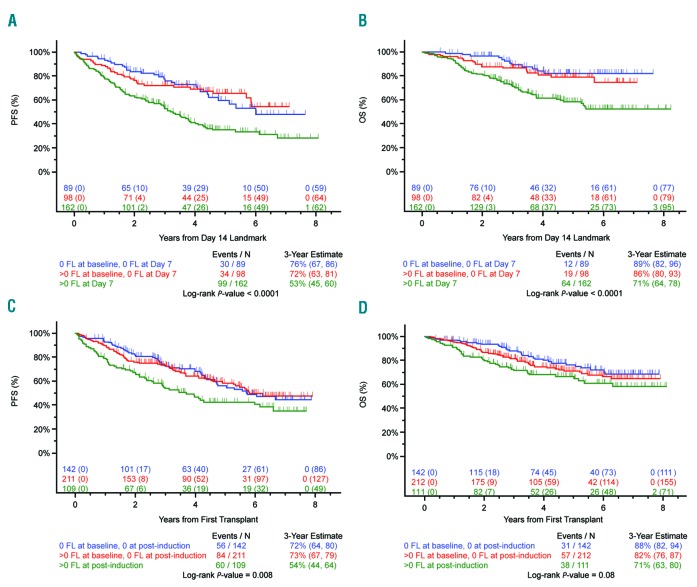
We show that the suppression of FL signal following treatment is prognostically important. Patients achieving 100% suppression of FL signal following treatment at each time point studied (day 7, end of induction, post transplantation, and maintenance) have PFS and OS values that are not significantly different from cases with no FL present at baseline. Importantly, at each time point, patients with no detectable FL signal at that time point have a significantly superior outcome compared to patients with at least one detectable FL at that time point, irrespective of whether they had a FL at baseline (Table 4, Figure 2 and Online Supplementary Figure S2). Conversely, failure to suppress the FL signal (i.e. continued positivity) was seen in 46.4% of patients at day 7, 23.6% at the end of induction, 11.4% post transplantation, and 7.3% at maintenance, and was associated with an impaired outcome.
Table 4.
P-value for progression-free and overall survival estimates for patients with and without lesions at each positron emission tomography with computed tomography time point.
Figure 2.
Paired day 1, 7, and end of induction positron emission tomography with computed tomography (PET-CT). (A) Progression-free survival (PFS) and (B) overall survival (OS) for patients entered into TT4-6 trials with paired day 1 and day 7 PET-CT studies. An overall difference in PFS and OS was noted. A significant difference was observed for patients with no focal lesion(s) (FL) at baseline and no FL at day 7 compared to those with lesions present at day 7 in PFS (P=0.0002) and OS (P<0.0001). A significant difference was observed for patients with resolution of FL at day 7 compared to those with lesions present at day 7 in PFS (P=0.0001) and OS (P=0.0015). (C) PFS and (D) OS for patients entered into TT4-6 trials with paired day 1 and end of induction PET-CT studies. A significant difference was observed in PFS for patients with no FL at baseline and no FL at the end of induction compared to those with FL (P=0.0069). A significant difference was observed in PFS for patients with resolution of FL at this time point compared to those still with lesions (P=0.0064).
Interaction of GEP70 risk status with PET-CT signal suppression and outcome
At presentation, 33.6% of GEP70 low-risk (LR) patients had more than 3 FLs and were associated with an adverse outcome (P=0.007 for PFS and P<0.001 for OS). A higher percentage of patients with FLs was seen in the GEP70 high-risk (HR) group at presentation (50.7%), and these cases also had an adverse outcome (P=0.04 for PFS and P=0.05 for OS) (Figure 1, Online Supplementary Table S1 and Online Supplementary Figure S3).
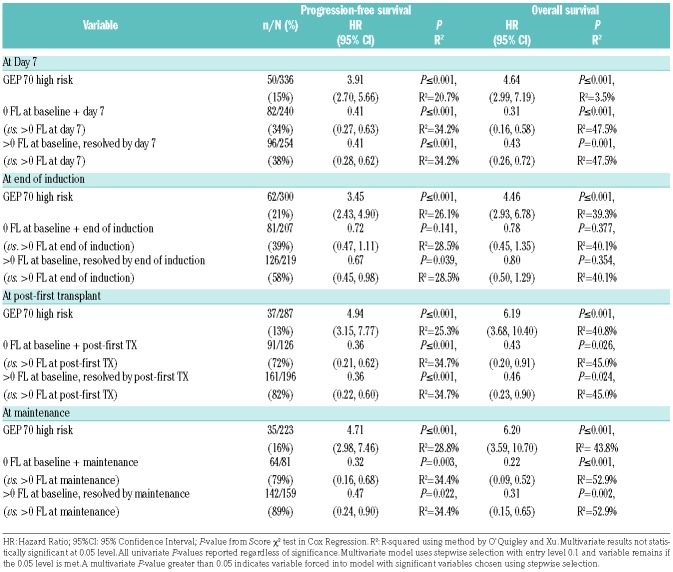
Following treatment, the suppression of FL signal had a similar impact in both risk strata with total suppression of signal being associated with outcomes that are not significantly different from cases with no FLs at baseline. For LR patients, this was significant at all time points analyzed. In contrast, the differences in outcome were not as obvious in HR patients due to the smaller number of cases and their adverse outcomes irrespective of FL status at baseline. Nonetheless, we observed a significant difference in OS and PFS between patients with no FL at baseline and day 7 compared to patients with at least one FL at day 7, and we observed a non-significant trend in OS and PFS between patients with suppression of baseline FL by day 7 compared to patients with at least one FL at day 7 (Online Supplementary Table S1 and Online Supplementary Figures S4 and S5). Multivariate analysis and R2 values suggest that both GEP and persistent FL positivity contribute to clinical outcome both at presentation and at subsequent time points, with presence of FLs making a very significant contribution to outcome (Table 5).
Table 5.
Multivariate analyses of progression-free and overall survival.
Relationship between imaging response and minimal residual disease
To address how imaging response relates to BM MRD, we looked at cases who had achieved a standard CR (as defined by the IMWG criteria) and had MRD assessment at the level of 1 in 104 performed by flow cytometry analysis. We identified 13 cases with 1 or more FLs at the time of MRD assessment; of these, 8 were MRD positive and 5 were MRD negative. This distribution of MRD was not significantly different from the distribution in cases with 0 FL (55 positive and 37 negative) (Fisher’s exact test P=0.90). This observation highlights the importance of combining imaging with MRD assessment.
Discussion
We demonstrate in a large statistically robust data set that the serial use of PET-CT assessment can contribute to risk assessment and the prediction of outcome. We show that 62% of patients have PET-CT detectable FLs at diagnosis with a greater percentage in HR compared to LR patients. We show that, following modern day therapy, the signal from FLs can be suppressed and that this is associated with improved outcomes. Even at the very early time point of 7 days post chemotherapy, the continuing presence of PET positivity is associated with an adverse outcome. The prognostic significance of ongoing FL positivity is maintained post one cycle of chemotherapy, post induction therapy, post transplantation, and during maintenance. Importantly, in the context of induction, transplant and maintenance, the 28% of patients who suppress PET-CT FL activity by day 7 or by the end of induction (46%) have a similar outcome to patients who had no FLs at diagnosis. These novel findings are clinically informative because they shift the emphasis of PET-CT assessment of FLs from a one-time diagnostic scan to a scenario where follow-up scanning is important to interpret the true prognostic significance of these lesions for the individual patient in the context of the therapy used and the biology of their cancer cells.
The current results expand on previous data analyses which have shown the value of the presence of FLs on PET-CT at diagnosis in MGUS, smoldering myeloma, and myeloma.3,5–7,11,19–21 In myeloma, the number of lesions, maximum standardized uptake values (SUVmax), TLG, and metabolic tumor volume have all been shown to correlate with PFS and OS.3–8,11 In the current study, based on the analysis of 596 patients entered into TT4-TT6 clinical studies, we confirm these findings and show convincingly that the presence of more than 3 focal lesions detected on PET-CT at baseline is associated with adverse PFS and OS.
We also clarify how such scanning technology should be used following the initiation of therapy.3–5,8 The Italian group used SUVmax as the marker of PET-CT positivity after induction treatment with bortezomib, thalidomide, and dexamethasone followed by autologous tandem transplant, and showed that 63% of patients who were PET-CT positive at diagnosis were still PET-CT positive at the end of induction therapy, and that this was linked with adverse clinical outcome.8 At three months post transplantation, positivity was seen in 35%, and again was associated with an adverse outcome. The Intergroup Francophone du Myelome (IFM) group4 used a combination of FLs and/or diffuse marrow signal to define PET-CT positivity. In their study, 68% of patients remained positive at the end of lenalidomide, bortezomib, and dexamethasone (RVD) induction, 42% after RVD consolidation and 25% after transplantation, with positivity being associated with an adverse outcome. In the TT3 study,5 the number of PET-FLs both at diagnosis and pre-transplant were important independent variables associated with adverse outcome.5 On multivariate analysis, more than 3 FLs at day 7 was associated with inferior OS and PFS, even in patients with GEP70 defined high risk. However, in TT3, we did not report the outcome of patients who suppressed their FL activity. The finding that these patients have outcomes similar to patients without FLs at diagnosis is of crucial clinical importance and suggests that treatment should be continued until lesion resolution.
Previous studies have shown that patients with a conventionally defined complete response using IMWG criteria may have persistence of the FLs after therapy.8,22 Such findings have led to the refinement of the IMWG definitions of complete response with the addition of assessment of MRD using flow cytometry, next generation sequencing, and imaging.2 Using an effective therapeutic strategy combining immunomodulatory drugs, proteasome inhibitors, and transplant, we were able to demonstrate that imaging gives additional information to both the clinical assessment of response using the IMWG criteria and also to MRD detection using a flow cytometric approach sensitive to 1 in 10−5. The recent study by the IFM group4 showed similar findings with 14 of 86 patients being PET-CT positive at the same time as they were MRD negative, suggesting that both techniques are essential to truly define a stringent response.
In other tumor settings, a PET-CT scan during therapy is used to guide treatment decisions, including continuing therapy, changing therapy to a modality with a different mechanism of action, or stopping treatment altogether. Initiating the individualization of therapy in myeloma based on a comprehensive disease assessment is one way to improve patient outcomes. This study suggests that a risk-adapted approach based on serial PET-CT analysis would be appropriate for myeloma patients as it can reliably identify a group of patients with poor prognosis at different stages of their therapy who may benefit from alternative therapy. On the basis of our results, serial PET-CT should be integrated into follow-up algorithms and risk-adapted clinical trials should be implemented.
Supplementary Material
Footnotes
Check the online version for the most updated information on this article, online supplements, and information on authorship & disclosures: www.haematologica.org/content/103/6/1047
References
- 1.Rajkumar SV, Dimopoulos MA, Palumbo A, et al. International Myeloma Working Group updated criteria for the diagnosis of multiple myeloma. Lancet Oncol. 2014;15(12):e538–548. [DOI] [PubMed] [Google Scholar]
- 2.Kumar S, Paiva B, Anderson KC, et al. International Myeloma Working Group consensus criteria for response and minimal residual disease assessment in multiple myeloma. Lancet Oncol. 2016;17(8):e328–346. [DOI] [PubMed] [Google Scholar]
- 3.Usmani SZ, Mitchell A, Waheed S, et al. Prognostic implications of serial 18-fluorodeoxyglucose emission tomography in multiple myeloma treated with total therapy 3. Blood. 2013;121(10):1819–1823. [DOI] [PMC free article] [PubMed] [Google Scholar]
- 4.Moreau P, Attal M, Caillot D, et al. Prospective evaluation of magnetic resonance imaging and [18F]fluorodeoxyglucose positron emission tomography-computed tomography at diagnosis and before maintenance therapy in symptomatic patients with multiple myeloma included in the IFM/DFCI 2009 trial: results of the IMAJEM study. J Clin Oncol. 2017;35(25):2911–2918. [DOI] [PMC free article] [PubMed] [Google Scholar]
- 5.Bartel TB, Haessler J, Brown TL, et al. F18-fluorodeoxyglucose positron emission tomography in the context of other imaging techniques and prognostic factors in multiple myeloma. Blood. 2009; 114(10):2068–2076. [DOI] [PMC free article] [PubMed] [Google Scholar]
- 6.Waheed S, Mitchell A, Usmani S, et al. Standard and novel imaging methods for multiple myeloma: correlates with prognostic laboratory variables including gene expression profiling data. Haematologica. 2013;98(1):71–78. [DOI] [PMC free article] [PubMed] [Google Scholar]
- 7.Rasche L, Angtuaco E, McDonald JE, et al. Low expression of hexokinase-2 is associated with false-negative FDG-positron emission tomography in multiple myeloma. Blood. 2017;130(1):30–34. [DOI] [PMC free article] [PubMed] [Google Scholar]
- 8.Zamagni E, Patriarca F, Nanni C, et al. Prognostic relevance of 18-F FDG PET/CT in newly diagnosed multiple myeloma patients treated with up-front autologous transplantation. Blood. 2011;118(23):5989–5995. [DOI] [PubMed] [Google Scholar]
- 9.Hillengass J, Fechtner K, Weber MA, et al. Prognostic significance of focal lesions in whole-body magnetic resonance imaging in patients with asymptomatic multiple myeloma. J Clin Oncol. 2010;28(9):1606–1610. [DOI] [PubMed] [Google Scholar]
- 10.Walker R, Barlogie B, Haessler J, et al. Magnetic resonance imaging in multiple myeloma: diagnostic and clinical implications. J Clin Oncol. 2007;25(9):1121–1128. [DOI] [PubMed] [Google Scholar]
- 11.McDonald JE, Kessler MM, Gardner MW, et al. Assessment of total lesion glycolysis by 18F FDG PET/CT significantly improves prognostic value of GEP and ISS in myeloma. Clin Cancer Res. 2017;23(8):1981–1987. [DOI] [PMC free article] [PubMed] [Google Scholar]
- 12.Jethava Y, Mitchell A, Epstein J, et al. Adverse metaphase cytogenetics can be overcome by adding bortezomib and thalidomide to fractionated melphalan transplants. Clin Cancer Res. 2017;23(11):2665–2672. [DOI] [PMC free article] [PubMed] [Google Scholar]
- 13.Jethava Y, Mitchell A, Zangari M, et al. Dose-dense and less dose-intense Total Therapy 5 for gene expression profiling-defined high-risk multiple myeloma. Blood Cancer J. 2016;6(7):e453. [DOI] [PMC free article] [PubMed] [Google Scholar]
- 14.Nair B, van Rhee F, Shaughnessy JD, Jr, et al. Superior results of Total Therapy 3 (2003–33) in gene expression profiling-defined low-risk multiple myeloma confirmed in subsequent trial 2006–66 with VRD main tenance. Blood. 2010; 115(21):4168–4173. [DOI] [PMC free article] [PubMed] [Google Scholar]
- 15.Shaughnessy JD, Qu P, Tian E, et al. Outcome with total therapy 3 (TT3) compared to total therapy 2 (TT2): Role of GEP70-defined high-risk disease with trisomy of 1q21 and activation of the proteasome gene PSMD4. J Clin Oncol. 2010;28:15s (suppl; abstr 8027). [Google Scholar]
- 16.Kaplan EL, Meier P. Nonparametric-estimation from incomplete observations. J Am Stat Assoc. 1958;53(282):457–481. [Google Scholar]
- 17.Gooley TA, Leisenring W, Crowley J, Storer BE. Estimation of failure probabilities in the presence of competing risks: new representations of old estimators. Stat Med. 1999;18(6):695–706. [DOI] [PubMed] [Google Scholar]
- 18.Mantel N. Evaluation of survival data and two new rank order statistics arising in its consideration. Cancer Chemother Rep. 1966;50(3):163–170. [PubMed] [Google Scholar]
- 19.Zamagni E, Nanni C, Gay F, et al. 18F-FDG PET/CT focal, but not osteolytic, lesions predict the progression of smoldering myeloma to active disease. Leukemia. 2016;30(2):417–422. [DOI] [PubMed] [Google Scholar]
- 20.Dhodapkar MV, Sexton R, Waheed S, et al. Clinical, genomic, and imaging predictors of myeloma progression from asymptomatic monoclonal gammopathies (SWOG S0120). Blood. 2014;123(1):78–85. [DOI] [PMC free article] [PubMed] [Google Scholar]
- 21.Bhutani M, Turkbey B, Tan E, et al. Bone marrow abnormalities and early bone lesions in multiple myeloma and its precursor disease: a prospective study using functional and morphologic imaging. Leuk Lymphoma. 2016;57(5):1114–1121. [DOI] [PMC free article] [PubMed] [Google Scholar]
- 22.Zamagni E, Nanni C, Mancuso K, et al. PET/CT improves the definition of complete response and allows to detect otherwise unidentifiable skeletal progression in multiple myeloma. Clin Cancer Res. 2015;21(19):4384–4390. [DOI] [PubMed] [Google Scholar]
Associated Data
This section collects any data citations, data availability statements, or supplementary materials included in this article.


