Abstract
β-arrestins are critical regulator and transducer proteins for G protein-coupled receptors (GPCRs). Cellular β-arrestin function is presently thought to require stable and stoichiometric GPCR/β-arrestin scaffold complex formation driven by the phosphorylated GPCR tail. We demonstrate a distinct and additional mechanism that does not require stable GPCR/β-arrestin scaffolding or the GPCR tail. Instead, it is activated by transient engagement of the GPCR core that destabilizes a conserved inter-domain charge network in β-arrestin. This promotes capture of β-arrestin at the plasma membrane and accumulation in clathrin-coated endocytic structures (CCSs) after GPCR dissociation, requiring a series of β-arrestin interactions with membrane phosphoinositides and CCS lattice proteins. β-arrestin clustering in CCSs without its upstream activating GPCR is associated with a β-arrestin-dependent component of the cellular ERK (Extracellular signal-regulated kinase) response. These results delineate a discrete mechanism of cellular β-arrestin function that is activated catalytically by GPCRs.
G protein-coupled receptors (GPCRs), nature’s largest family of signaling receptors, regulate essentially every physiological process and comprise a very important class of drug targets1–4. GPCR signaling and regulatory events are mediated primarily through receptor interactions with two classes of transducer protein, heterotrimeric G proteins and β-arrestins. β-arrestins were discovered through their ability to prevent G protein coupling to GPCRs and are now recognized to support additional functions, including GPCR endocytosis mediated by clathrin-coated structures (CCSs) and downstream signaling mediated by MAP (mitogen-activated protein) kinase cascades5,6. A long-standing view is that all of these functions occur from a stable and stoichiometric GPCR/β-arrestin complex whose formation requires binding of the phosphorylated GPCR tail 7,8. Emerging evidence suggests that GPCR/β-arrestin complexes can vary in structure but, nevertheless, all present concepts of cellular β-arrestin function require formation of a GPCR/β-arrestin complex driven by the phosphorylated GPCR tail 10,14–17.
Recently β-arrestin-2 was found to mediate MAP kinase signaling by accumulating in CCSs in response to ligand-dependent activation of the β1-adrenergic GPCR (β1AR) but, remarkably, without the β1AR co-accumulating. This ability of β-arrestin-2 to operate separately from its activating GPCR is not compatible with present mechanistic understanding and remains unexplained. Here we show that such ‘action at a distance’ behavior is widespread and delineate a distinct, tail-independent mechanism of cellular β-arrestin activation in which transient engagement of the GPCR core acts catalytically.
Separate trafficking of β-arrestin
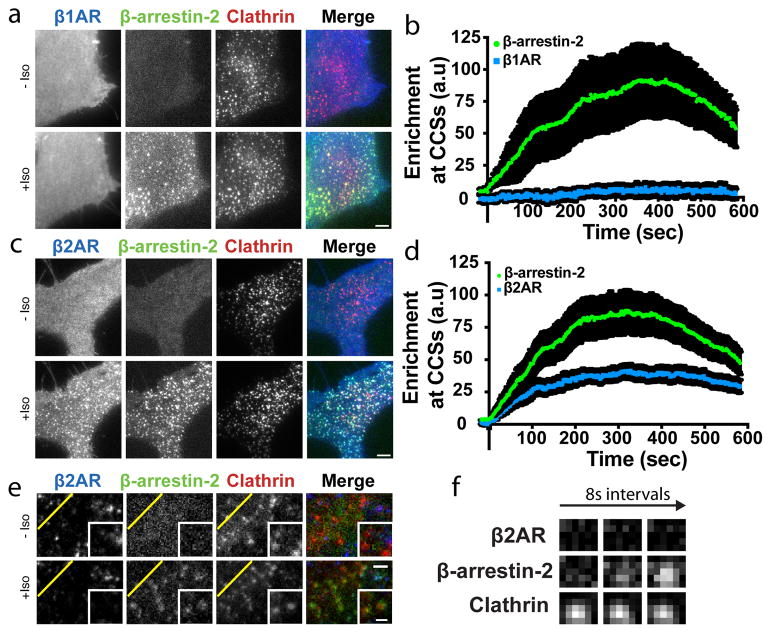
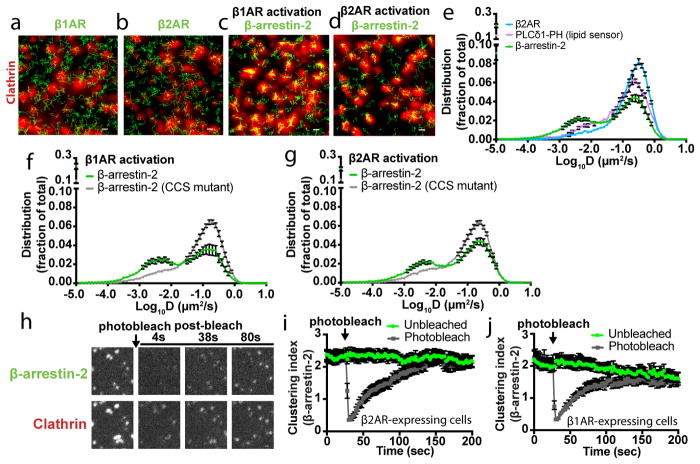
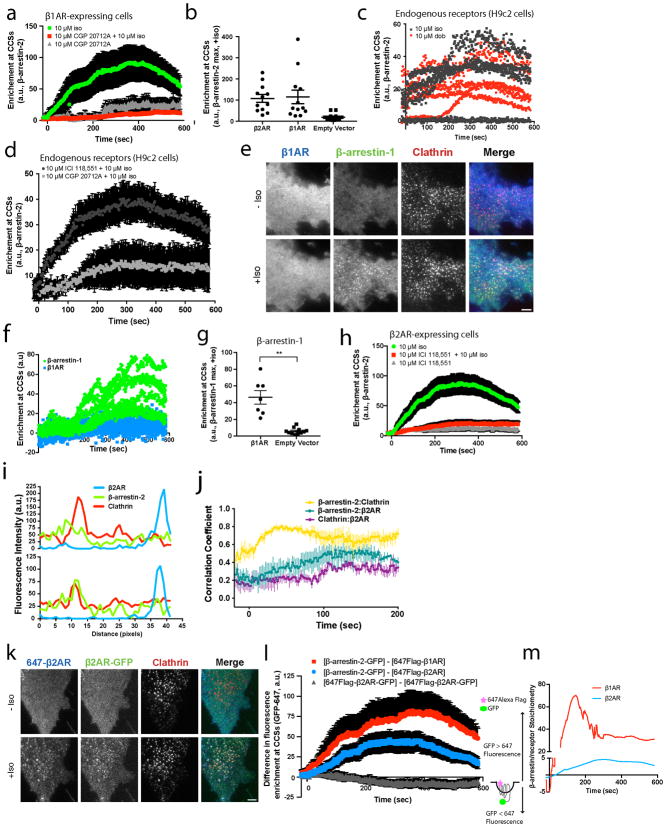
We verified separate trafficking of β-arrestin-2 in HEK293 cells co-expressing recombinant β1ARs using total internal reflection fluorescence (TIRF) microscopy. The β-adrenergic agonist isoproterenol produced rapid and robust accumulation of β-arrestin-2 in CCSs without detectable co-accumulation of β1AR (Figure 1a, b). Nevertheless, β-arrestin-2 trafficking to CCSs was dependent on ligand-induced β1AR activation because it was greatly reduced by the β1-selective antagonist CGP 20712A (Extended Data Figure 1a) or in HEK293 cells not expressing recombinant β1ARs (Extended Data Figure 1b). Endogenous β1ARs can activate β-arrestin trafficking because in H9c2 cells, which express β1ARs endogenously at higher levels19, either isoproterenol or the β1-selective agonist dobutamine activated β-arrestin trafficking through the endogenous receptors (Extended Data Figure 1c) and the β1-selective antagonist CGP 20712A inhibited this (Extended Data Figure 1d). We also found that β-arrestin-1 (Arrestin 2) is also capable of separate accumulation in CCSs (Extended Data Figure 1e–g), establishing generality across β-arrestin isoforms.
Figure 1. Discrete mode of GPCR-activated cellular β-arrestin trafficking is broadly conserved.
(a–d) Live cell TIRF microscopy images showing (a) FLAG–β1AR (blue) or (c) FLAG–β2AR (blue), β-arrestin-2–GFP (green) and clathrin-light-chain–DsRed (red) before and after 10 μM isoproterenol treatment. Average enrichment at CCSs after 10 μM isoproterenol treatment for (b) FLAG–β1AR (d) FLAG–β2AR (n=14 and 15 cells, respectively, from 3 independent experiments, data shown as mean ± s.e.m.). (e) Live cell TIRF microscopy images of HEK 293 cells co-expressing super ecliptic pHluorin–β2AR (blue), β-arrestin-2–mApple (green), and clathrin-light-chain–TagBFP (red) before and after 10 μM isoproterenol treatment. (f) Timelapse of individual pre-existing CCSs from panel e. Scale bars, 5 μm. (a, c, e, f) show representative images from 3 independent experiments.
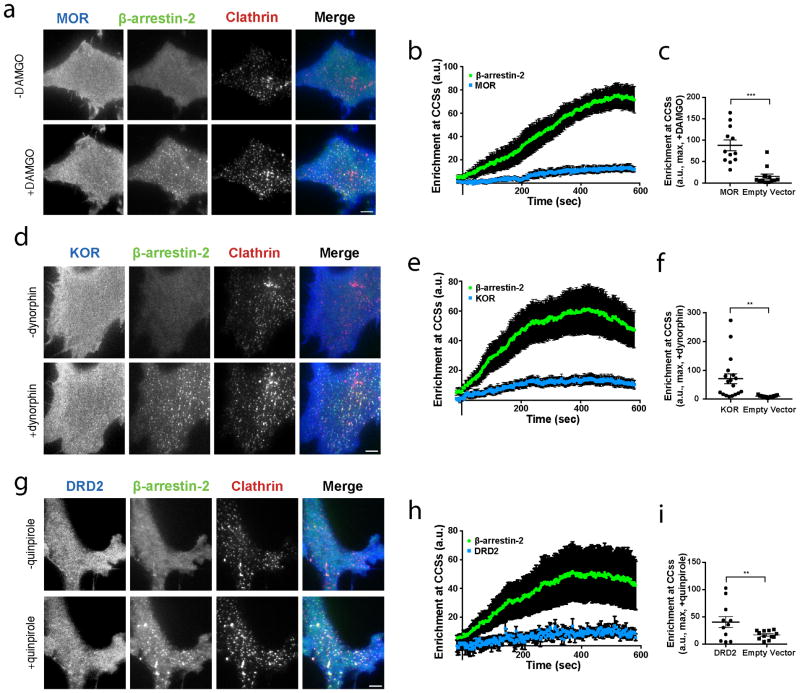
The β2-adrenergic receptor (β2AR) is a homologous GPCR that co-accumulates with β-arrestin in CCSs20–22. We verified this by TIRF microscopy in HEK293 cells expressing FLAG-tagged β2ARs ~10-fold higher than endogenous levels (Figure 1c, d; Extended Data Figure 1h). We considered the possibility that β2ARs share the capacity to activate β-arrestin trafficking separate from the receptor, but that this capacity is obscured by the natural tendency of β2ARs to co-traffic. Indeed, when laterally immobilized to prevent receptor accumulation in CCSs18,23, FLAG-β2AR still promoted rapid accumulation of β-arrestin-2 in CCSs (Figure 1e, f, Extended Data Figure 1i, j). Further, when not immobilized, both β1AR and β2AR produced super-stoichiometric accumulation of β-arrestin-2 in CCSs relative to receptor (~28 and ~4, respectively; Extended Data Figure 1k–m). Moreover, a limited survey of family A GPCRs suggested that such differential stimulation of β-arrestin trafficking is broadly conserved across GPCRs as well as β-arrestin isoforms (Extended Data Figure 2).
Activation by GPCR core interaction
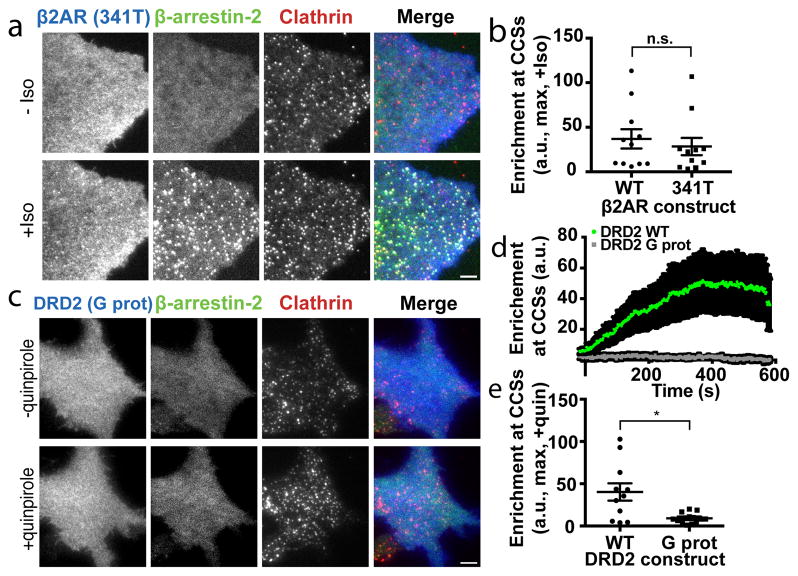
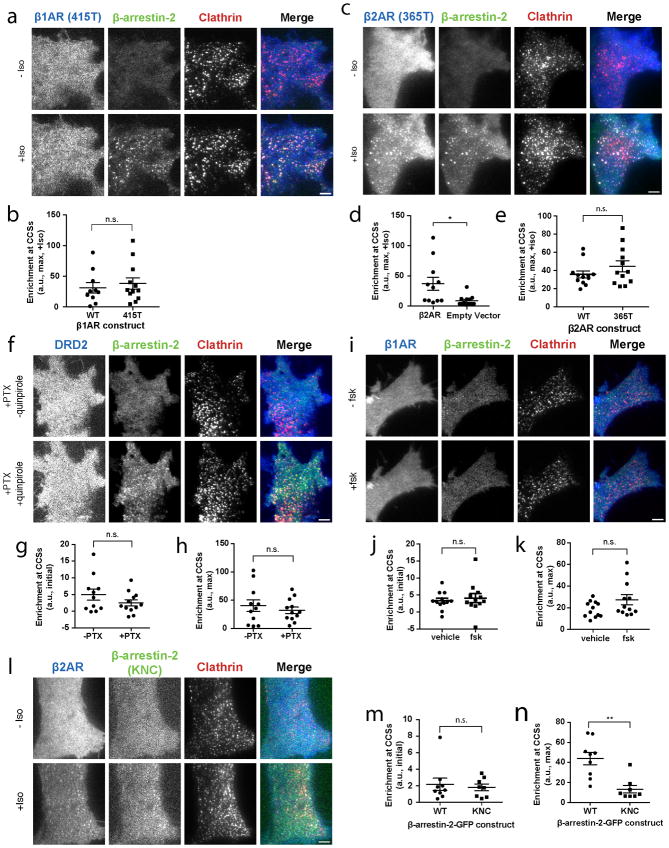
Traditional GPCR/β-arrestin scaffolding requires the receptor cytoplasmic tail and is driven by tail phosphorylation9,12,24,25. In contrast, the β1AR cytoplasmic tail was not required to activate β-arrestin trafficking. β-arrestin accumulation in CCSs was unaffected by nearly complete removal of the GPCR cytoplasmic tail (415T, Extended Data Figure 3a, b). This was also true for β2ARs after a similarly extensive tail truncation (341T, Figure 2a, b), as well as after a less extensive truncation (365T) shown previously to abrogate β2AR/β-arrestin scaffold complex formation10 (Extended Data Figure 3c–e).
Figure 2. β-arrestin trafficking activation requires the GPCR core but not the GPCR cytoplasmic tail.
(a) Live cell TIRF microscopy images of COS-1 cells co-expressing FLAG–β2AR truncated at the 341st amino acid (341T, blue), β-arrestin-2–GFP (green) and clathrin-light-chain–DsRed (red) before and after 10 μM isoproterenol treatment. (b) Maximum β-arrestin-2–GFP enrichment at CCSs in cells treated with 10 μM isoproterenol and co-expressing the indicated FLAG–β2AR (n=11 cells from 3 independent experiments, p=0.5634 using a two-tailed unpaired t test). (c) Live cell TIRF microscopy images showing FLAG–DRD2 G protein biased mutant (G prot, blue), β-arrestin-2–GFP (green) and clathrin-light-chain–DsRed (red) before and after 10 μM quinpirole treatment. (d) Average (data shown as mean ± s.e.m.) and (e) maximum enrichment of β-arrestin-2–GFP into CCSs in cells expressing wild-type (green) or G protein biased mutant versions (gray) of FLAG-DRD2 and treated with 10 μM quinpirole (n=11 (WT) and 14 (G prot) cells from 3 independent experiments, p=0.013 using a two-tailed unpaired t test using Welch’s correction). (a) and (c) show representative images from 3 independent experiments. Scatter plots show overlay of mean and s.e.m. Scale bars, 5 μm. * p < 0.05
In principle, GPCRs could promote tail-independent trafficking of β-arrestin trafficking through activation of a downstream G protein-linked signaling pathway. This was not the case because GPCR-activated β-arrestin-2 accumulation in CCSs did not depend on selectivity for G protein coupling and trafficking activated by the Gi-coupled D2 dopamine receptor was unaffected by pertussis toxin (DRD2, Extended Data Figure 3f–h), consistent with another recent report26. Further, receptor-independent activation of adenylyl cyclase using forskolin did not promote (or block) β-arrestin-2 trafficking (Extended Data Figure 3i–k). Rather, the discrete β-arrestin trafficking behavior required direct binding of the ligand-activated GPCR because a mutant β-arrestin-2 that is unable to bind GPCRs27 did not accumulate in CCSs (Extended Data Table 1; Extended Data Figure 3l–n). β-arrestin has been shown to engage GPCRs transiently through a ligand-dependent interaction not requiring the phosphorylated receptor tail28. We hypothesized that such transient binding is sufficient to activate β-arrestin trafficking and is mediated by the GPCR core. To test this we focused on the DRD2 because it naturally has a short cytoplasmic tail yet robustly activates β-arrestin trafficking to CCSs (Extended Data Figure 2g–i). Establishing a critical role of the core interaction, a mutation of the DRD2 core domain that specifically disrupts receptor coupling to β-arrestin (DRD2 G prot29) prevented ligand-dependent stimulation of β-arrestin trafficking to CCSs (Figure 2c–e).
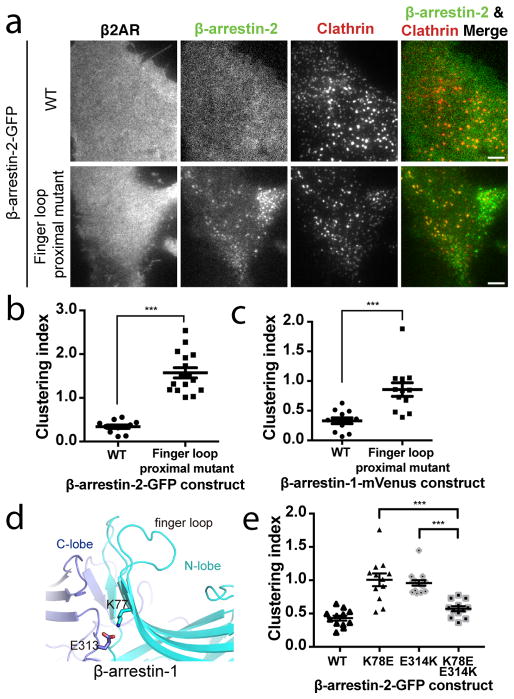
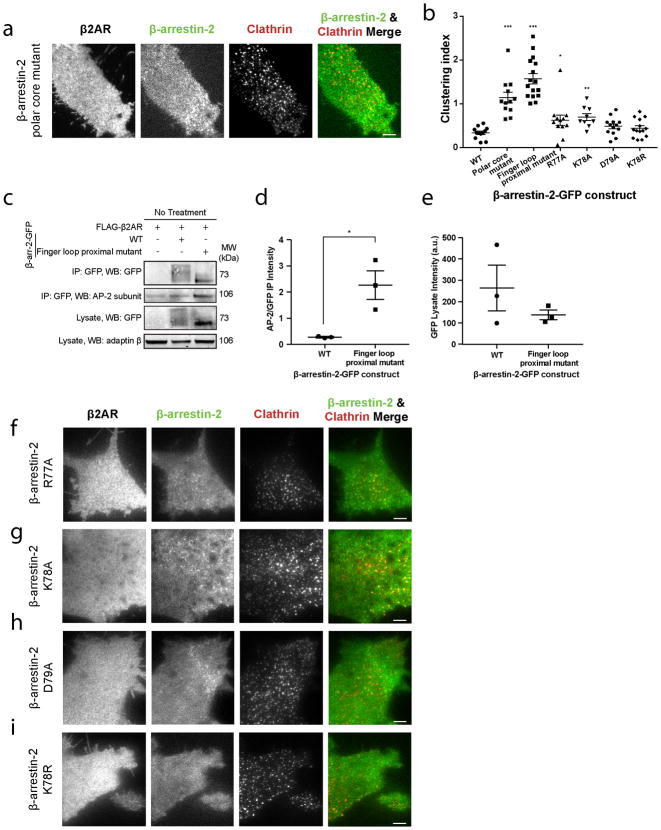
We next investigated how GPCR core engagement affects the activation of β-arrestin trafficking by focusing on a polar region in β-arrestin that is located proximal to the conserved finger loop and is thought to directly contact the ligand-activated GPCR core12,14. We identified three charged residues in this ‘finger loop proximal’ region that produce constitutive β-arrestin-2 accumulation in CCSs when mutated to alanine (R77A, K78A, D79A; Figure 3a, b). When analyzed using a statistical metric of β-arrestin clustering validated against a previously described constitutively active β-arrestin construct (polar core mutant30; Extended Data Table 1, Extended Data Figure 4a, b), these finger loop proximal alanine substitutions produced a comparably strong constitutive activation phenotype (Extended Data Figure 4b). Providing biochemical evidence for constitutive activation of β-arrestin, the finger loop proximal charge mutations also increased ligand-independent interaction of β-arrestin with the clathrin-associated adaptor protein-2 (AP-2; Extended Data Figure 4c–e). Individual substitution of finger loop proximal charged residues was sufficient to produce ligand-independent accumulation of β-arrestin-2 in CCSs, with K78 mutation having the largest effect (Extended Data Figure 4b, f–h). Further, mutating K78 to arginine (K78R) rather than alanine did not produce constitutive activation (Extended Data Figure 4b, i). Together, these results suggest that K78 stabilizes β-arrestin in its inactive (cytoplasmic) state through a charge interaction positioned at the GPCR core binding interface.
Figure 3. β-arrestin activation is inhibited by a polar network in a region proximal to the β-arrestin finger loop.
(a) Representative live cell TIRF microscopy images (from 3 independent experiments) showing FLAG–β2AR (blue), clathrin-light-chain–DsRed (red), and wild-type (top, green) or finger loop proximal mutant (bottom, green) β-arrestin-2–GFP without agonist treatment. Clustering index measuring constitutive activation of the indicated (b) β-arrestin-2–GFP or (c) β-arrestin-1–mVenus constructs without agonist treatment (n=12 cells from 3 independent experiments, p<0.0001 and 0.0008, respectively, using a two-tailed unpaired t test). (d) Snapshot from molecular dynamics simulations of inactive-state β-arrestin-1 in which K77 and E313 occasionally form a stable salt bridge. This salt bridge formed 6% of the time in inactive-state simulations (six simulations totaling 26.7 μs); it may form more frequently on longer timescales. It formed in only a few frames of active-state simulations (0.2% of the time across six simulations totaling 29.3 μs in length). (e) Clustering index of the indicated β-arrestin-2–GFP construct without agonist treatment. Statistics were calculated using a two-tailed unpaired t test (for K78E, n=12 cells from 3 independent experiments, p=0.0003; for E314K, n=12 cells from 3 independent experiments, p<0.0001. Scatter plots show overlay of mean and s.e.m. Scale bars, 5 μm. *** p < 0.001.
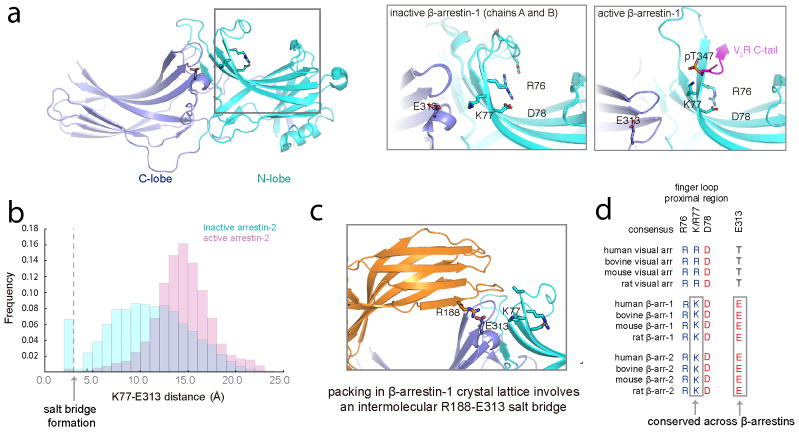
To gain insight to how these residues may affect β-arrestin function, we focused on β-arrestin-1 because more structural data are available for this isoform and mutating the corresponding residues in β-arrestin-1 also produced constitutive accumulation in CCSs (Figure 3c). Crystal structures of putative inactive (Extended Data Figure 5a left, middle) and active (Extended Data Figure 5a right) forms of β-arrestin-1 reveal that the finger loop proximal charge residues are located within an extensive network of polar residues spanning the β-arrestin N- and C- domains. In both inactive and active structures, R76 may interact with D78 (corresponding to R77 and D79 in β-arrestin-2) but a partner for K77 (K78 in β-arrestin-2) is not apparent, even though point mutation of this residue produced the strongest constitutive phenotype. We used molecular dynamics simulations to identify acidic residues that might interact with K77. In inactive state simulations, K77 sometimes formed an intramolecular salt bridge with E313 in the C-domain, but this interaction rarely formed in active-state simulations (Figure 3d, Extended Data Figure 5b). This interaction may have been previously overlooked because E313 interacts with R188 on another β-arrestin molecule in the crystal lattice, likely due to lattice packing (Extended Data Figure 5c). Both K77 and E313 are conserved in β-arrestin-2 (K78 and E314, Extended Data Figure 5d) and, for both β-arrestin isoforms, N- and C-domain separation is thought to accompany β-arrestin activation9,11,31. Thus we hypothesized that K77/78 and E313/314 occasionally form a salt bridge that stabilizes the inactive state of β-arrestin by favoring tighter interactions between the N- and C-domains. Charge mutation of E314 (E314K) also produced ligand-independent accumulation of β-arrestin-2 in CCSs (Figure 3e). Further, mutating both residues together (K78E E314K), to restore the putative ionic interaction by charge swap, reversed this constitutive phenotype (Figure 3e). Together, these findings suggest that the finger loop proximal charged residues function as part of an inter-domain interaction network that normally maintains β-arrestin in its inactive cytoplasmic form and is destabilized by GPCR core interaction.
Capture after GPCR dissociation
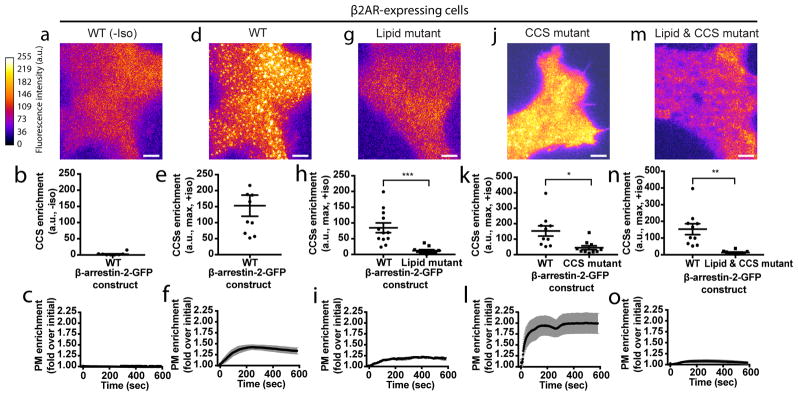
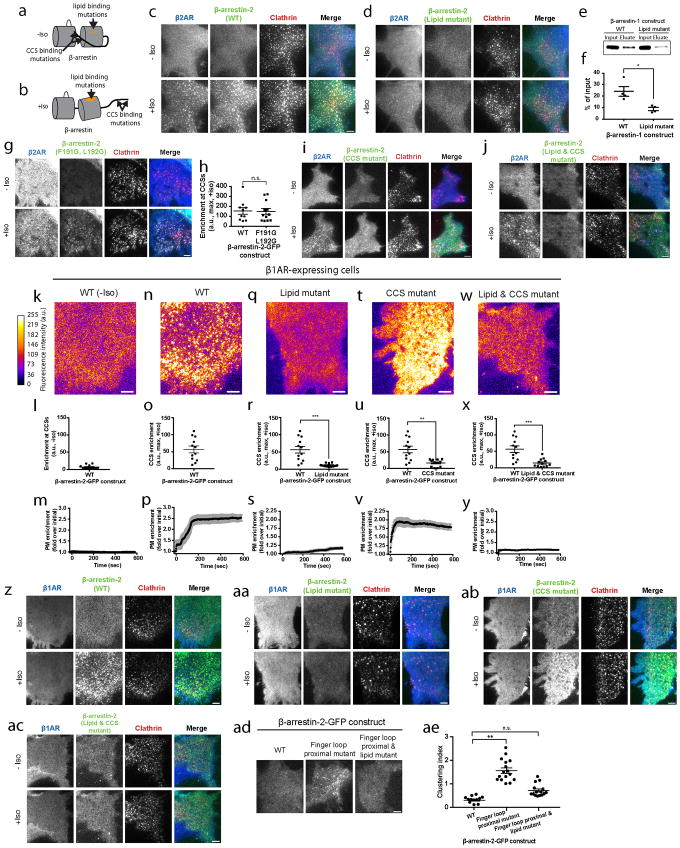
For β-arrestin to traffic to CCSs after dissociating from its upstream activating GPCR, additional partner(s) must engage and stabilize β-arrestin at the plasma membrane. We focused on several known candidates (Extended Data Table 1; Extended Data Figure 6a, b). Mutating a conserved phosphoinositide binding determinant in the β-arrestin C-domain, which was previously mapped and implicated in β-arrestin trafficking32, prevented ligand-induced β-arrestin-2 accumulation at the plasma membrane and in CCSs (Lipid mutant, Figure 4a–i, Extended Data Figure 6c, d). We verified biochemically that PIP2 binding to this determinant is sufficient to partition β-arrestin out of the solution phase (Extended Data Figure 6e, f). This phosphoinositide-binding determinant is specific to β-arrestins but a lipid-anchoring region in the C-domain was recently identified visual arrestin33. Mutating the homologous residues in β-arrestin did not prevent accumulation at the plasma membrane or in CCSs (Extended Data Table 1; Extended Data Figure 6g, h). Mutating previously identified clathrin34 and AP-235 binding determinants (CCS mutant) in the β-arrestin C-terminus prevented β-arrestin-2 from accumulating in CCSs without blocking accumulation at the plasma membrane (Extended Data Table 1; Figure 4j–l, Extended Data Figure 6i). Mutating the phosphoinositide binding determinant together with clathrin and AP-2 binding determinants blocked β-arrestin-2 accumulation at the plasma membrane altogether, the same phenotype produced by mutation of the phosphoinositide binding determinant by itself (Lipid & CCS mutant, Figure 4m–o; Extended Data Figure 6j). Similar results were obtained using the β1AR rather than β2AR as an activating GPCR (Extended Data Figure 6k–ac). Further, mutating the phosphoinositide binding determinant prevented the constitutive trafficking phenotype produced by finger loop proximal charge mutations in β-arrestin-2 (Extended Data Figure 6ad, ae). These results indicate that β-arrestin is stabilized at the plasma membrane after dissociating from its activating GPCR through a series of non-GPCR interactions.
Figure 4. Phosphoinositide binding is required to capture β-arrestin at the plasma membrane after GPCR dissociation.
Representative live cell TIRF microscopy images (from 3 independent experiments) showing FLAG–β2AR, the indicated β-arrestin-2–GFP construct, and clathrin-light-chain–DsRed. Shown are β-arrestin images false-colored to indicate fluorescence intensity, maximum fluorescence enrichment at CCSs, and normalized average plasma membrane (PM) β-arrestin-2–GFP fluorescence (shown as mean ± s.e.m), respectively, from cells co-expressing FLAG–β2ARs without isoproterenol treatment (a–c), and the following β-arrestin-2–GFP constructs with 10 μM isoproterenol treatment: wild-type (d–f), lipid mutant (g–i), CCS mutant (j–l), and CCS and lipid mutant (m–o); n=12 cells per condition. Wild-type β-arrestin-2–GFP maximum enrichment in panel h is replotted from panel e and panel n is replotted from panel k. Statistics were calculated using a two-tailed unpaired t test with Welch’s correction. For (h) n=12 and 11 cells, respectively, from 3 independent experiments and p=0.0006. For (k) n=10 cells from 3 independent experiments and p=0.0102. For (n) n=10 cells from 3 independent experiments and p=0.0022. Extended Data Table 1 provides detailed description of β-arrestin mutations. Scatter plots show overlay of mean and s.e.m. scale bars, 5 μm. ** p < 0.01; *** p < 0.001.
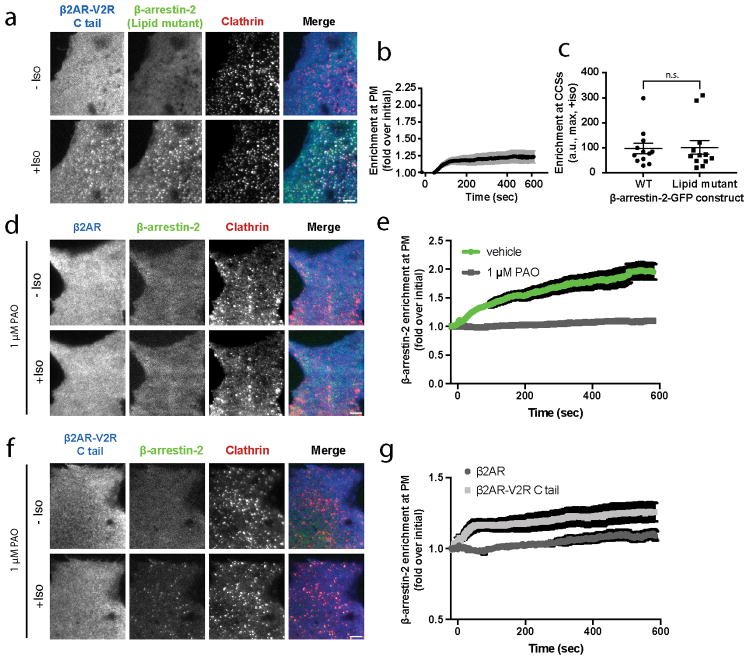
While the phosphoinositide binding determinant was essential for β-arrestin-2 trafficking to CCSs activated by β1AR and β2AR, it was not required for accumulation of β-arrestin-2 in CCSs produced by the β2AR-V2R chimera, a GPCR that is known to form a highly stable tail-dependent GPCR/β-arrestin scaffold complex36 (Extended Data Figure 7a–c). Independently verifying this difference, depleting PIP2 from the plasma membrane using phenylarsine oxide (PAO) 37 blocked the ability of β2AR but not β2AR-V2R chimera to activate wild type β-arrestin-2 trafficking to CCSs (Extended Data Figure 7d–g). Thus, phosphoinositide binding to β-arrestin appears to be required specifically for β-arrestin trafficking to CCSs after dissociation from its upstream activating GPCR, but not for trafficking to CCSs while bound in a sufficiently stable GPCR/β-arrestin scaffold complex.
Dynamics in the plasma membrane
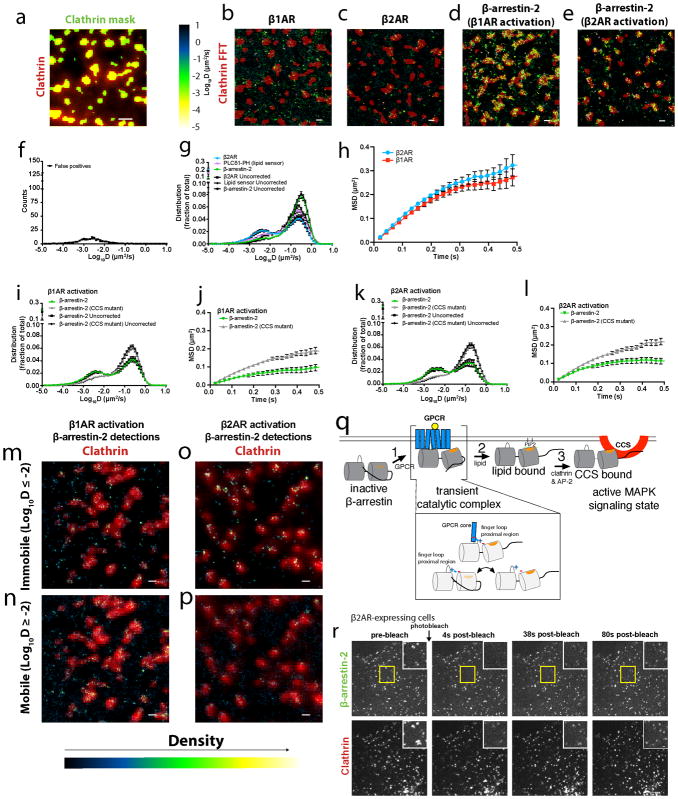
We next investigated the discrete trafficking mechanism using single particle tracking photoactivated localization microscopy (sptPALM38, Figure 5a–d; Extended Data Figure 8a–e; Supplementary Videos 1–4). β-arrestin-2 diffusion profiles exhibited two major peaks when activated by the β2AR. A mobile fraction (D > 10−2 μm2/s) overlapped the major diffusion peak of the β2AR, but also that of a lipid probe (PH-PLCδ1) that is known to freely diffuse in the plasma membrane39 (Figure 5e; Extended Data Figure 8f–h). An immobile fraction (D ≤ 10−2 μm2/s) consistent with the mobility of CCSs was also observed40, and the density of immobile β-arrestin-2 molecules was significantly higher within a CCS mask compared to the rest of the plasma membrane. This was true irrespective of whether β-arrestin-2 trafficking was activated by the β1AR or β2AR (9.3 and 6.0-fold enrichment; (n=11 and 9 cells from 3 independent experiments and p=0.0004 and 0.0016, respectively; statistical significance was calculated using a two-tailed unpaired t test). Confirming that the immobile fraction of β-arrestin-2 molecules largely represents those bound to the CCS lattice, destabilizing clathrin and AP-2 interactions with β-arrestin (CCS mutant) shifted the distribution into the mobile peak, irrespective of whether β-arrestin recruitment was activated by the β1AR or β2AR (Figure 5f, g, Extended Data Figure 8i–l, Supplementary Videos 5 & 6). This suggests that disrupting CCS binding displaces β-arrestin toward an association with a diffusive partner on the plasma membrane. Consistent with this, β-arrestin-2 molecules present within CCSs were essentially immobile after activation by either the β1AR or β2AR (log(D) = −2.3 μm2/s and −2.7 μm2/s, Extended Data Figure 8m–p). Both β1AR and β2AR trajectories populated CCSs but β2ARs were preferentially immobilized (log(D) = −2.3 μm2/s) there, whereas β1ARs were largely mobile (log(D) = −1.6 μm2/s). Together, these results indicate that β-arrestin is similarly immobilized in CCSs irrespective of whether (β2AR) or not (β1AR) the activating GPCR is also immobilized there.
Figure 5. Single particle tracking-photoactivated localization microscopy (sptPALM) analysis of GPCR and β-arrestin dynamics and stable β-arrestin binding at CCSs.
(a–d) Representative images (from at least 3 independent experiments) of (a) photoactivatable (PA) mCherry-β1AR (green) or (b) PAmCherry-β2AR (green) trajectories and (c) PAmCherry-β-arrestin-2 trajectories (green) with β1AR expression or (d) PAmCherry-β-arrestin-2 (green) trajectories with β2AR expression from sptPALM analysis overlaid with a clathrin marker (red) after 10 μM isoproterenol treatment. (e) False positive corrected diffusion coefficients (D) of PAmCherry-β2AR, β-arrestin-2-PAmCherry, and PAmCherry-PLCδ1-PH in live cells after 10 μM isoproterenol treatment (n=13, 21, and 8 cells, respectively). β-arrestin-2-PAmCherry and PAmCherry-PLCδ1-PH were co-expressed individually with FLAG-β2AR. False positive corrected distribution of diffusion coefficients (D) of β-arrestin-2-PAmCherry wild-type and CCS mutant when co-expressed with (f) FLAG-β1AR (n=13 and 17 cells, respectively, from 3 independent experiments; statistical significance of the immobile fractions was calculated using a two-tailed unpaired t test, p<0.0001) or (g) FLAG-β2AR (n=21 and 10 cells, respectively, from 3 independent experiments; statistical significance of the immobile fractions was calculated using a two-tailed unpaired t test, p=0.002) β-arrestin-2-PAmCherry diffusion coefficient profiles when activated by the β2AR are replotted from panel e. (h) COS-1 cells co-expressing FLAG-β2AR, β-arrestin-2-GFP (green), and clathrin-light-chain-DsRed (red) were treated with 10 μM isoproterenol for 3 minutes before β-arrestin-2-GFP photobleaching. Shown are representative images (from 3 independent experiments) of the photobleached area. β-arrestin-2 clustering index over the course of the photobleaching experiment in cells co-expressing activated (i) FLAG-β1AR (n=12 cells from 3 independent experiments) or (j) FLAG-β2AR (n=15 and 13 cells for unbleached and photobleached conditions, respectively, from 3 independent experiments). Data are shown as mean ± s.e.m. Scale bars, 0.5 μm.
Stability of β-arrestin capture
Our results support a working model in which the ligand-activated GPCR acts catalytically to activate β-arrestin trafficking (Extended Data Figure 8q). β-arrestin is subsequently captured and stabilized at the plasma membrane after dissociating from its activating GPCR through a series of non-GPCR interactions that ultimately produce β-arrestin accumulation at CCSs. For this discrete mechanism to be energetically feasible, these non-GPCR interactions must be quite stable. Indeed, fluorescence recovery after photobleaching (FRAP) demonstrated that β-arrestin-2 accumulated in CCSs exchanges very slowly (t1/2 > 60 sec), whether (β2AR) or not (β1AR) the GPCR stimulating β-arrestin accumulation in CCSs co-accumulates (Figure 5h–j, Extended Data Figure 8r). Interestingly, this duration of β-arrestin association with the CCS is comparable to the lifetime of individual CCSs themselves18. Thus CCSs have the capacity to act both as ‘sinks’ to stabilize β-arrestin at the plasma membrane after GPCR dissociation and as ‘drivers’ of the discrete trafficking mechanism through β-arrestin dissociation from the plasma membrane coupled to endocytic scission of CCSs18.
Catalysis and scaffolding co-exist
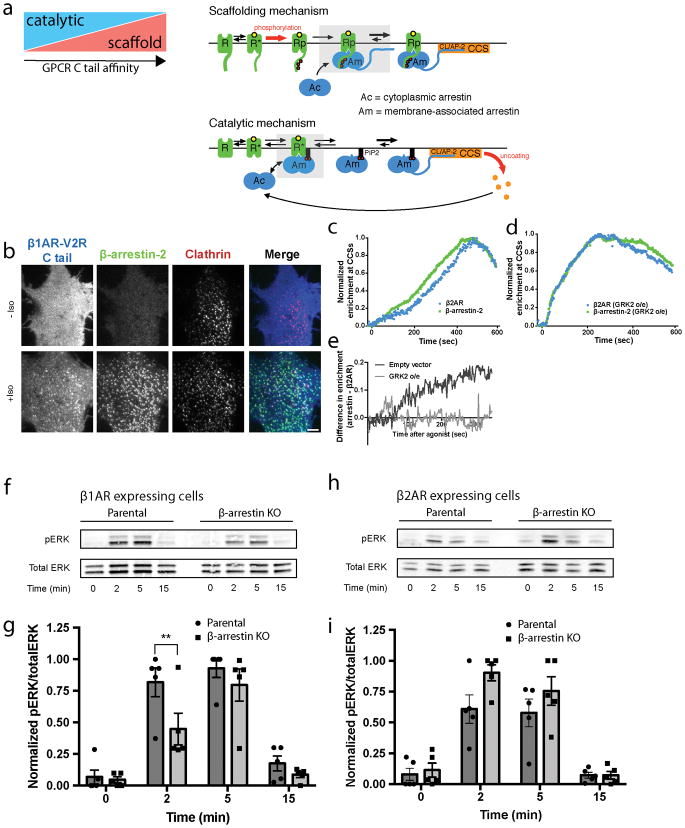
We believe that distinct catalytic and scaffold-driven mechanisms of GPCR-regulated β-arrestin trafficking likely co-exist in vivo, with the tendency of a particular GPCR to engage one mechanism relative to the other tuned by tail affinity for β-arrestin (Extended Data Figure 9a). The β1AR appears to be a relatively ‘pure’ example of a GPCR that activates β-arrestin trafficking primarily through the catalytic mechanism and with very little co-trafficking. The β2AR-V2R chimera favors co-trafficking in a tail-dependent scaffold complex, with β-arrestin trafficking to CCSs not requiring phosphoinositide binding. The β2AR has a mixed trafficking behavior, producing super-stoichiometric β-arrestin trafficking to CCSs dependent on phosphoinositide binding, yet also co-trafficking to CCSs through interaction of the phosphorylated receptor tail with β-arrestin. Emphasizing tunability of this system, manipulations that enhance GPCR tail binding to β-arrestin are able to further increase β2AR co-trafficking to CCSs and also cause β1AR to co-traffic (Extended Data Figure 9b–e).
Discussion
The present results reveal a new framework of cellular β-arrestin activation but raise many new questions. One is whether β-arrestin catalytic activation produces a similar or different conformational state relative to β-arrestin that traffics in a tail-dependent GPCR/β-arrestin scaffold complex. Tail-dependent GPCR/β-arrestin complex formation is thought to promote an open β-arrestin conformation defined by β-arrestin’s C-terminus being displaced. Clathrin and AP-2 binding determinants that are required for β-arrestin accumulation in CCSs are located in the C-terminus; therefore, β-arrestin accumulated in CCSs by the catalytic activation mechanism likely also exists in an open conformation. However, it is presently unknown if other β-arrestin conformational features are similar or different between the mechanisms. The accompanying manuscript by Latorraca et al. provides insight to this question by demonstrating through MD analysis that β-arrestin can frequent conformations similar to the GPCR tail-engaged complex once the C-terminus of β-arrestin is dissociated, even without the GPCR being bound. Another important goal is to more fully resolve individual steps in the catalytic activation mechanism and determine their kinetics. For example, β-arrestin trafficking could involve additional steps such as transactivation of another GPCR or binding to another GPCR’s phosphorylated tail. Much also remains to be learned about functional consequences of GPCR-catalyzed β-arrestin trafficking. β1ARs are known to promote β-arrestin-dependent ERK signaling by activating β-arrestin trafficking to CCSs without the receptor18, and we verified this using a CRISPR knockout approach41 (Extended Data Figure 9f, g). The β2AR is unlike the β1AR in its tendency to co-traffic to CCSs with β-arrestin, and this GPCR did not produce a detectable β-arrestin-dependent component of ERK activation when examined in parallel and at matched receptor expression levels (Extended Data Figure 9h, i). Thus we anticipate that the presently delineated catalytic mechanism of cellular β-arrestin activation, by uniquely enabling β-arrestin to traffic to CCSs separately from its upstream activating GPCR, likely has widespread physiological significance.
Methods
Cell culture, expression constructs, and transfections
HEK 293, COS-1, and H9c2 cells (purchased from ATCC as the authenticated lines CRL-1573, CRL-1650, and CRL 1446, respectively) were cultured in complete growth Dulbecco’s modified Eagle’s medium (DMEM, Gibco) and supplemented with 10% fetal bovine serum (UCSF Cell Culture Facility). Cell line cultures were free of mycoplasma contamination. Transfections were carried out using Lipofectamine 2000 for cDNA according to the manufacturer’s protocol. Cells were transfected 48 hours before experiments.
N-terminally FLAG-tagged versions of the human β1AR, β2AR, MOR, and KOR were previously described42,43. Super ecliptic pHluorin (SEP)-β2AR was previously described44. β1AR and β2AR tagged N-terminally with photoactivatable mCherry (PAmCherry-β1AR, PAmCherry-β2AR) was generated using PCR and homology-directed ligation (In-Fusion HD Cloning kit, Clontech). DRD2 was a gift from David Grandy (Oregon Health & Science University). DRD2 (G prot) was prepared as previously described29 by inserting a gBlock (IDT) containing the desired mutations with restriction sites BamHI and BstEII (NEB) into the wild-type DRD2 plasmid. β2AR-V2R C tail was a gift from Marc Caron and previously described45 β1AR-β2AR C tail, β1AR-V2R C tail, β2AR-β1AR C tail were generated using PCR and homology-directed ligation (In-Fusion HD Cloning kit, Clontech). N-terminally FLAG-tagged β1AR (415T) was generated from FLAG-β1AR using site-directed mutagenesis (Phusion Site-Directed Mutagenesis Kit, Thermo Scientific) to create a deletion after the 415th amino acid. N-terminally FLAG-tagged β2AR (341T) and FLAG-tagged β2AR (365T), which was previously described46,47, were prepared through PCR site-directed mutagenesis (Phusion Site-Directed Mutagenesis Kit, Thermo Scientific). β2AR with an N-terminal FLAG tag and a C-terminal GFP tag was generated by inserting a gBlock (IDT) containing a C-terminal fragment of β2AR, a 12 base pair linker, and GFP using EcoRV and PshAI (NEB).
β-arrestin-2-GFP, β-arrestin-2-mApple, and β-arrestin-2-PAmCherry were previously described18,48. β-arrestin-1-mVenus was a gift from Roger Sunahara (University of California, San Diego). Specific β-arrestin-2-GFP mutations are described in detail in Table 1. All β-arrestin-2-GFP finger loop proximal mutants were created by inserting a gBlock (IDT) containing the desired mutations into the β-arrestin-2-GFP wild-type plasmid using restriction sites HindIII and BbvCI (NEB). β-arrestin-2-GFP (E314K) and β-arrestin-2-GFP (K77E E314K) were created using site-directed mutagenesis (Phusion Site-Directed Mutagenesis Kit, Thermo Scientific) from the wild-type β-arrestin-2-GFP or β-arrestin-2-GFP (K77E) construct, respectively. β-arrestin-2-GFP lipid binding mutant was previously described32 and were created by inserting a gBlock (IDT) containing the desired mutations into the β-arrestin-2-GFP wild-type plasmid using restriction sites BbvCI and AhdI (NEB). β-arrestin-2-GFP CCS mutant and β-arrestin-2-PAmCherry CCS mutant were created by inserting a gBlock (IDT) containing the desired mutations into the β-arrestin-2-GFP and β-arrestin-2-PAmCherry plasmids, respectively, using restriction sites BlpI and ApaI (NEB). β-arrestin-2-GFP lipid and CCS mutant and β-arrestin-2-GFP lipid and finger loop proximal mutant constructs were created by inserting a gBlock (IDT) containing the desired mutations into the β-arrestin-2-GFP CCS mutant plasmid and β-arrestin-2-GFP finger loop proximal mutant construct, respectively using restriction sites BbvCI and AhdI (NEB). β-arrestin-2-GFP (L191G, F192G) was created using site-directed mutagenesis (Phusion Site-Directed Mutagenesis Kit, Thermo Scientific) from the wild-type β-arrestin-2-GFP. β-arrestin-1-mVenus finger loop proximal mutant was cloned by inserting a gBlock (IDT) containing the desired mutation into the β-arrestin-1-mVenus wild-type plasmid using restriction sites BamHI and SphI (NEB). β-arrestin-2-GFP KNC mutant was subcloned into β-arrestin-2-GFP from a β-arrestin-2 expression plasmid that was a gift from from Vsevolod Gurevich27. NAV3β-arrestin-1(1-393) in pGEX4T was generated from a previously described construct25 and contains an N terminal GST tag, 3C cleavage site, and AVI tag. NAV3β-arrestin-1(1-393) lipid binding mutant was created by inserting a gBlock (IDT) containing the desired mutations into the NAV3β-arrestin-1(1-393) using restriction sites EcoRI and NcoI (NEB).
Clathrin-dsRed, clathrin GFP, and clathrin-TagBFP were previously described18,20,49. GRK2-tagBFP was created through PCR amplifying GRK2, which was a gift of Jeff Benovic (Thomas Jefferson University), and subcloning into the pTagBFP vector (Evrogen) using NheI and SacII (NEB). PAmCherry-PLCδ1-PH was subcloned from GFP-PLCδ1-PH50, a gift from Tobias Meyer (addgene plasmid #21179), using BspEI and EcoRI (NEB).
Live cell total internal reflection fluorescence (TIRF) microscopy imaging
TIRF microscopy was performed at 37°C using a Nikon Ti-E inverted microscope equipped for through-the-objective TIRF microscopy and outfitted with a temperature-, humidity-, and CO2-controlled chamber (Okolab). Images were obtained with an Apo TIRF 100X, 1.49 numerical aperture objective (Nikon) with solid-state lasers of 405, 488, 561, and 647 nm (Keysight Technologies). An Andor iXon DU897 EMCCD camera controlled by NIS-Elements 4.1 software was used to acquire image sequences every 2 seconds for 10 minutes. Unless indicated otherwise, live cell microscopy assays were performed using HEK 293 cells. Cells were transfected as indicated according to manufacturer’s protocol 48 hours before imaging and then plated on poly-L-lysine (0.0001%, Sigma) coated 35-mm glass-bottomed culture dishes (MatTek Corporation) 24 hours before imaging. Cells were labeled with M1 monoclonal FLAG antibody (1:1000, Sigma F-3040) conjugated to Alexa 647 dye (Life Technologies) for 10 minutes at 37°C prior to imaging, washed, and imaged live in DMEM without phenol red (UCSF Cell Culture Facility) supplemented with 30 mM HEPES, pH 7.4 (UCSF Cell Culture Facility). Cells were treated with bath application of 10 μM of the indicated agonist at time equals 0 seconds for experiments shown as timecourses. At least three independent experiments were performed for all live cell TIRF microscopy imaging.
TIRF microscopy image analysis
Quantitative image analysis was performed on unprocessed images using ImageJ and Fiji software51,52. To quantify change in arrestin fluorescence over time in TIRF microscopy images, which was reported as plasma membrane recruitment, fluorescence values were measured over the entire stack in a region of interest (ROI) corresponding to the cell. Fluorescence values of the ROI were normalized to initial fluorescence values before agonist addition. Minimal bleed-through and photobleaching was verified using single-labeled and untreated samples, respectively. Linescan analysis of receptor, β-arrestin, or clathrin fluorescence from the shown line were carried out using the Fiji plot profile function to measure pixel values from this line. For fluorescence enrichment into CCSs calculations, a mask of CCSs was generated using a thresholded average image of the clathrin channel. Enrichment at CCSs for receptor and arrestin was measured as the difference between the average fluorescence in the mask and average fluorescence outside of the thresholded structures. Clustering index was determined using the skew statistical measurement applied to fluorescence intensity values of β-arrestin-GFP pixels in an ROI corresponding to the cell.
Fluorescence recovery after photobleaching
Fluorescence recovery after photobleaching was performed at 37 °C using a Nikon Ti inverted spinning disk confocal (Yokogawa CSU-W1) microscope equipped with a temperature-, humidity- and CO2-controlled chamber (Okolab). Images were obtained with a Plan Apo VC 100x, 1.4 NA objective (Nikon) with 488, 561, and 640 nm solid-state lasers (Keysight Technologies). An Andor Zyla 4.2 sCMOS camera controlled by MicroManager 2.0 software was used to acquire image sequences. A Rapp Optoelectronic UGA-40 photobleaching system was used to photobleach β-arrestin-2-GFP on a small area of the plasma membrane with a 473 nm laser (Vortran). Cells were imaged every two seconds for ten minutes to monitor fluorescence recovery after photobleaching. All quantitative image analysis was performed on unprocessed images using ImageJ software. The clustering index was calculated for the photobleached and unbleached areas of identical size in the same cell. Photobleaching experiments were performed at least three independent times.
Quantitative live cell single particle tracking combined with photoactivated localization microscopy (sptPALM)
Cells were transfected as indicated according to the manufacturer’s protocol 48 h before imaging and then plated on poly-L-lysine (0.0001%, Sigma)-coated 35-mm glass-bottomed culture dishes (MatTek Corporation) 24 h before imaging. Results were obtained with at least 3 independent experiments, except for the analysis of PAmCherry-β1AR diffusion coefficients profile. For experiments to investigate the diffusion coefficient profile of PA-mCherry tagged receptors, lipid sensor, β-arrestin-2, or control cells without PA-mCherry protein expression, cells were surface labeled with M1-Alexa488 and experiments performed blind relative to the transfection condition. For experiments to localize receptors or β-arrestin behavior relative to CCSs, cells were incubated for 10 minutes with 100 nm TetraSpeck microspheres (ThermoFisher) and imaging performed blind relative to the transfection condition. sptPALM experiments were performed at 37 °C using a Nikon Ti-E inverted microscope equipped with TIRF illumination and outfitted with a temperature-, humidity- and CO2-controlled chamber (Okolab). Cells were imaged in a solution containing solution with 135 mM NaCl, 5 mM KCl, 0.4 mM MgCl2,1.8 mM CaCl2, 20 mM Hepes, and 5 mM d-glucose, adjusted to pH 7.4, 1 minute after addition of isoproterenol 10μM. Images were acquired with a PL-Apo TIRF 100x 1.49 NA objective (Nikon) with solid-state lasers of 405, 488, 561 and 647 nm (Keysight Technologies) as light sources. An Andor iXon DU897 EMCCD camera controlled by NIS-Elements 4.1 software was used to acquire stacks of 5,000 images with continuous activation by 405 nm light and imaging by 561 nm laser. Single molecule image sequences were acquired in streaming mode at 45Hz in a 256*256 pixels area (field of view of 40*40 μm). For the colocalization experiments, a clathrin-GFP image was acquired at the end of the sptPALM imaging series. Single molecule fluorescent spots were localized and tracked over time using a combination of wavelet-based segmentation and simulated annealing tracking algorithms as previously described53,54. The software package used to derive quantitative data on protein localization and dynamics is custom written, operating as a plug-in running within the MetaMorph software (Molecular Devices) environment. The mean square displacement (MSD) and diffusion coefficient (D) were calculated for every trajectory as follow. For every trajectory of N data points (coordinates x(t), y(t) at times t = 0 to N*Δt with Δt = 22ms), the MSD for time intervals τ = n*Δt is calculated using the formulae:
The diffusion coefficients D were then extracted by linear fit on the first 4 time points of the MSD curves using the formulae MSD(τ) = 〈r2〈 (τ) + α = 4Dτ + α, with α the ordinate at the origin of the linear fit due to the precision accuracy in the localization process. The bin at 10−5 μm2/s represents trajectories for which calculation of D was ≤ 10−5μm2/s.
The bin at 10−5 μm2/s represents trajectories for which calculation of D was ≤ 10−5 μm2/s.
To define the diffusion profile across the different conditions, we included only trajectories longer than 6 points. To take into account for false detections due to non-specific single-molecule signal, we computed an average histogram of diffusion coefficients from trajectories obtained by imaging cells without PA-mCherry expression, using the same parameters as described previously. The variability of the number of localizations and diffusion profiles of non-specific single molecule signal was very low. For each cell exhibiting at least 5 times more trajectories than the average false detection count, the histogram of false detections was subtracted from the distribution of diffusion coefficients. Histograms of diffusion coefficients were computed by normalizing the number of trajectories for each bin by the total number of trajectories after false detection subtraction. We considered trajectories with a diffusion coefficient ≤ 10−2μm2/s as immobile and used this criterion for evaluation of statistical significance using a two-tailed t-test.
For analysis of localization of trajectories relative to CCPs, single-particle tracking movies as well as diffraction limited clathrin-GFP images were aligned with subpixel accuracy using a Gaussian fitting on the Tetraspeck microsphere signal used as fiduciary marker. Trajectories of more than 8 points were used to generate the super-resolution images with a pixel size of 19.6 nm (zoom 8x compare to the acquired data) and compute the diffusion coefficients as described above. A series of super-resolution images were generated displaying reconstructed individual trajectories, localization density of mobile molecules (D ≥ 10−2 μm2/s), immobile molecules (D ≤ 10−2 μm2/s), or diffusion coefficients maps. Diffusion coefficient maps were computed by averaging in each pixel the diffusion coefficients from all the trajectories detected in the corresponding pixel. Images of CCSs were zoomed 8x before alignment and overlaid with the super-resolution images. A binary mask of the CCSs was generated using ImageJ (NIH) by thresholding and eroding by two pixels the 8x zoomed image of the clathrin mask after bandpass filtering in the Fourier domain. This mask was used in combination with the super-resolution images to calculate the average diffusion coefficient as well as the density of localization with respect to the CCSs.
ERK1/2 activation assays
Western blot analysis was used to measure activation of ERK1/2. Previously described parental HEK 293 and β-arrestin CRISPR knockout HEK 239 cell lines41 were transfected with empty vector control, FLAG–β1AR or FLAG–β2AR expression constructs. Cells were serum starved for 18h before assay, incubated with 10 μM isoproterenol for the indicated times at 37 °C, and then washed on ice with ice-cold PBS. Cells were directly lysed in sample buffer (NuPAGE LDS Sample Buffer (Life Technologies), 100 mM dithiothreitol), sonicated three times for 10 s, boiled, separated by SDS–PAGE (Life Technologies) and transferred to a nitrocellulose membrane that was blocked with TBS Odyssey blocking buffer (LI-COR) for one hour at room temperature and then incubated overnight at 4 °C with a mouse anti-ERK1/2 primary antibody (1:2,000, Cell Signaling 4696) and a rabbit anti-phosphorylated-ERK1/2 primary antibody (1:2,000, Cell Signaling 4370). Membranes were washed three times for 5 min in TBS-Tween (0.1% v/v) and incubated with a 680-labelled anti-rabbit secondary antibody (1:5,000, LI-COR 926-68073) and an 800-labelled anti-mouse secondary antibody (1:5,000, LI-COR 926-32212) for one hour at room temperature. Membranes were washed three times for 5 min in TBS-Tween (0.1% v/v), imaged using an Odyssey Infrared Imaging System (LI-COR) in the linear range, and quantified by measuring band intensity, background subtracting, and normalizing the phosphorylated ERK1/2 band intensity to the total ERK1/2 band intensity. Data are shown as fraction of the maximum response observed across all conditions in each experiment. At least three independent experiments were performed for each condition.
Co-immunoprecipitation
Cells expressing indicated constructs were grown to confluency in 10 cm dishes and 48 hours after transfection, cells were washed twice with reaction buffer (PBS, 30 mM HEPES, pH 7.4), and then crosslinked with 2 mM DSP (Thermo Scientific) for 30 minutes at room temperature with gentle agitation. The crosslinking reaction was stopped through addition of 20 mM Tris, pH 7.5 for 15 minutes. Cells were collected, pelleted through centrifugation, lysed on ice for 10 minutes in 500 ul of ice-cold lysis buffer (0.2% Triton X-100, 150 mM NaCl, 25 mM KCl, 10 mM Tris pH 7.4, and 1 mM EDTA supplemented with a standard protease inhibitor mixture (Roche Applied Science)) and then cleared by centrifugation (14,000 × g for 15 min at 4°C).
Samples were incubated overnight at 4°C with anti-GFP antibody covalently linked to sepharose beads (1:3, Abcam ab69314), washed with lysis buffer three times, and incubated with SDS sample buffer (Invitrogen) supplemented with 100 mM dithiothreitol to elute proteins. Samples were then separated by SDS–PAGE (Life Technologies) and transferred to a nitrocellulose membrane that was blocked with TBS Odyssey blocking buffer (LI-COR) for one hour at room temperature and then incubated overnight at 4 °C with a mouse anti-adaptin β primary antibody (1:250, BD Biosciences 610382) and a rabbit anti-GFP primary antibody (1:500, Thermo Fisher Scientific A-11122). Membranes were washed three times for 5 min in TBS-Tween (0.1% v/v) and incubated with a 680-labelled anti-rabbit secondary antibody (1:5,000, LI-COR 926-68073) and an 800-labelled anti-mouse secondary antibody (1:5,000, LI-COR 926-32212) for one hour at room temperature. Membranes were washed three times for 5 min in TBS-Tween (0.1% v/v), imaged using an Odyssey Infrared Imaging System (LI-COR) in the linear range, and quantified by measuring band intensity, background subtracting, and normalizing the AP-2 immunoprecipitated band intensity to the GFP bead band intensity. Three independent experiments were performed.
Purification of β-arrestin-1
N-terminally GST-tagged rat β-arrestin-1 (amino acids 1-393) constructs in the pGEX4T vector were transformed into BL21-CodonPlus(DE3)-RIPL cells (Agilent). Cultures were grown at 37°C to an A600 of 0.6 in Terrific broth and then equilibrated to 16 °C. GST-β-arrestin-1 expression was induced with 0.1 mM isopropyl 1-thio-β-D-galactopyranoside overnight at this temperature, and cells were then harvested by centrifugation at 6,000 x g. Pellets were resuspended with cold lysis buffer (50 mM HEPES pH 8.2, 150 mM NaCl, 2 mM DTT, protease inhibitors, 1 mM EDTA). Cells were lysed by passage through an Emulsiflex press (Avestin) and cleared by centrifuge at 40,0000 x g for 50 minutes. The clarified supernatant was incubated with GST 4B resin (GE Healthcare) for 2 hours at 4 °C, and then washed two times with five columns of wash buffer (50mM HEPES pH7.4, 150mM NaCl, 2mM DTT). The GS resin with GST-β-arrestin-1 bound was resuspended in two column volumes of wash buffer, and the GST fusion protein was cleaved with 0.1mg of 3C protease per mL of GST resin overnight at 4 °C. The supernatant and first wash fraction were pooled and centrifuged at 40,000 x g for 30min. The cleared supernatant was filtered with a 0.45 μm filter, concentrated to 500 μl, and gel filtered using a Superose 6 10/300gl column (GE Life Science). β-Arrestin-1 was eluted in gel filtration buffer (30 mM HEPES, 150 mM NaCl, 2 mM MgCl2, 5%. Fractions were analyzed by SDS-PAGE, and fractions containing β-arrestin-1 were pooled and concentrated, flash-frozen in liquid N2, and stored at −80 °C.
Lipid bead binding
Equal amounts of purified β-arrestin-1 wild-type or lipid binding mutant protein were incubated with PI(4,5)P2 PIP coated beads (Echelon) for two hours at room temperature in wash/binding buffer (10 mM HEPES, pH 7.4, 0.25% NP-40, 150 mM NaCl). Samples were then washed three times with wash/binding buffer. To elute proteins, equal volumes of 2X Laemmli sample buffer was added and samples were incubated at 95°C for 5 minutes. Samples were then separated by SDS–PAGE (Life Technologies) and transferred to a nitrocellulose membrane that was blocked with TBS Odyssey blocking buffer (LI-COR) for one hour at room temperature and then for one hour at room temperature with a mouse anti-β-arrestin primary antibody (1:500, Santa Cruz Biotechnology sc-13140). Membranes were washed three times for 5 min in TBS-Tween (0.1% v/v) and incubated with an 800-labelled anti-mouse secondary antibody (1:5,000, LI-COR 926-32212) for one hour at room temperature. Membranes were washed three times for 5 min in TBS-Tween (0.1% v/v), imaged using an Odyssey Infrared Imaging System (LI-COR) in the linear range, and quantified by measuring band intensity and subtracting background intensity. Four independent experiments were performed.
Molecular dynamics simulations
We analyzed sets of molecular dynamics simulations for each of two conditions: (1) simulations initiated from the inactive state arrestin-2 crystal structure (PDB entry 1G4M, chain A) and (2) simulations initiated from the active state arrestin-2 crystal structure bound to the phosphorylated C-tail of the V2 vasopressin receptor (PDB entry 4JQI). For the latter condition, we removed the co-crystallized Fab30 antibody. We performed six simulations for each condition. For each simulation, initial atom velocities were assigned randomly and independently. These simulations correspond to simulations 40 to 51 in Table S2 of the accompanying manuscript. See that manuscript for details regarding simulation setup and simulation protocols.
Simulations were visualized and analyzed using Visual Molecular Dynamics (VMD)55. Simulations were inspected visually for interactions that formed in the inactive state but not the active state. We noticed that Glu313 occasionally formed a salt bridge with Lys77 in the inactive state, persisting for up to hundreds of nanoseconds. We quantified the frequency of salt bridge formation by calculating the minimum distance between heavy atoms of Lys77 and Glu313 across all simulations under each condition.
Statistical Analysis
Quantitative data are expressed as the mean and error bars represent the standard error of the mean (s.e.m.) unless otherwise indicated. Scatter plots are overlaid with mean and s.e.m.. Statistical significance between conditions was analyzed using a two-tailed t-test or with Welch’s correction for unequal variance and a one-way ANOVA (alpha = 0.05) with calculated using Prism 7.0 software (GraphPad Software, Inc). * p < 0.05; ** p < 0.01; *** p < 0.001 when compared with control or no treatment conditions. All experiments showing representative data were repeated at least three times independent times with similar results. Independent experiments represent independent biological replicates.
Data availability
The data that support the findings of this study are available from the authors upon on reasonable request.
Extended Data
Extended Data Figure 1. Verification of GPCR-specificity of the discrete β-arrestin trafficking mechanism, demonstration that this mechanism produces super-stoichiometric β-arrestin accumulation in CCSs and that its activation does not require the GPCR tail.
(a) Average β-arrestin-2–GFP enrichment at CCSs in cells expressing FLAG-β1AR after the following treatments: 10 μM isoproterenol (green, n=14 cells), 15 minute pretreatment with 10 μM CGP 20712A and 10 μM isoproterenol treatment (red, n=12 cells), 10 μM CGP 20712A alone (gray, n=12 cells). Data shown for the 10 μM isoproterenol condition are replotted from Figure 1b. (b) Maximum β-arrestin-2–GFP enrichment at CCSs in HEK 293 cells transfected with the indicated receptor or empty vector and treated with 10 μM isoproterenol. (c) β-arrestin-2–GFP enrichment at CCSs in H9c2 cells without GPCR overexpression and treated with 10 μM isoproterenol or 10 μM dobutamine (n=5 or 4 cells, respectively, from 2 independent experiments). (d) β-arrestin-2–GFP enrichment at CCSs in H9c2 cells without GPCR overexpression and treated as indicated (n=12 cells). (e) Live cell TIRF microscopy images (representative of n=3 independent experiments) showing FLAG–β1AR (blue), β-arrestin-1–mVenus (green) and clathrin-light-chain–DsRed (red) before and after 10 μM isoproterenol treatment. (f) Enrichment into CCSs (n=7 cells from 3 independent experiments). (g) Maximum β-arrestin-1–mVenus enrichment at CCSs in HEK 293 cells transfected with FLAG-β1AR or empty vector and treated with 10 μM isoproterenol (n=7 and 11 cells from 3 independent experiments, p=0.0023 using an unpaired t test with Welch’s correction). (h) Average β-arrestin-2–GFP enrichment at CCSs in cells expressing FLAG-β2AR after the following treatments: 10 μM isoproterenol (green, n=15 cells), 15 minute pretreatment with 10 μM ICI 118,551 and then 10 μM isoproterenol treatment (red, n=14 cells), 10 μM μM ICI 118,551 (gray, n=12). Data shown for the 10 μM isoproterenol condition are replotted from Figure 1d. (i) Fluorescence intensity profiles from lines shown in Figure 1e. (j) Time-dependent correlation coefficient of line scans across cells derived from immobilization experiments shown in Figure 1g, h; n=3). (k) Live cell TIRF microscopy images (representative of n=3 independent experiments) showing FLAG–β2AR-GFP and clathrin-light-chain–DsRed (red) before and after 10 μM isoproterenol treatment. Fluorescence from the Alexa647 conjugated FLAG antibody shown in blue and GFP fluorescence shown in green. (l) Difference in GFP and Alexa647 fluorescence enrichment at CCSs in cells co-expressing FLAG-β1ARs (red), FLAG-β2ARs (blue) and β-arrestin-2-GFP or FLAG-β2AR-GFP (black). Cells were labeled with Alexa647 conjugated FLAG antibody for 10 minutes prior to live cell imaging. Data were derived from the experiments shown in Figure 1a, b (blue line, n=14 cells from 3 independent experiments), Figure 1c, d (red line, n=15 cells from 3 independent experiments), and Extended Data Figure 1k (black line n=12 cells from 3 independent experiments). (m) Plot of β-arrestin/GPCR stoichiometry calculated from the data displayed in panel k, calibrated according to the doubly labeled FLAG-β2AR-GFP reference construct defining 1:1 stoichiometry (For β1AR and β2AR, n=14 and 15 cells, respectively, from 3 independent experiments). A correction index was calculated by dividing GFP fluorescence by Alexa647 (FLAG) fluorescence in CCSs. This correction index was then applied to receptor and β-arrestin-2 enrichment in CCSs to determine β-arrestin-2/GPCR stoichiometry throughout the time course. Images were captured continuously at 0.5 Hz and stoichiometry values over the time course were calculated using a rolling average with 50-frame window size. Scale bar, 5 μm. Scatter plots show overlay of mean and s.e.m. (a, d, h, j, l) show data as mean ± s.e.m. ** p < 0.01
Extended Data Figure 2. Additional demonstration that multiple GPCRs can activate the discrete β-arrestin trafficking mechanism.
(a) Live cell TIRF microscopy images showing FLAG–mu opioid receptor (MOR, blue), β-arrestin-2–GFP (green) and clathrin-light-chain–DsRed (red) before and after 10 μM DAMGO treatment. (b) Average FLAG-MOR and β-arrestin-2–GFP enrichment at CCSs after treatment with 10 μM DAMGO (n=12 cells). (c) Maximum β-arrestin-2–GFP enrichment at CCSs for HEK 293 cells expressing FLAG-MOR or empty vector and treated with 10 μM DAMGO (n=12 cells per condition from 3 independent experiments; p=<0.0001 using a two-tailed unpaired t test with Welch’s correction). (d) Live cell TIRF microscopy images showing FLAG–kappa opioid receptor (KOR, blue), β-arrestin-2–GFP (green) and clathrin-light-chain–DsRed (red) before and after 10 μM dynorphin treatment. (e) Enrichment into CCSs after bath application of 10 μM dynorphin (n=18 cells). (f) Maximum β-arrestin-2–GFP enrichment at CCSs in HEK 293 cells expressing FLAG-KOR or empty vector and treated with 10 μM dynorphin (n=18, 13 cells, respectively, from 3 independent experiments; p=0.0028 using a two-tailed unpaired t test with Welch’s correction). (g) Live cell TIRF microscopy images showing FLAG–DRD2 (blue), β-arrestin-2–GFP (green) and clathrin-light-chain–DsRed (red), before and after 10 μM quinpirole treatment. (h) Enrichment into CCSs after bath application of 10 μM quinpirole (n=12 cells). (i) Maximum β-arrestin-2–GFP enrichment at CCSs in cells expressing FLAG-DRD2 or untransfected and treated with 10 μM quinpirole (n=11, 12 cells from 3 independent experiments; p=0.0095 using a two-tailed unpaired t test with Welch’s correction). (a, d, g) show representative images from 3 independent experiments. (b, e, h) show data as mean ± s.e.m. Scatter plots show overlay of mean and s.e.m. Scale bars, 5 μm. * p < 0.05; ** p < 0.01; *** p < 0.001
Extended Data Figure 3. Direct interaction with the GPCR, but not the GPCR cytoplasmic tail, is required for β-arrestin trafficking activation.
(a) Live cell TIRF microscopy images showing FLAG–β1AR truncated at the 415th amino acid (415T, blue), β-arrestin-2–GFP (green) and clathrin-light-chain–DsRed (red) before and after 10 μM isoproterenol treatment. (b) Maximum β-arrestin-2–GFP enrichment at CCSs after 10 μM isoproterenol for cells co-expressing the indicated FLAG–β1AR receptor (n=10, 12 cells, respectively, from 3 independent experiments, p=0.5825 calculated using a two-tailed unpaired t test). (c) Live cell TIRF microscopy images showing FLAG–β2AR truncated at the 365th amino acid (365T, blue), β-arrestin-2–GFP (green) and clathrin-light-chain–DsRed (red) before and after 10 μM isoproterenol treatment. (d) Maximum β-arrestin-2–GFP enrichment at CCSs in HEK 293 cells treated with 10 μM isoproterenol and either transfected with FLAG-β2AR or empty vector (n=11, 13 cells, respectively, from 3 independent experiments, p=0.0269 calculated using a two-tailed unpaired t test with Welch’s correction). (e) Maximum β-arrestin-2–GFP enrichment at CCSs for cells co-expressing the indicated FLAG–β2AR receptor and treated with 10 μM isoproterenol (n=12 cells from 3 independent experiments, p=0.0606 calculated using a two-tailed unpaired t test). (f) Live cell TIRF microscopy images showing FLAG–DRD2 (blue), β-arrestin-2–GFP (green) and clathrin-light-chain–DsRed (red) before and after 10 μM quinpirole treatment. (g) Initial enrichment in CCSs before 10 μM quinpirole treatment and (h) maximum enrichment after 10 μM quinpirole treatment (n=12 cells from 3 independent experiments; p=0.19 and 0.4873, respectively, using a two-tailed unpaired t test). (i) Live cell TIRF microscopy images showing FLAG–β1AR (blue), β-arrestin-2–GFP (green) and clathrin-light-chain–DsRed (red) before and after 5 μM forskolin (fsk) treatment. (j) Initial enrichment in CCSs before 5 μM forskolin (fsk) treatment and (k) maximum enrichment after 5 μM fsk treatment (n=12 cells from 3 independent experiments; p=0.6325 and 0.0971, respectively, using a two-tailed unpaired t test). (l) Live cell TIRF microscopy images showing FLAG–β2AR (blue), β-arrestin-2–GFP KNC mutant (green) and clathrin-light-chain–DsRed (red before and after 10 μM isoproterenol treatment. (m) Initial enrichment in CCSs before 10 μM isoproterenol treatment and (n) maximum enrichment after 10 μM isoproterenol (n=9 (WT) or 8 (KNC) cells from 3 independent experiments; p=0.6681(m) and p=0.001 (n) using a two-tailed unpaired t test with Welch’s correction). (a, c, f, I, l) show representative images from 3 independent experiments. Scatter plots show overlay of mean and s.e.m. Scale bars, 5 μm. * p < 0.05, ** p < 0.01
Extended Data Figure 4. Additional verification that charge mutations in the finger loop-proximal region of β-arrestin finger loop produce a constitutive activation phenotype.
(a) Live cell TIRF microscopy images showing FLAG–β2AR, clathrin-light-chain–DsRed (red), and the polar core mutant of β-arrestin-2–GFP (green) in the absence of agonist treatment. (b) Clustering index of β-arrestin-2–GFP for the indicated construct in the absence of agonist treatment. Statistical significance was calculated using an two-tailed unpaired t test with Welch’s correction (polar core mutant: n=12 cells from 3 independent experiments, p<0.0001; finger loop proximal mutant: n=16 cells from 3 independent experiments p<0.0001; R77A: n=12 cells from 3 independent experiments, p=0.0403; K78A: n=12 cells from 3 independent experiments, p=0.0016). WT and finger loop proximal mutant data replotted from Figure 3b. (c) Association of β-arrestin-2–GFP constructs with the adaptin beta subunit of AP-2 in the absence of agonist treatment. Molecular mass markers (in kDa) are shown on the right side of blots. For gel source data, see Supplementary Figure 1. The representative Western blots in panel c are representative of 3 independent experiments, quantified in (d), and shown as AP-2/GFP intensity in the immunoprecipitation conditions (n=3 independent experiments, p=0.0218 using a two-tailed unpaired t test). (e) Measurement of β-arrestin-2–GFP construct expression in cell lysates from panel c. (f–i) Live cell TIRF microscopy images showing FLAG–β2AR, clathrin-light-chain–DsRed (red), and β-arrestin-2–GFP with the indicated point mutations (green) in the absence of agonist treatment. Detailed description of β-arrestin mutations are provided in Extended Data Table 1. (a, f–i) show representative images from 3 independent experiments. Scatter plots show overlay of mean and s.e.m. Scale bars, 5 μm. * p < 0.05; ** p < 0.01; *** p < 0.001
Extended Data Figure 5. Molecular dynamics simulations suggest that finger loop-proximal charged residues stabilize β-arrestin in an inactive state.
(a) Crystal structures of β-arrestin-1 (left) in an inactive (middle) and active (right) conformation reveal an extensive network of polar residues proximal to the finger loop involving residues R76, K77 and D78. (b) Histogram of distances between K77 and E313 in simulations of inactive arrestin (blue) and active arrestin (pink), showing frequency of K77-E313 salt bridge formation. The K77-E313 distance corresponds to the minimum distance between polar heavy atoms on the two residues’ side chains. A separation distance of less than 3.0 Å corresponds to formation of the salt bridge. For the six simulations started from the inactive state, the salt bridge formed 1.1%, 5.7%, 6.3%, 17.6%, 1.0%, and 2.0% of the time, respectively (simulation lengths were 4.7 μs, 3.1 μs, 2.9 μs, 5.1 μs, 5.2 μs, and 5.7 μs, respectively). For the six simulations started from the active state, the salt bridge formed 0.02%, 0.04%, 0.0%, 1.1%, 0.0%, and 0.0% of the time, respectively (simulation lengths were 5.0 μs, 5.0 μs, 4.7 μs, 4.8 μs, 4.8 μs, and 5.0 μs, respectively). (c) Inactive state crystal structure of β-arrestin-1 in which E313 interacts with R188 on a different β-arrestin-1 molecule in the crystal lattice. (d) Sequence alignment of arrestins showing conservation of residues R76, K77, D78, and E313. Detailed description of β-arrestin mutations are provided in Extended Data Table 1.
Extended Data Figure 6. Verification that the conserved phosphoinositide binding determinant in the β-arrestin C-domain is specifically required for the catalytic trafficking mechanism and operates upstream of clathrin and AP-2 binding interactions.
Graphical representation of β-arrestin interaction domains without (a) and with (b) βAR activation by isoproterenol. (c) Live cell TIRF microscopy images showing FLAG–β2AR (blue), β-arrestin-2-GFP (green), and clathrin-light-chain–DsRed (red) before and after 10 μM isoproterenol treatment. (d) Live cell TIRF microscopy images showing FLAG–β2AR (blue), β-arrestin-2-GFP lipid mutant (green), and clathrin-light-chain–DsRed (red) before and after 10 μM isoproterenol treatment. (e) Representative western blot (from 4 independent experiments) of purified wild-type and lipid mutant versions of β-arrestin-1(1-393) immunoprecipitation with PIP2-coated agarose beads and quantified in (f) as percent of input protein (n=4 independent experiments, p=0.0142 using a two-tailed unpaired t test). For gel source data, see Supplementary Figure 1. (g) Live cell TIRF microscopy images showing FLAG–β2AR (blue), β-arrestin-2-GFP (F191G, L192G) lipid anchor mutant mutant (green), and clathrin-light-chain–DsRed (red) before and after 10 μM isoproterenol treatment. (h) Maximum β-arrestin-2–GFP enrichment at CCSs in cells expressing the indicated β-arrestin-2–GFP construct and treated with 10 μM isoproterenol (n=12 cells from 3 independent experiments; p=0.9227 calculated using a two-tailed unpaired t test). (i) Live cell TIRF microscopy images showing FLAG–β2AR (blue), β-arrestin-2-GFP CCS mutant (green), and clathrin-light-chain–DsRed (red) before and after with 10 μM isoproterenol. (j) Representative images of HEK 293 cells co-expressing FLAG–β2AR (blue), β-arrestin-2-GFP lipid and CCS mutant (green), and clathrin-light-chain–DsRed (red) before and after with 10 μM isoproterenol. Representative β-arrestin images false colored to indicate fluorescence intensity, maximum fluorescence enrichment at CCSs, and normalized average plasma membrane (PM) β-arrestin-2–GFP fluorescence (data shown as mean ± s.e.m.), respectively, from cells co-expressing FLAG–β1ARs (n=12 cells per condition) without isoproterenol treatment (k–m), and the following β-arrestin-2–GFP constructs with 10 μM isoproterenol treatment: wild-type (n–p), lipid mutant (q–s), CCS mutant (t–v), and CCS and lipid mutant (w–y). Wild-type β-arrestin-2–GFP maximum enrichment at CCSs shown in panels r, u, x is replotted from panel o. Live cell TIRF microscopy images showing cells before and after 10 μM isoproterenol treatment and co-expressing FLAG–β1AR (blue), clathrin-light-chain–DsRed (red), and the following GFP labeled versions of β-arrestin-2 (green): (z) wild-type, (aa) lipid mutant, and (ab) CCS mutant, and (ac) CCS and lipid mutant. (ad) Live cell TIRF microscopy images showing FLAG-β2AR and the indicated β-arrestin-2-GFP construct in the absence of agonist treatment. (ae) Clustering index of β-arrestin-2–GFP for the indicated construct in the absence of agonists treatment. Detailed description of β-arrestin mutations are provided in Extended Data Table 1. (c, d, g, i, j, k, n, q, t, w, z, aa, ab, ac, ad) show representative images from 3 independent experiments. For (r, u, x) n=12 cells from 3 independent experiments; statistical significance was calculated using an unpaired t test with Welch’s correction, p=0.0007, 0.0018, and 0.0012, respectively. For (ae), statistical significance was calculated using an unpaired t test with Welch’s correction, n=12 (WT) and 16 (finger loop proximal mutant) from 3 independent experiments, p<0.0001; n=12 (WT) and 15 (finger loop proximal & lipid mutant) from 3 independent experiments, p=0.5464). WT and finger loop proximal mutant data replotted from Figure 3b. Scatter plots show overlay of mean and s.e.m. Scale bars, 5 μm. ** p < 0.01
Extended Data Figure 7. Phosphoinositide binding is essential for catalytic activation of β-arrestin trafficking but is dispensable for trafficking mediated by the scaffold mechanism.
(a) Live cell microscopy images of HEK 293 cells co-expressing FLAG–β2AR-V2R C tail (blue), β-arrestin-2-GFP CCS mutant (green), and clathrin-light-chain–DsRed (red) before and after with 10 μM isoproterenol treatment. (b) Normalized plasma membrane (PM) fluorescence of β-arrestin-2–GFP lipid mutant in cells co-expressing FLAG–β2AR-V2R (n=12 cells from 3 independent experiments) when treated with 10 μM isoproterenol. (c) Maximum β-arrestin-2–GFP enrichment at CCSs in cells expressing indicated β-arrestin-2–GFP construct before and after activation of FLAG-β2AR-V2R C tail with 10 μM isoproterenol (n=10, 12 cells, respectively, from 3 independent experiments; p=0.6433 using a two-tailed unpaired t test). (d) Live cell microscopy images of COS-1 cells co-expressing FLAG–β2AR (blue), β-arrestin-2-GFP (green), and clathrin-light-chain–DsRed (red) that have been pre-treated for 1 hour with 1 μM phenylarsine oxide (PAO) or vehicle (DMSO) before 10 μM isoproterenol treatment. (e) Normalized average fold over initial β-arrestin-2–GFP fluorescence in cells co-expressing FLAG–β2AR when pre-treated for 1 hour with 1 μM phenylarsine oxide (PAO) before 10 μM isoproterenol treatment (n=12 cells from 3 independent experiments). (f) Live cell microscopy images of COS-1 cells co-expressing FLAG–β2AR-V2R C tail (blue), β-arrestin-2-GFP (green), and CLC-dsRed (red) that have been pre-treated for 1 hour with 1 μM phenylarsine oxide (PAO) before before 10 μM isoproterenol treatment. (g) Normalized average fold over initial β-arrestin-2–GFP fluorescence in cells co-expressing FLAG–β2AR or FLAG–β2AR-V2R when pre-treated for 1 hour with 1 μM phenylarsine oxide (PAO) before 10 μM isoproterenol treatment (n=12 cells from 3 independent experiments). (a, d, f) show representative images from 3 independent experiments. (b, e, g) show data as mean ± s.e.m. Scatter plots show overlay of mean and s.e.m.
Extended Data Figure 8. sptPALM controls and mean square displacement (MSD) plots and cellular model.
(a) Representative image of a clathrin mask (green) generated from a CLC-GFP image (red). Representative diffusion maps overlaid with the clathrin mask for HEK 293 cells and treated with 10 μM isoproterenol expressing (b) PAmCherry-β1AR, (c) PAmCherry-β2AR, (d) β-arrestin-2-PAmCherry coexpressed with FLAG-β1AR, (e) β-arrestin-2-PAmCherry coexpressed with FLAG-β2AR (f) Distribution of diffusion coefficients (D) of false positive detections from HEK 293 cells expressing FLAG-β2AR and imaged under standard sptPALM acquisition conditions to determine contribution of false positive detections in the experimental setup and analysis. (g) Distribution of diffusion coefficients (D) of PAmCherry-β2AR, PAmCherry-PLCδ1-PH, and β-arrestin-2-PAmCherry in live cells imaged at 37°C after treatment with 10 μM isoproterenol (n=13, 21, and 8 cells, respectively). Black lines show diffusion coefficient profiles that have not been corrected for false positive detections, showing limited contribution to the profiles. β-arrestin-2-PAmCherry and PAmCherry-PLCδ1-PH were co-expressed individually with FLAG-β2AR. (h) Average MSD plots derived from sptPALM analysis of PAmCherry-β1AR and PAmCherry-β2AR trajectories in HEK 293 cells treated with 10 μM isoproterenol (n=8 and 13 cells, respectively). (i) Distribution of diffusion coefficients (D) of β-arrestin-2-PAmCherry wild-type and CCS mutant when co-expressed with FLAG-β1AR in live HEK 293 cells imaged at 37°C after treatment with 10 μM isoproterenol (n=13 and 17 cells, respectively). Black lines show diffusion coefficient profiles that have not been corrected for false positive detections, showing limited contribution to the profiles. (j) Average MSD plots derived from sptPALM analysis of β-arrestin-2-PAmCherry wild-type and CCS mutant trajectories in cells co-expressing FLAG-β1AR and treated with 10 μM isoproterenol (n=13 and 17 cells, respectively). (k) Distribution of diffusion coefficients (D) of β-arrestin-2-PAmCherry wild-type and CCS mutant when co-expressed with FLAG-β2AR in live cells imaged at 37°C after treatment with 10 μM isoproterenol (n=21 and 10 cells, respectively). Black lines show diffusion coefficient profiles that have not been corrected for false positive detections, showing limited contribution to the profiles. β-arrestin-2-PAmCherry diffusion coefficient profiles when activated by the β2AR are replotted from panel d. (l) Average MSD plots derived from sptPALM analysis of β-arrestin-2-PAmCherry wild-type and CCS mutant trajectories in HEK 293 cells co-expressing FLAG-β2AR and treated with 10 μM isoproterenol (n=21 and 10 cells, respectively). (m) Immobile and (n) mobile β-arrestin-2-PAmCherry trajectory detections overlaid with a clathrin marker (red) in live cells co-expressing FLAG-β1AR after 10 μM isoproterenol treatment. (o) Immobile and (p) mobile β-arrestin-2-PAmCherry trajectory detections overlaid with a clathrin marker (red) in live cells co-expressing FLAG-β2AR after 10 μM isoproterenol treatment. Trajectory detections are false colored based on the density of detections at each pixel. Error bars represent s.e.m; in some cases, error bars are smaller than the height of the symbol and, therefore, not shown. Scale bars, 500 nm for sptPALM images. (q) Proposed cellular pathway for catalytic activation of β-arrestin. (r) Representative microscopy images of COS-1 cells co-expressing FLAG-β2AR, β-arrestin-2-GFP (green), and clathrin-light-chain-DsRed (red) that were treated with 10 μM isoproterenol for 3 minutes. Then, β-arrestin-2-GFP was photobleached in the indicated yellow region (shown in inset; insets are also shown in Figure 5h). (a, b, c, d, e, m, n, o, p, and r) show representative examples from at least 3 independent experiments. (f–l) show data as mean ± s.e.m; in some cases, error bars are smaller than the height of the symbol and, therefore, not shown. Scale bars, 500 nm for sptPALM images; 5 μm for FRAP larger images and 0.5 μm for the insets.
Extended Data Figure 9. Differences in the bioenergetics of catalytic versus scaffold mechanisms of regulated β-arrestin trafficking and β-arrestin-dependent activation of ERK1/2 promoted by catalytic activation.
(a) Schematic depicting the proposed co-existence of catalytic and scaffolding mechanisms of β-arrestin trafficking tuned according to tail binding affinity, emphasizing the difference in tail versus core interactions (shaded boxes). The tail interaction, requiring GPCR phosphorylation (Rp) drives the scaffold mechanism through its essential role in stable GPCR/β-arrestin complex formation. The core interaction mediates catalysis by providing a kinetically favorable path for β-arrestin to remain captured at the PM irrespective of GPCR dissociation. Such capture requires phosphoinositide binding to the β-arrestin C-domain, explaining why the phosphoinositide requirement is specific to the catalytic mechanism and can be overcome by formation of a sufficiently sufficient stable scaffold complex requiring the phosphorylated GPCR tail. Primary energy inputs maintaining each proposed trafficking cycle are indicated by red arrows. The present results identify a specific requirement of the catalytic mechanism for phosphoinositide binding to the C-domain but they do not exclude binding also in the scaffold complex (which we think is likely). We also cannot presently rule out the possible existence of additional interaction(s) in the catalytic mechanism, such as phosphoinositide binding also to the β-arrestin N-domain that has the potential to displace the β-arrestin C-terminus24. (b) Representative images (from 3 independent experiments) before and after 10 μM isoproterenol treatment of cells expressing chimeric FLAG-tagged β1AR-V2Rs and imaged live with TIRF microscopy. Profiles of FLAG-β2AR and β-arrestin-2–GFP average enrichment into CCSs in COS-1 cells expressing either an empty vector construct (c) or GRK2 (d) and treated with 10 μM isoproterenol (n=15 or 12 cells, respectively, from 3 independent experiments). (e) Difference in enrichment values between β-arrestin-2–GFP and β2AR from panels c and d showing the effect of GRK2 overexpression. (f) Representative western blot showing phosphorylated ERK1/2 and total ERK1/2 signal in extracts prepared from parental or β-arrestin knockout CRISPR HEK 293 cells expressing FLAG–β1AR and exposed to 10 μM isoproterenol for the indicated time period. (g) Quantification of ERK1/2 activation from the western blots in panel a (n=5 independent experiments, p=0.004 using a one-way ANOVA). (h) Representative western blot showing phosphorylated ERK1/2 and total ERK1/2 signal in extracts prepared from parental or β-arrestin knockout CRISPR HEK 293 cells expressing FLAG–β2AR and exposed to 10 μM isoproterenol for the indicated time period. (i) Quantification of ERK1/2 activation from the western blots in panel c (n=5 independent experiments). (f) and (h) show representative Western blots from 5 independent experiments. Data shown as mean ± s.e.m. For gel source data, see Supplementary Figure 1. Error bars represent s.e.m. ** p < 0.01
Extended Data Table 1. Summary and description of β-arrestin mutations.
Mutations are in β-arrestin-2 unless otherwise indicated.
| Mutation name | Mutations | Description | Phenotype |
|---|---|---|---|
| CCS mutant | L373A, I374A, F376A, E375K, E377K, R393A, R395A | Clathrin & AP-2 binding deficient from mutation in C-terminus | Recruits to plasma membrane but not to CCSs |
| Lipid mutant | K233Q R237Q, K251Q (K232Q, R236Q, K250Q in β-arrestin-1) | Lipid binding deficient from mutation in C-lobe. Residues not well conserved in visual arrestin. | Not recruited to plasma membrane nor to CCSs |
| Lipid & CCS mutant | K233Q, R237Q, K251Q, L373A, I374A, F376A, E375K, E377K, R393A, R395A | Lipid, clathrin, & AP-2 binding deficient from mutations in C-lobe and C-terminus | Not recruited to plasma membrane nor to CCSs |
| Finger loop proximal mutant | R77A, K78A, D79A (R76A, K77A, D78A in β-arrestin-1] | Triple alanine mutations in the region proximal to the finger loop | Constitutively activating – association with CCSs without GPCR activation |
| K78E | K78E [K77E in β-arrestin-1) | Charge swap mutation of single residue from cluster of finger loop proximal mutations | Constitutively activating – association with CCSs without GPCR activation |
| E314K | E314K [E313Kin β-arrestin-1) | Charge swap mutation of residue in C lobe | Constitutively activating – association with CCSs without GPCR activation |
| K78E E314K | K78E E314K [K77E E313K in β-arrestin-1) | Double charge swap mutations restoring putative salt bridge | Abrogates constitutively activating phenotype produced by single charge swap mutants |
| KNC mutant | K11A, K12A, L49A, D51A, R52A, L69A, Y239A, D241A, C252A, P253A, D260A and Q262A | 12 alanine mutations disrupting GPCR binding | Not recruited to plasma membrane nor to CCSs |
| F191G, L192G | F191G, L192G Lipid anchor mutant | Charge mutation of lipid anchor region that is conserved between visual and β-arrestins | Enriched at CCSs comparable to WT |
| Polar core mutant | D386A, D387A, D388A | Triple alanine mutation in β-arrestin polar core region | Constitutively activating – association with CCSs without GPCR activation |
Supplementary Material
Acknowledgments
We thank J. Benovic, V. Gurevich, A. Inoue, and S. Gutkind for sharing reagents and valuable discussion. We thank T. Balla, J. Fraser, B. Kobilka, R. Lefkowitz, M. Lohse, A. Manglik, B. Shoichet, M. Sommer, and R. Sunahara for valuable discussion, and B. Lobingier, K. Varandas and other von Zastrow laboratory members for valuable discussion. We thank W. Huynh and R. Vale for essential contributions with protein purification. All live cell imaging experiments were performed in the Nikon Imaging Center at UCSF. K.E. and N.R.L. are recipients of National Science Foundation Graduate Research Fellowships. M.M. is a recipient of an American Heart Association Postdoctoral Fellowship.
Footnotes
The authors declare no competing financial interests.
Author Contributions
K.E., D.J., B.B., N.R.L., R.O.D., M.v.Z designed research. D.J. performed and analyzed single molecule imaging experiments. B.B performed and analyzed FRAP imaging experiments. K.E. performed and analyzed all other imaging and biochemical experiments. N.R.L performed and analyzed molecular dynamics simulations. M.M. provided important advice and assistance with in vitro studies. J.-B.S provided software and advice for single molecule analysis. K.E., M.v.Z. wrote the paper with input from all authors.
References
- 1.Rosenbaum DM, Rasmussen SGF, Kobilka BK. The structure and function of G-protein-coupled receptors. Nature. 2009;459:356–363. doi: 10.1038/nature08144. [DOI] [PMC free article] [PubMed] [Google Scholar]
- 2.Lohse MJ, Benovic JL, Codina J, Caron MG, Lefkowitz RJ. beta-Arrestin: a protein that regulates beta-adrenergic receptor function. Science. 1990;248:1547–1550. doi: 10.1126/science.2163110. [DOI] [PubMed] [Google Scholar]
- 3.Kang DS, Tian X, Benovic JL. Role of β-arrestins and arrestin domain-containing proteins in G protein-coupled receptor trafficking. Curr Opin Cell Biol. 2014;27:63–71. doi: 10.1016/j.ceb.2013.11.005. [DOI] [PMC free article] [PubMed] [Google Scholar]
- 4.Pierce KL, Premont RT, Lefkowitz RJ. Seven-transmembrane receptors. Nat Rev Mol Cell Biol. 2002;3:639–650. doi: 10.1038/nrm908. [DOI] [PubMed] [Google Scholar]
- 5.Gurevich EV, Gurevich VV. Arrestins: ubiquitous regulators of cellular signaling pathways. Genome Biol. 2006;7:236. doi: 10.1186/gb-2006-7-9-236. [DOI] [PMC free article] [PubMed] [Google Scholar]
- 6.Lohse MJ, Hoffmann C. Arrestins - Pharmacology and Therapeutic Potential. Springer; Berlin, Heidelberg: 2014. Arrestin Interactions with G Protein-Coupled Receptors; pp. 15–56. [DOI] [PubMed] [Google Scholar]
- 7.Shukla AK, Xiao K, Lefkowitz RJ. Emerging paradigms of β-arrestin-dependent seven transmembrane receptor signaling. Trends Biochem Sci. 2011;36:457–469. doi: 10.1016/j.tibs.2011.06.003. [DOI] [PMC free article] [PubMed] [Google Scholar]
- 8.Gurevich VV, Gurevich EV. The structural basis of arrestin-mediated regulation of G-protein-coupled receptors. Pharmacol Ther. 2006;110:465–502. doi: 10.1016/j.pharmthera.2005.09.008. [DOI] [PMC free article] [PubMed] [Google Scholar]
- 9.Shukla AK, et al. Structure of active β-arrestin-1 bound to a G-protein-coupled receptor phosphopeptide. Nature. 2013;497:137–141. doi: 10.1038/nature12120. [DOI] [PMC free article] [PubMed] [Google Scholar]
- 10.Nuber S, et al. β-Arrestin biosensors reveal a rapid, receptor-dependent activation/deactivation cycle. Nature. 2016;531:661–664. doi: 10.1038/nature17198. [DOI] [PMC free article] [PubMed] [Google Scholar]
- 11.Scheerer P, Sommer ME. Structural mechanism of arrestin activation. Curr Opin Struct Biol. 2017;45:160–169. doi: 10.1016/j.sbi.2017.05.001. [DOI] [PubMed] [Google Scholar]
- 12.Shukla AK, et al. Visualization of arrestin recruitment by a G-protein-coupled receptor. Nature. 2014;512:218–222. doi: 10.1038/nature13430. [DOI] [PMC free article] [PubMed] [Google Scholar]
- 13.Park JY, Lee SY, Kim HR, Seo MD, Chung KY. Structural mechanism of GPCR-arrestin interaction: recent breakthroughs. Arch Pharm Res. 2016;39:293–301. doi: 10.1007/s12272-016-0712-1. [DOI] [PubMed] [Google Scholar]
- 14.Cahill TJ, et al. Distinct conformations of GPCR–β-arrestin complexes mediate desensitization, signaling, and endocytosis. Proceedings of the National Academy of Sciences. 2017;114:2562–2567. doi: 10.1073/pnas.1701529114. [DOI] [PMC free article] [PubMed] [Google Scholar]
- 15.Lee MH, et al. The conformational signature of β-arrestin2 predicts its trafficking and signalling functions. Nature. 2016;531:665–668. doi: 10.1038/nature17154. [DOI] [PMC free article] [PubMed] [Google Scholar]
- 16.Kumari P, et al. Functional competence of a partially engaged GPCR–β-arrestin complex. Nat Commun. 2016;7:13416. doi: 10.1038/ncomms13416. [DOI] [PMC free article] [PubMed] [Google Scholar]
- 17.Kumari P, et al. Core engagement with β-arrestin is dispensable for agonist-induced vasopressin receptor endocytosis and ERK activation. Mol Biol Cell. 2017;28:1003–1010. doi: 10.1091/mbc.E16-12-0818. [DOI] [PMC free article] [PubMed] [Google Scholar]
- 18.Eichel K, Jullié D, von Zastrow M. β-Arrestin drives MAP kinase signalling from clathrin-coated structures after GPCR dissociation. Nat Cell Biol. 2016;18:303–310. doi: 10.1038/ncb3307. [DOI] [PMC free article] [PubMed] [Google Scholar]
- 19.Branco AF, et al. Isoproterenol Cytotoxicity is Dependent on the Differentiation State of the Cardiomyoblast H9c2 Cell Line. Cardiovasc Toxicol. 2011;11:191. doi: 10.1007/s12012-011-9111-5. [DOI] [PubMed] [Google Scholar]
- 20.Puthenveedu MA, von Zastrow M. Cargo regulates clathrin-coated pit dynamics. Cell. 2006;127:113–124. doi: 10.1016/j.cell.2006.08.035. [DOI] [PubMed] [Google Scholar]
- 21.Santini F, Gaidarov I, Keen JH. G protein–coupled receptor/arrestin3 modulation of the endocytic machinery. J Cell Biol. 2002;156:665–676. doi: 10.1083/jcb.200110132. [DOI] [PMC free article] [PubMed] [Google Scholar]
- 22.Barak LS, Ferguson SS, Zhang J, Caron MG. A beta-arrestin/green fluorescent protein biosensor for detecting G protein-coupled receptor activation. J Biol Chem. 1997;272:27497–27500. doi: 10.1074/jbc.272.44.27497. [DOI] [PubMed] [Google Scholar]
- 23.Mondin M, et al. Neurexin-neuroligin adhesions capture surface-diffusing AMPA receptors through PSD-95 scaffolds. J Neurosci. 2011;31:13500–13515. doi: 10.1523/JNEUROSCI.6439-10.2011. [DOI] [PMC free article] [PubMed] [Google Scholar]
- 24.Xiao K, Shenoy SK, Nobles K, Lefkowitz RJ. Activation-dependent Conformational Changes in β-Arrestin 2. J Biol Chem. 2004;279:55744–55753. doi: 10.1074/jbc.M409785200. [DOI] [PubMed] [Google Scholar]
- 25.Nobles KN, Guan Z, Xiao K, Oas TG, Lefkowitz RJ. The active conformation of beta-arrestin1: direct evidence for the phosphate sensor in the N-domain and conformational differences in the active states of beta-arrestins1 and -2. J Biol Chem. 2007;282:21370–21381. doi: 10.1074/jbc.M611483200. [DOI] [PubMed] [Google Scholar]
- 26.McCorvy JD, et al. Structure-inspired design of β-arrestin-biased ligands for aminergic GPCRs. Nat Chem Biol. 2018;14:126–134. doi: 10.1038/nchembio.2527. [DOI] [PMC free article] [PubMed] [Google Scholar]
- 27.Gimenez LE, Babilon S, Wanka L, Beck-Sickinger AG, Gurevich VV. Mutations in arrestin-3 differentially affect binding to neuropeptide Y receptor subtypes. Cell Signal. 2014;26:1523–1531. doi: 10.1016/j.cellsig.2014.03.019. [DOI] [PMC free article] [PubMed] [Google Scholar]
- 28.Violin JD, Ren XR, Lefkowitz RJ. G-protein-coupled receptor kinase specificity for beta-arrestin recruitment to the beta2-adrenergic receptor revealed by fluorescence resonance energy transfer. J Biol Chem. 2006;281:20577–20588. doi: 10.1074/jbc.M513605200. [DOI] [PubMed] [Google Scholar]
- 29.Peterson SM, et al. Elucidation of G-protein and β-arrestin functional selectivity at the dopamine D2 receptor. Proc Natl Acad Sci U S A. 2015;112:7097–7102. doi: 10.1073/pnas.1502742112. [DOI] [PMC free article] [PubMed] [Google Scholar]
- 30.Gurevich VV. The selectivity of visual arrestin for light-activated phosphorhodopsin is controlled by multiple nonredundant mechanisms. J Biol Chem. 1998;273:15501–15506. doi: 10.1074/jbc.273.25.15501. [DOI] [PubMed] [Google Scholar]
- 31.Chen Q, et al. Structural basis of arrestin-3 activation and signaling. Nat Commun. 2017;8:1427. doi: 10.1038/s41467-017-01218-8. [DOI] [PMC free article] [PubMed] [Google Scholar]
- 32.Gaidarov I, Krupnick JG, Falck JR, Benovic JL, Keen JH. Arrestin function in G protein-coupled receptor endocytosis requires phosphoinositide binding. EMBO J. 1999;18:871–881. doi: 10.1093/emboj/18.4.871. [DOI] [PMC free article] [PubMed] [Google Scholar]
- 33.Lally CCM, Bauer B, Selent J, Sommer ME. C-edge loops of arrestin function as a membrane anchor. Nat Commun. 2017;8:14258. doi: 10.1038/ncomms14258. [DOI] [PMC free article] [PubMed] [Google Scholar]
- 34.Goodman OB, Jr, et al. Beta-arrestin acts as a clathrin adaptor in endocytosis of the beta2-adrenergic receptor. Nature. 1996;383:447–450. doi: 10.1038/383447a0. [DOI] [PubMed] [Google Scholar]
- 35.Laporte SA, Oakley RH, Holt JA, Barak LS, Caron MG. The interaction of β-arrestin with the AP-2 adaptor is required for the clustering of β2-adrenergic receptor into clathrin-coated pits. J Biol Chem. 2000;275:23120–23126. doi: 10.1074/jbc.M002581200. [DOI] [PubMed] [Google Scholar]
- 36.Oakley RH, Laporte SA, Holt JA, Barak LS, Caron MG. Association of beta-arrestin with G protein-coupled receptors during clathrin-mediated endocytosis dictates the profile of receptor resensitization. J Biol Chem. 1999;274:32248–32257. doi: 10.1074/jbc.274.45.32248. [DOI] [PubMed] [Google Scholar]
- 37.Santos M, de S, Naal RMZG, Baird B, Holowka D. Inhibitors of PI(4,5)P2 synthesis reveal dynamic regulation of IgE receptor signaling by phosphoinositides in RBL mast cells. Mol Pharmacol. 2013;83:793–804. doi: 10.1124/mol.112.082834. [DOI] [PMC free article] [PubMed] [Google Scholar]
- 38.Manley S, et al. High-density mapping of single-molecule trajectories with photoactivated localization microscopy. Nat Methods. 2008;5:155–157. doi: 10.1038/nmeth.1176. [DOI] [PubMed] [Google Scholar]
- 39.Hammond GRV, Sim Y, Lagnado L, Irvine RF. Reversible binding and rapid diffusion of proteins in complex with inositol lipids serves to coordinate free movement with spatial information. J Cell Biol. 2009;184:297–308. doi: 10.1083/jcb.200809073. [DOI] [PMC free article] [PubMed] [Google Scholar]
- 40.Liu AP, Loerke D, Schmid SL, Danuser G. Global and local regulation of clathrin-coated pit dynamics detected on patterned substrates. Biophys J. 2009;97:1038–1047. doi: 10.1016/j.bpj.2009.06.003. [DOI] [PMC free article] [PubMed] [Google Scholar]
- 41.O’Hayre M, et al. Genetic evidence that β-arrestins are dispensable for the initiation of β2-adrenergic receptor signaling to ERK. Sci Signal. 2017;10 doi: 10.1126/scisignal.aal3395. [DOI] [PMC free article] [PubMed] [Google Scholar]
- 42.Cao TT, Deacon HW, Reczek D, Bretscher A, von Zastrow M. A kinase-regulated PDZ-domain interaction controls endocytic sorting of the beta2-adrenergic receptor. Nature. 1999;401:286–290. doi: 10.1038/45816. [DOI] [PubMed] [Google Scholar]
- 43.Temkin P, et al. SNX27 mediates retromer tubule entry and endosome-to-plasma membrane trafficking of signalling receptors. Nat Cell Biol. 2011;13:715–721. doi: 10.1038/ncb2252. [DOI] [PMC free article] [PubMed] [Google Scholar]
- 44.Yudowski GA, Puthenveedu MA, von Zastrow M. Distinct modes of regulated receptor insertion to the somatodendritic plasma membrane. Nat Neurosci. 2006;9:622–627. doi: 10.1038/nn1679. [DOI] [PubMed] [Google Scholar]
- 45.Oakley RH, Laporte SA, Holt JA, Caron MG, Barak LS. Differential affinities of visual arrestin, beta arrestin1, and beta arrestin2 for G protein-coupled receptors delineate two major classes of receptors. J Biol Chem. 2000;275:17201–17210. doi: 10.1074/jbc.M910348199. [DOI] [PubMed] [Google Scholar]
- 46.Bouvier M, et al. Removal of phosphorylation sites from the beta 2-adrenergic receptor delays onset of agonist-promoted desensitization. Nature. 1988;333:370–373. doi: 10.1038/333370a0. [DOI] [PubMed] [Google Scholar]
- 47.Krasel C, Bünemann M, Lorenz K, Lohse MJ. β-Arrestin binding to the β2-adrenergic receptor requires both receptor phosphorylation and receptor activation. Journal of Biological. 2005 doi: 10.1074/jbc.M413078200. [DOI] [PubMed] [Google Scholar]
- 48.Barak LS, Ferguson SS, Zhang J, Caron MG. A beta-arrestin/green fluorescent protein biosensor for detecting G protein-coupled receptor activation. J Biol Chem. 1997;272:27497–27500. doi: 10.1074/jbc.272.44.27497. [DOI] [PubMed] [Google Scholar]
- 49.Merrifield CJ, Feldman ME, Wan L, Almers W. Imaging actin and dynamin recruitment during invagination of single clathrin-coated pits. Nat Cell Biol. 2002;4:691–698. doi: 10.1038/ncb837. [DOI] [PubMed] [Google Scholar]
- 50.Stauffer TP, Ahn S, Meyer T. Receptor-induced transient reduction in plasma membrane PtdIns(4,5)P2 concentration monitored in living cells. Curr Biol. 1998;8:343–346. doi: 10.1016/s0960-9822(98)70135-6. [DOI] [PubMed] [Google Scholar]
- 51.Schneider CA, Rasband WS, Eliceiri KW. NIH Image to ImageJ: 25 years of image analysis. Nat Methods. 2012;9:671–675. doi: 10.1038/nmeth.2089. [DOI] [PMC free article] [PubMed] [Google Scholar]
- 52.Schindelin J, et al. Fiji: an open-source platform for biological-image analysis. Nat Methods. 2012;9:676–682. doi: 10.1038/nmeth.2019. [DOI] [PMC free article] [PubMed] [Google Scholar]
- 53.Nair D, et al. Super-resolution imaging reveals that AMPA receptors inside synapses are dynamically organized in nanodomains regulated by PSD95. J Neurosci. 2013;33:13204–13224. doi: 10.1523/JNEUROSCI.2381-12.2013. [DOI] [PMC free article] [PubMed] [Google Scholar]
- 54.Rossier O, et al. Integrins β1 and β3 exhibit distinct dynamic nanoscale organizations inside focal adhesions. Nat Cell Biol. 2012;14:1057–1067. doi: 10.1038/ncb2588. [DOI] [PubMed] [Google Scholar]
- 55.Humphrey W, Dalke A, Schulten K. VMD: visual molecular dynamics. J Mol Graph. 1996;14:33–8. 27–8. doi: 10.1016/0263-7855(96)00018-5. [DOI] [PubMed] [Google Scholar]
Associated Data
This section collects any data citations, data availability statements, or supplementary materials included in this article.
Supplementary Materials
Data Availability Statement
The data that support the findings of this study are available from the authors upon on reasonable request.


