

Abstract
Ultrasound is among the most widely used biomedical imaging modalities, but has limited ability to image specific molecular targets due to the lack of suitable nanoscale contrast agents. Gas vesicles – genetically encoded protein nanostructures isolated from buoyant photosynthetic microbes – have recently been identified as nanoscale reporters for ultrasound. Their unique physical properties give gas vesicles significant advantages over conventional microbubble contrast agents, including nanoscale dimensions and inherent physical stability. Furthermore, as a genetically encoded material, gas vesicles present the possibility that the nanoscale mechanical, acoustic and targeting properties of an imaging agent can be engineered at the level of its constituent proteins. Here, we demonstrate that genetic engineering of gas vesicles results in nanostructures with new mechanical, acoustic, surface and functional properties to enable harmonic, multiplexed and multimodal ultrasound imaging, as well as cell-specific molecular targeting. These results establish a biomolecular platform for the engineering of acoustic nanomaterials.
Keywords: Acoustic Nanostructures, Ultrasound, Gas Vesicles, Protein Engineering, Genetic Engineering, Molecular Imaging, Contrast Agents, Cancer, Macrophages
Graphical abstract
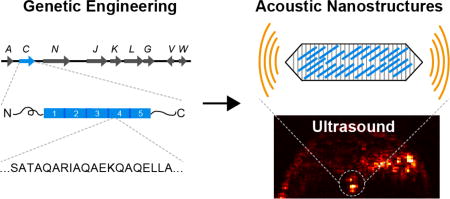
Ultrasound is among the most widely used biomedical imaging modalities due to its superior spatiotemporal resolution, safety, cost and ease of use compared to other techniques such as magnetic resonance and nuclear imaging. In addition to visualizing anatomy and physiology, ultrasound can take advantage of contrast agents to more specifically image blood flow, discern the location of certain molecular targets, and resolve structures beyond its normal wavelength limit via super-localization.1–2 However, existing “microbubble” contrast agents - micron-sized bubbles of gas stabilized by a biocompatible shell - face limitations as molecular reporters due to their size and inherent physical instability, restricting their use to primarily within the vasculature.3–4 Recently, we introduced gas vesicles (GVs) as a new class of nanoscale imaging agents for ultrasound.5 GVs are gas-filled protein-shelled nanostructures (Fig. 1a) expressed intracellularly in certain bacteria and archaea as a mechanism to regulate cellular buoyancy in aqueous environments.6–7 GVs have widths of 45 – 250 nm and lengths of 100 – 800 nm depending on their genetic origins.6–7 Unlike microbubbles, which trap pre-loaded gas in an unstable configuration, GVs’ 2-nm-thick protein shells exclude water but permit gas to freely diffuse in and out from the surrounding media6 (Fig. 1b), making them physically stable despite their nanometer size. GVs produce robust ultrasound contrast across a range of frequencies at picomolar concentrations, exhibit harmonic scattering to enable enhanced detection versus background in vivo, and have species-dependent thresholds for pressure-induced collapse to enable multiplexed imaging.5 Furthermore, the genetic encodability of GVs raises the possibility of engineering the properties of these nanoscale imaging agents at the level of their protein composition and DNA sequence. Here, we establish this capability by biochemically and genetically engineering the mechanical, acoustic, surface and targeting properties of GVs from the cyanobacterium Anabaena flos-aquae (Ana GVs).
Figure 1. Molecular engineering platform for acoustic protein nanostructures.

(a) Transmission Electron Microscopy (TEM) image of a single Ana GV. (b) Schematic illustration of Ana GV, and the gene cluster encoding GvpA, GvpC and several other essential proteins. (c) GvpA and GvpC are the two major structural constituents of GVs, with GvpA ribs (gray) forming the primary GV shell and the outer scaffold protein GvpC (blue) conferring structural integrity. Each GvpC molecule has five 33- amino acid repeats flanked by N- and C- terminal regions (d) Paradigm for modular genetic engineering of Ana GVs. Native gas vesicles are treated with 6M urea to produce stripped Ana GVs without native GvpC (blue). Genetically engineered GvpC is recombinantly expressed in Escherichia coli (orange) and added to the stripped Ana GVs during dialysis to create engineered GVs with a modified GvpC layer. (e) GvpC engineering can be used to modulate the properties of acoustic GV nanostructures including their harmonic response, collapse pressure, surface charge, targeting specificity and fluorescence.
Ana GVs are cone-tipped cylindrical structures with a diameter of approximately 140 nm and length of 200–800 nm (Fig. 1a, b). These structures are encoded by a cluster of 9 different genes, including the two primary structural proteins, GvpA and GvpC, and several putative minor components and chaperones7–9 (Fig. 1b). GvpA is a 7.4 kDa amphiphilic protein that assembles into the main structural backbone of the GV shell by forming 4.6-nm-wide ribs that run perpendicular to the long axis of the nanostructure10–11(Fig. 1c). GvpC is the second most abundant protein, and strengthens the GV shell by binding to its exterior surface.11–12 This protein comprises five highly conserved 33-amino acid repeats with predicted alpha-helical structure, and is believed to bind across GvpA ribs to provide structural reinforcement11 (Fig. 1c). In biochemical studies, removal of GvpC and truncations to its sequence were shown to result in a reduced threshold for Ana GV collapse under hydrostatic pressure.12–13 In addition, previous studies using other species have demonstrated that GvpC can tolerate fusions of bacterial and viral polypeptides.14–15 Given these properties, we hypothesized that GvpC could serve as a versatile platform for molecular engineering of GV-based ultrasound contrast agents. Specifically, we predicted that changes in GV mechanical properties resulting from the removal, addition or modification of GvpC would alter the acoustic properties of Ana GVs, thereby allowing us to tune their ultrasound response and enable harmonic and multiplexed imaging (Fig. 1 d, e). Furthermore, we hypothesized that GvpC could serve as a modular genetic hook enabling the tuning of GV surface properties such as zeta potential, the display of ligands for reduced or enhanced cellular targeting and uptake, and the attachment of fluorescent proteins to enable multimodal imaging (Fig. 1e).
RESULTS AND DISCUSSION
Modular genetic engineering platform for acoustic protein nanostructures
To enable modular molecular engineering of Ana GVs, we established a platform in which genetically engineered GvpC variants are recombinantly expressed in Escherichia coli and subsequently added to Ana GVs that have been purified from Anabaena flos-aquae and stripped of their native GvpC proteins (Fig. 1d). The GVs were isolated by hypertonic and detergent-mediated lysis, followed by purification with centrifugally assisted floatation. Native GvpC was removed by treating the GVs with 6M urea, which leaves the GvpA-based shell intact.12–13 We produced genetically engineered variants of Ana GvpC containing N- or C-terminal hexahistidine sequences in Escherichia coli and purified the resulting inclusion bodies by nickel chromatography in 6M urea. Dialysis of recombinant GvpC in the presence of stripped Ana GVs into physiological buffer resulted in Ana GVs with a new, engineered GvpC layer (Fig. 1d). SDS-PAGE analysis confirmed the complete removal of GvpC from native Ana GVs and the re-addition of engineered proteins (Fig. S1).
Genetic engineering enables tuning of collapse pressure for acoustic multiplexing
The gaseous interior of GVs can be collapsed with hydrostatic and acoustic pressure, erasing their ultrasound scattering signal and enabling multiplexed imaging of GVs with distinct collapse pressure thresholds.5 To determine whether genetic tuning could enable enhanced multiplexing, we engineered three Ana GV variants with distinct mechanical properties. ΔGvpC comprises GVs completely lacking the outer GvpC layer; ΔN&C contains a truncated form of GvpC without its N- and C- terminal regions; GvpCWT has an engineered GvpC protein that closely resembles the wild-type sequence (Fig. 2a). We assessed the hydrostatic collapse behavior of these nanostructures using pressurized absorbance spectroscopy, in which the optical density of GVs (which scatter 500 nm light when intact) is measured under increasing hydrostatic pressure. This provides a rapid assessment of GV mechanics and allows comparisons to literature6. Our three variants spanned a dynamic range of 380 kPa (Fig. 2b, Table S1). ΔGvpC had the lowest collapse pressure midpoint at 195.3 ± 0.3 kPa, the ΔN&C variant showed an intermediate value of 374.3 ± 1 kPa and GvpCWT had the highest value of 569.9 ± 4 kPa (Table SI, N=7, ± SEM). To ensure that the decrease in collapse pressure for the ΔN&C variant was not due to unsaturated binding caused by reduced affinity of this GvpC variant for GvpA, we measured collapse midpoints as a function of re-added GvpC concentration and confirmed that binding was near saturation (Fig. S2, S3).
Figure 2. GvpC engineering enables tuning of GV collapse pressure for acoustic multiplexing.

(a) Schematic illustration of the three engineered GV variants used for acoustic multiplexing. ΔGvpC, ΔN&C and GvpCWT variants are represented by green, orange and purple colors respectively. Accompanying TEM images show the conservation of GV shape among the three variants (scale bars are 200 nm). (b) Optical density measurements of engineered Ana GVs as a function of hydrostatic pressure (N=7 independent preparations, error bars are SEM). The data was fitted with a Boltzmann sigmoid function. Fit parameters and R2 values are provided in Table S1. (c) Acoustic collapse curves for the GV variants showing normalized ultrasound signal intensity as a function of increasing peak positive pressure from 290 kPa to 1.23 MPa (N= 3 independent trials, error bars are SEM). The data was fitted with a Boltzmann sigmoid function (parameters provided in Table S2), the derivatives of which with respect to pressure are plotted in (d). (e) Schematic illustration of acoustic spectral unmixing, showing serial collapse of the GV variants based on their critical collapse pressure and indicating the pressures used in panels f and g. (f) Ultrasound images of an agarose phantom containing wells with ΔGvpC, ΔN&C, GvpCWT and a mixture of the three variants (all GVs at final OD 1.0 in PBS), acquired at 6.25 MHz. I0; before collapse I1: after collapse at 630 kPa I2: after collapse at 790 kPa I3: after collapse at 1230 kPa. (g) Spectrally unmixed images processed from the raw ultrasound data in (f). The bottom panel shows an overlay of the three unmixed channels C1, C2, and C3.
Next, we evaluated collapse profiles under ultrasound. GVs were imaged in multi-well agarose phantoms at 6.25 MHz while being subjected to ultrasound pulses with increasing peak positive pressure amplitudes ranging from 290 kPa to 1.23 MPa. Similar to trends observed for hydrostatic collapse, the ΔGvpC variant collapses under the lowest acoustic pressure, followed by ΔN&C and GvpCWT (Fig. 2c, Table S2). Notably, the collapse midpoints in the acoustic regime were substantially higher than in the hydrostatic regime. This is explained by GVs having a gas efflux time of approximately 1.5 µs,16 which is too slow for gas molecules contained in the GV to exit the nanostructure during the 80 ns positive half-cycle of 6.25 MHz ultrasound, allowing the gas to compressively reinforce the GV shell. On the other hand, under hydrostatic conditions, pressure changes occur on the time scale of seconds, allowing gas molecules to exit the GV during pressurization and resulting in the shell carrying the full compressive load by itself.17 We also note that the acoustic collapse curves appear somewhat more closely spaced than hydrostatic collapse curves, which can be explained by the applied acoustic pressure field having a nonuniform profile over the imaged GV sample. Fitting a Boltzmann sigmoidal function to these collapse curves reveals a unique acoustic collapse spectrum for each engineered GV (Fig. 2d).
To take advantage of the distinct acoustic collapse spectra of GV variants for multiplexed imaging, we developed a pressure spectral unmixing paradigm. This paradigm posits that the total signal for a mixed population of GVs in any given pixel is the sum of signals contributed by each sub-population present in that pixel. Images acquired after sequentially applying collapse pulses of increasing pressure (Pi) reveal changes in pixel-wise signal intensity (I) that provide information about the abundance of each GV type in the pixel (Fig. 2e). This information is extracted by multiplying the measured differential signals
by the inverse of a matrix containing the collapse spectrum of each type of GV, denoted by αi,j. The contribution of each GV type to the observed signal represented as Cj is given by the matrix operation:
We used pressure spectral unmixing to obtain multiplexed images of our three GV variants. Figure 2f shows ultrasound images taken at a non-destructive baseline pressure before and after exposing the GV samples to three sequentially increasing collapse pulses. The spectrally unmixed images (Fig. 2g) uniquely identify acoustic signals from each GV variant. Figure S4 shows the matrix of coefficients used to generate these images. We anticipate that this combination of engineered GVs and pressure spectral unmixing will be useful in many scenarios requiring ultrasound imaging of multiple molecular targets in the same sample.
Molecular engineering enables modulation of harmonic ultrasound signals
Non-linear signals from ultrasound contrast agents can dramatically enhance their ability to be distinguished from background tissues, which mainly scatter linearly.18–19 In our initial description of gas vesicles as ultrasound reporters, we found that GVs from Halobacterium salinarum (Halo GVs) produce strong non-linear signals in the form of harmonics of the insonation frequency, while Ana GVs show no harmonic response.5 Since Halo GVs also have a significantly lower critical collapse pressure than Ana GVs,6 we hypothesized that altering Ana GV shell mechanics by engineering GvpC could yield Ana GVs that produce harmonic signals. Accordingly, we characterized the frequency response of engineered Ana GVs to 4.46 MHz pulses over a receive bandwidth of 2–10 MHz. Consistent with our hypothesis, ΔGvpC showed a sharp peak at the second harmonic frequency of 8.9 MHz in addition to the fundamental peak at the transmitted frequency, while GvpCWT showed only a linear signal (Fig. 3a). Ultrasound images formed by bandpass filtering around the fundamental and second harmonic frequencies showed a substantial difference in the harmonic acoustic response of GV variants (p<0.01, N = 7, paired t-test), for the same level of fundamental signal (Fig. 3b–e). The harmonic signals from ΔGvpC were 3.71 fold higher than GvpCWT (Fig. 3e). These results demonstrate that protein engineering can be used to modulate the acoustic properties of a nanostructure.
Figure 3. GV engineering enables modulation of harmonic signals in vitro.

(a) Power spectrum of signal backscattered from ΔGvpC (green) and GvpCWT (purple) variants in an agarose phantom in response to 4.46 MHz pulses. (b) Fundamental and (c) second harmonic ultrasound images of ΔGvpC and GvpCWT GVs acquired with 4.46 MHz transmission and band-pass filtered around 4.46 and 8.92 MHz respectively. Images are shown before and after collapse using a high power burst from the transducer to collapse the GVs. Scale bars are 1 mm. (d) Mean fundamental and (e) harmonic signals from ΔGvpC and GvpCWT variants after filtering at the indicated frequencies (N = 7 independent measurements, error bars are SEM). Data in all panels comes from GVs prepared at OD 2.5 in PBS and loaded into 1% agarose phantoms.
To show that engineered Ana GV variants are capable of producing harmonic signals in vivo, we performed intravenous injections of the ΔGvpC and GvpCWT variants into live, anaesthetized mice. Ultrasound imaging of the inferior vena cava (IVC) was performed in fundamental and second-harmonic modes (transmission at 4.46 MHz and reception filtered around 4.46 MHz and 8.9 MHz center frequencies, respectively). Figure 4a provides a schematic illustration of the in vivo experiment. Five seconds after the start of the injection, enhanced non-linear signals were observed for the ΔGvpC variant compared to GvpCWT, while their fundamental signals were comparable (Fig. 4, b–d). Repeated trials showed a statistically significant difference (p<0.01, N = 6, paired t-test) in the harmonic response of the two variants for the same level of fundamental signal (Fig. 4e), consistent with in vitro results. The ability to genetically tune the harmonic properties of GV contrast agents will enhance their utility for in vitro and in vivo imaging.
Figure 4. GV engineering enables modulation of harmonic signals in vivo.

(a) Schematic depiction of intravenous GV injection and in vivo ultrasound imaging during passage through the inferior vena cava (IVC). (b) Fundamental and second harmonic ultrasound images taken at 4.46 MHz transmission frequency and band-pass filtered receive around 4.46 and 8.92 MHz respectively. Engineered Ana GVs at OD 23.5 in PBS were used for injections. The IVC ROI used for subsequent analysis is circled in green. The white arrow points to the increased harmonic signal observed in the IVC for the ΔGvpC variant. Time course of the mean (c) fundamental and (d) harmonic acoustic signal in the IVC before, during and after steady infusion, with shaded regions representing SEM (N = 6 mice). (e) Histogram showing the area under the curve (AUC) of average fundamental and harmonic contrast in the IVC after ΔGvpC and GvpCWT GV injections (N=6, error bars are SEM).
Genetic engineering enables tuning of surface charge, targeting specificity and multimodal imaging
After demonstrating the ability of GvpC to serve as a genetic platform for tuning the mechanical and acoustic properties of GVs, we examined its capacity to enable the engineering of GV surface and targeting properties. To do so, we used the C-terminus of GvpC as a modular site for protein fusion (Fig. 5a, Fig. S5). As a first proof of concept, we tested the ability of GvpC fusions to modulate GV surface charge, an important property that influences the behavior of nanostructures in solution and in vivo.20 We fused GvpC with the lysine rich protein (LRP), which contains 100 positive charges at physiological pH. Re-addition of this protein to GVs resulted in nanostructures with 28 ± 4 mV higher zeta potential compared to GvpCWT (Fig. 5b).
Figure 5. Genetic engineering of GV surface properties, cellular targeting and multimodal imaging.

(a) Diagram of GvpC genetic fusions used to engineer novel GV properties and functions. (b) Zeta potential measurements of engineered GVs having GvpC fused to LRP and wild-type GvpC (N = 4, error bars are SEM) (c) Confocal fluorescence images showing RGD-functionalized, RDG-functionalized and wild-type Alexa Fluor-488 fluorescently labeled (green) GVs after 24 hr incubation with U87 glioblastoma cells (DAPI-stained nuclei, blue). Scale bars are 50 µm (d) Mean GV fluorescence measured for each condition in (c) (N = 3, error bars are SEM). (e) Confocal fluorescence images of RAW 264.7 macrophages (DAPI-stained nuclei, blue) incubated for 30 min with fluorescently labeled GVs (green) displaying GvpC fused to mCD47, R8 or wild-type GvpC. Scale bars are 50 µm. (f) Mean GV fluorescence measured for each condition in (e) (N = 3, error bars are SEM). (g) Top panel: Ultrasound images of engineered and SpyCatcher-mNeonGreen (SC-mNG) reacted GVs at OD 2.5 in PBS, acquired using a 19 MHz transmission pulse in fundamental mode. Scale bars are 1 mm. Bottom panel: Fluorescence images of the agarose phantoms before and after acoustic collapse. (h) Mean ultrasound and fluorescence signals from the GV samples tested in (g). (N ≥ 4, error bars are SEM).
Next, we tested the ability of GvpC fusions to endow GVs with functionality for specific cellular targeting. A well-studied receptor-targeting peptide is RGD, which binds effectively to a wide range of integrins.21 GVs engineered to express GvpCRGD on their surface were compared with wild-type GvpC and scrambled GvpCRDG controls in terms of their ability to target the integrin-overexpressing U87 glioblastoma cell line in vitro. The GVs were chemically conjugated with the Alexa Fluor-488 fluorophore for visualization using confocal microscopy. GVs functionalized with RGD exhibited a marked increase in cell binding compared to controls (Fig. 5c, d). This technique presents a generalizable approach for future studies targeting GVs to molecular markers in vivo.
Using a similar engineering strategy, we created GvpC fusions to modulate the interaction of GVs with macrophages, which are both imaging targets and important actors in nanoparticle clearance from circulation. CD47, present on endogenous cell membranes in humans, mice, and other mammals, is a well-studied putative marker of self. Discher and colleagues recently described a minimized peptide from the human CD47 protein, dubbed the ‘self’ peptide, which led to reduced uptake of cells and nanoparticles by the mononuclear phagocytic system.22 On the other hand, polycationic peptides such as polyarginine (R8) promote particle uptake by phagocytic cells.23 By fusing each of these molecules to GvpC, we tested whether genetic engineering could modulate GV uptake in RAW 264.7 murine macrophages. As visualized by confocal microscopy, GVs genetically functionalized with GvpCmCD47 showed reduced macrophage uptake compared to GVs with GvpCWT. On the other hand, GVs functionalized with GvpCR8 were taken up much more efficiently (Fig. 5 e, f). These molecular strategies can be used in future studies to enable cellular labeling for in vivo tracking applications or to enhance the circulation lifetime of targeted GVs.
Finally, to further simplify GV functionalization, we developed a highly modular approach through which the GV surface can be covalently conjugated to other recombinant proteins through a facile process that does not involve urea treatment and dialysis. To achieve this goal, we fused GvpC with SpyTag (ST), a 13-residue peptide that forms a covalent amide bond with a partner SpyCatcher protein under physiological conditions.24 This system allows SpyTagged GVs to be functionalized with SpyCatcher fusions in a rapid, biocompatible reaction. We found that GvpCST binds to GVs with similar stoichiometry to GvpCWT and provides reinforcement against pressure-induced collapse (Fig S6). Each modified GV had an average of 1,000 SpyTag functionalities (Fig S7). To demonstrate the utility of this modular functionalization approach, we reacted these GVs with the recombinantly expressed fluorescent protein SpyCatcher-mNeonGreen (SC-mNG) to enable multimodal acoustic and fluorescent imaging. The resulting fluorescent GVs were purified by buoyancy enrichment. SDS-PAGE analysis confirmed SpyTag-SpyCatcher covalent bond formation (Fig. S8), and Figure 5g shows multimodal imaging of mNG-labeled GVs with ultrasound and fluorescence. The ultrasound images show similar echogenicity between fluorescently-labeled GVs, wild-type and unreacted controls. GvpCWT Ana GVs do not show any fluorescence after reaction with SC-mNG (Fig. 5g), highlighting the specificity of the SpyTag-SpyCatcher reaction and confirming that buoyancy enrichment eliminates unreacted fluorescent proteins (Fig. S8). Notably, labeled ST-GVs remain fluorescent after acoustic pressure-induced collapse, which may be useful for follow-up histological examinations after ultrasound imaging. These results establish the GvpCST-SpyCatcher system as a highly modular and convenient approach to generate functionalized GVs, thereby enabling dual-mode imaging of these nanostructures.
CONCLUSION
In summary, our results demonstrate the genetic engineering of a biologically-derived acoustic nanomaterial, which we use as an imaging agent for ultrasound. Remarkably, a single constituent protein on the surface of GVs can serve as a genetic platform to modulate the mechanical, acoustic, surface and targeting properties of these nanostructures. This molecular engineering capability will enable the design of GV-based contrast agents with enhanced harmonic responses, biodistribution, multiplexing, multimodal detection and molecular targeting to help ultrasound fulfill its potential as a high performance modality for molecular imaging. In addition, as a nanomaterial with genetically tunable mechanical properties, GVs may create opportunities for applications outside biology and medicine.
METHODS
Gas Vesicle Preparation
Anabaena flos-aquae (Ana) was cultured in Gorham’s media supplemented with BG-11 solution (Sigma, St. Louis, MO) and 10 mM NaHCO3 at 25°C, 100 rpm shaking and 1% CO2 under a 14h light cycle and 10h dark cycle. Once confluency was reached, the cultures were transferred to sterile separating funnels and the buoyant cells were allowed to float to the top and separate from the spent media over a 48h period. Ana GVs were harvested by hypertonic lysis of the buoyant cells with 500 mM sorbitol and 10% Solulyse (Genlantis, San Diego, CA). Purification was done by repeated centrifugally assisted floatation followed by resuspension in 1× PBS (Corning, Union City, CA). GV concentration was determined by pressure-sensitive OD measurements at 500 nm (ODPS,500). Pre-collapsed GVs prepared by application of hydrostatic pressure in a capped syringe were used as the blank.
Expression and Purification of Ana GvpC variants
The Ana GvpC gene sequence codon-optimized for Escherichia coli expression was synthesized by Life Technologies, Santa Clara, CA. Ana GvpC was cloned into a pET28a(+) plasmid (Novagen, Temecula, CA) downstream of a T7 promoter with an N or C-terminal His-tag. All constructs were made via restriction cloning, KLD mutagenesis, or Gibson assembly using enzymes from New England Biolabs, Ipswich, Massachusetts. Purified plasmids with the genetically engineered GvpC constructs were transformed into BL21(DE3) cells (Invitrogen, Carlsbad, CA). Starter cultures were diluted 1:250 in Terrific Broth (Sigma, St. Louis, MO) and allowed to reach OD600~ 0.4 – 0.7. Protein expression was induced by addition of IPTG (to a final concentration of 1mM), and cells were harvested by centrifugation after overnight expression at 30 °C.
GvpC in the form of inclusion bodies were purified by lysing the cells using Solulyse supplemented with DNAseI (10 µg/mL) and lysozyme (400 µg/mL) at room temperature. Inclusion bodies were recovered by centrifugation at 27,000g for 15 min in an ultracentrifuge. The inclusion body pellets were resuspended in 20 mM Tris-HCl buffer with 500 mM NaCl and 6 M urea (pH: 8.0) and incubated with Ni-NTA resin (Qiagen, Valencia, CA) for 2 h at 4°C. After washing, proteins were eluted using 250 mM imidazole. Bradford assay was used to measure the concentration of the purified protein. Recombinant GvpC variants were verified to be >95% pure by SDS-PAGE analysis.
Ana GV stripping and re-addition of engineered GvpC variants
Native Ana GVs were stripped of their outer GvpC layer by treatment with 6 M urea solution buffered with 100 mM Tris-HCl (pH 8.5). Two rounds of centrifugally assisted floatation followed by removal of the subnatant layer were done to ensure complete removal of native GvpC, as confirmed by SDS-PAGE. Stripped Ana GVs were then combined with 2× molar excess of the engineered GvpC variant in 6M urea buffer after accounting for a 1:25 binding ratio of GvpC : GvpA. Estimating 12,768 GvpA molecules per Ana GV and 564.2 pM of GVs per O.DPS,500 (1 cm pathlength), the molar concentration of GvpA per O.DPS,500 of Ana GVs was determined to be 7.2 µM and used for calculating the amount of engineered GvpC to be added. The engineered GvpC was then allowed to slowly refold onto the surface of the stripped Ana GVs by dialysis against 1× PBS for >12 h at 4°C using a regenerated cellulose membrane with a 6–8 kDa M.W. cutoff (Spectrum Labs, Rancho Dominguez, CA). Dialyzed samples were subjected to at least 2 rounds of centrifugally assisted floatation to remove any excess unbound GvpC.
Transmission electron microscopy
GV samples were diluted to O.DPS,500 ~ 0.2 in 10 mM HEPES buffer containing 150 mM NaCl (pH 8) and spotted on Formvar/Carbon 200 mesh grids (Ted Pella, Redding, CA) that were rendered hydrophilic by glow discharging (Emitek K100X). GV samples were negatively stained using 2% Uranyl Acetate. Images were acquired using the Tecnai T12 LaB6 120kV TEM equipped with a Gatan Ultrascan 2k X 2k CCD and ‘Leginon’ automated data collection software suite.
Pressurized absorbance spectroscopy
GV samples were diluted to O.D PS,500 ~ 0.2 and loaded onto a flow-through, 1 cm path-length quartz cuvette (Hellma Analytics, Plainview, NY) that was connected to a N2 cylinder through a pressure controller (Alicat Scientific, Tucson, AZ). The pressure was increased stepwise in 20 kPa increments up to 1 MPa and the O.DPS,500 at each step was measured using a spectrophotometer (EcoVis, OceanOptics, Winter Park, FL). Fully collapsed GV sample was used as the blank.
In vitro ultrasound imaging
Imaging phantoms were prepared from 1% agarose in PBS. Two times concentrated GV samples were mixed 1:1 with melted 1% agarose at 50°C, and 100 µL of the mixture was quickly loaded into the phantom wells. Imaging was performed using a Verasonics Vantage programmable ultrasound scanning system. The L11-4v or L22-14v 128-element linear array transducers (Verasonics, Kirkland, WA) were used for image acquisition, with a pitch of 0.3 mm or 0.1 mm and elevation focus of 15–20 mm or 6 mm respectively. The phantom was placed on a custom 3-D printed holder and the transducer was mounted on a computer-controlled 3-dimensional translating stage (Velmex, Inc., Bloomfield, NY). During imaging, the transducer was immersed in PBS at an elevation that positioned the focal zone of the ultrasound beam at the center of the sample well. All images were acquired using a conventional B-mode sequence with 128 ray lines.
The acoustic multiplexing and collapse spectrum measurements were obtained by using GV samples at a final OD of 1 and a transmit frequency of 6.25 MHz on the L11-4v, with a 4-cycle pulse and transmit focus of 20 mm, F-number 2 and persistence 90. The images were acquired at a transmit voltage of 1.6 V. To collapse GVs, acoustic pressure was delivered to the specimen by lowering the F-number to 0.1 and ramping up the voltage gradually. At each collapse step, the transducer was translated in the y and z planes to ensure homogenous GV collapse over the entire well.
Non-linear imaging experiments were performed using the L11-4v transducer with a transmit frequency of 4.46 MHz and receive filtering using a 2 MHz band pass around 4.46 MHz and 8.92 MHz for the fundamental and second harmonic signals, respectively. GV samples at OD 2.5 were imaged at 2.5 V and F-number 3 using a 3-cycle pulse and a persistence of 90.
In vivo ultrasound imaging
Intravenously injected gas vesicles were imaged in 5–7 weeks old female SCID mice using the L11-4v transducer. To be consistent with in vitro experiments, a transmit frequency of 4.46 MHz and reception frequencies of 4.46 MHz and 8.92 MHz were used for the fundamental and non-linear imaging respectively. Imaging was done at 2.5 V using a 3-cycle pulse at an F-number 3 and persistence of 20. The mice were maintained under isofluorane anesthesia on a heated imaging platform. Images were acquired at a rate of 16 frames/sec for ~ 50 s. A 50 µL volume of gas vesicles at OD 23.5 in PBS was infused ~ 5 s after the start of the experiment at a flow rate of 0.3 ml min−1. Between sample injections, a 10s high-power burst from the transducer was used to completely collapse any residual GVs in circulation.
Image analysis
MATLAB and ImageJ (NIH, Bethesda, MD) were used to process in vitro and in vivo ultrasound data. Regions of interest (ROIs) were manually defined so as to capture signals from the entire sample well or the IVC. ROI dimensions were preserved between different GV samples and the mean intensity per pixel calculated using all pixels within the ROI. Quantification of in vitro harmonic and fundamental GV signals was performed by subtraction of the post-collapse images from the pre-collapse images. In vivo IVC signals were analyzed for all acquired frames over the 50 s imaging window and smoothed infusion time-course curves were generated using locally weighted scatterplot smoothing. Area under the curve (AUC) values were obtained from the raw data normalized to the pre-infusion baseline. Acoustic spectral unmixing was performed using MATLAB after applying a spectral averaging filter with a kernel size of [20 20] pixels to reduce out-of-well noise. Pseudocolor assignments and merging of spectrally unmixed images were performed using ImageJ (color maps are shown next to the images in Figure 2g).
Zeta potential measurements
Zeta potential of GVs with GvpC-WT and GvpC-LRP were measured using Brookhaven Instruments Corporation Zeta-PALS instrument (Hotsville, NY). 40 µL of GVs (in PBS) were added to 1.5 mL of double distilled water at a final concentration of 35 pM and conductance of 1 mS. Electrodes were placed in the cuvette with the samples and average zeta potential for each run was determined from 10 measurements.
In vitro characterization of functionalized GVs
Alexa-488 succinimidyl ester fluorescent dye (Invitrogen, Carlsbad, CA) was reacted with GVs in PBS for 2 hours at 10,000:1 molar excess of dye to GVs. Excess succimidyl ester was quenched with 10 mM Tris. Fluorescently-labeled GVs were purified using dialysis against PBS. Cells were seeded on 22×22 mm coverglass and cultured for 24 hours prior to the start of the experiments. Due to the buoyant nature of GVs, in vitro characterization was carried out using modified 6-well plates that contain 3 pegs to enable inverted cell growth (facing down). For receptor (αvβ3) targeting experiments, 16 µL of fluorescently-labeled GVs (GvpCWT, GvpCWT-RGD, and GvpCWT-RDG) at 1.2 nM were added to U87 cells (ATCC, Manassas, VA) and incubated for 24 hrs. To test phagocytic uptake using GvpCWT, GvpCWT-mCD47, and GvpCWT-R8, 8 µL of fluorescently labeled GVs at 1.2 nM were added to RAW 264.7 cells (ATCC). After the allotted GV incubation, cells were washed 3× with PBS, fixed with 4% paraformaldehyde, and mounted with DAPI-containing mounting media. Confocal fluorescence images were acquired using inverted Zeiss LSM 710 NLO (Thornwood, NY) using a 20× objective.
SpyTag - SpyCatcher functionalization of Ana GVs
SpyTag-Ana GVs were prepared using the re-addition protocol described above. SpyCatcher-mNeonGreen (SC-mNG) was expressed and purified from BL21 E. coli using non-denaturing Ni-NTA purification. ST-GVs (OD 5–10) were incubated with SC-mNG at a 2× molar excess of SpyCatcher:SpyTag in PBS for 1 hr at room temperature. GVs were spun at 300g for 4 hrs twice in order to remove excess unbound protein; the supernatant containing GVs was resuspended in fresh PBS. ST-GV (± SC-mNG) and WT-GV (+ SC-mNG) samples were prepared in a 1% agarose phantom at a final OD of 2.5 and imaged with the Verasonics L22-14V transducer at 19 MHz, 5.0V and F-Number 3 with a persistence of 90. The agarose phantom was also imaged through the green channel of a BioRad Chemidoc MP system (Hercules, CA). The fluorescence intensity of the ST-GV (± SC-mNG) and WT-GV (+ SC-mNG) samples was determined by first collapsing the samples and then measuring fluorescence intensity (ex 506nm, em 550nm) in a Molecular Devices SpectraMax M5 plate reader (Sunnyvale, CA).
Supplementary Material
Acknowledgments
The authors thank Jordan Dykes and Nikita Reznik for assistance with experimental apparatus and Assaf Gilad for sharing the LRP gene. The authors also thank Alasdair McDowall for assistance with TEM.
Funding Sources
This research was supported by the NIH (EB018975) and DARPA (W911NF-14-1-0111). A.L. is supported by the NSF graduate research fellowship (award number 1144469). A.F. is supported by the NSERC graduate fellowship. D.M. is supported by the Human Frontiers Science Program Cross-Disciplinary Postdoctoral Fellowship. Research in the Shapiro laboratory is also supported by the Heritage Medical Research Institute and the Burroughs Wellcome Career Award at the Scientific Interface.
ABBREVIATIONS
- GV
gas vesicle
- GvpA
Gas vesicle protein A
- GvpC
Gas vesicle protein C
- SDS-PAGE
Sodium dodecyl sulphate polyacrylamide gel electrophoresis
- Ana
Anabaena flos-aquae
- Halo
Halobacterium salinarum
- F-number
focal ratio
- IVC
Inferior vena cava
- TEM
Transmission Electron Microscopy
- mCD47
minimal Cluster of Differentiation 47
- ST
SpyTag
- SC - mNG
SpyCatcher - mNeonGreen
- PBS
Phosphate Buffered Saline
- IPTG
Isopropyl β-D-1-thiogalactopyranoside
- NaCl
Sodium Chloride
- NaHCO3
Sodium Bicarbonate
- SCID
Severe Combined Immunodeficiency
- DAPI
4',6-diamidino-2-phenylindole
- U87
human brain glioblastoma cell line
- RAW 264.7
mouse leukaemic monocyte macrophage cell line
- LRP
Lysine-rich protein, R8, octaarginine cell-penetrating peptide
- RGD
Arginylglycylaspartic acid
- MATLAB
Matrix Laboratory.
Footnotes
ASSOCIATED CONTENT
Supporting Information. Supplementary Figures 1–8 and Supplementary Tables 1–2. “This material is available free of charge via the Internet at http://pubs.acs.org.”
Author Contributions
M.G.S. and A.L. conceived the study. A.L., A.F. and S.P.N. designed and planned experiments. A.L., A.F., S.P.N., A.L-G. and D.M. conducted the experiments and analyzed data. R.W.B., A.L., D.M. and M.G.S. wrote the MATLAB scripts for ultrasound imaging and data processing. All authors discussed the results. A.L. and M.G.S. wrote the manuscript with input from all authors. All authors have given approval to the final version of the manuscript.
The authors declare no competing financial interest.
References
- 1.Cosgrove D, Harvey C. Clinical Uses of Microbubbles in Diagnosis and Treatment. Med. Biol. Eng. Comput. 2009;47(8):813–26. doi: 10.1007/s11517-009-0434-3. [DOI] [PubMed] [Google Scholar]
- 2.Errico C, Pierre J, Pezet S, Desailly Y, Lenkei Z, Couture O, Tanter M. Ultrafast Ultrasound Localization Microscopy for Deep Super-Resolution Vascular Imaging. Nature. 2015;527(7579):499–502. doi: 10.1038/nature16066. [DOI] [PubMed] [Google Scholar]
- 3.Kaufmann BA, Lindner JR. Molecular Imaging with Targeted Contrast Ultrasound. Curr. Opin. Biotechnol. 2007;18(1):11–6. doi: 10.1016/j.copbio.2007.01.004. [DOI] [PubMed] [Google Scholar]
- 4.Ferrara K, Pollard R, Borden M. Ultrasound Microbubble Contrast Agents: Fundamentals and Application to Gene and Drug Delivery. Annu. Rev. Biomed. Eng. 2007;9:415–47. doi: 10.1146/annurev.bioeng.8.061505.095852. [DOI] [PubMed] [Google Scholar]
- 5.Shapiro MG, Goodwill PW, Neogy A, Yin M, Foster FS, Schaffer DV, Conolly SM. Biogenic Gas Nanostructures as Ultrasonic Molecular Reporters. Nature nanotechnology. 2014;9(4):311. doi: 10.1038/nnano.2014.32. [DOI] [PMC free article] [PubMed] [Google Scholar]
- 6.Walsby AE. Gas Vesicles. Microbiol. Rev. 1994;58(1):94–144. doi: 10.1128/mr.58.1.94-144.1994. [DOI] [PMC free article] [PubMed] [Google Scholar]
- 7.Pfeifer F. Distribution, Formation and Regulation of Gas Vesicles. Nat. Rev. Microbiol. 2012;10(10):705–15. doi: 10.1038/nrmicro2834. [DOI] [PubMed] [Google Scholar]
- 8.Kinsman R, Hayes P. Genes Encoding Proteins Homologous to Halobacterial Gvps N, J, K, F & L Are Located Downstream of Gvpc in the Cyanobacterium Anabaena Flos-Aquae. DNA Sequence. 1997;7(2):97–106. doi: 10.3109/10425179709020156. [DOI] [PubMed] [Google Scholar]
- 9.Hayes P, Powell R. The Gvpa/C Cluster of Anabaena Flos-Aquae Has Multiple Copies of a Gene Encoding Gvpa. Archives of microbiology. 1995;164(1):50–57. doi: 10.1007/BF02568734. [DOI] [PubMed] [Google Scholar]
- 10.Walsby AE, Hayes PK. Gas Vesicle Proteins. Biochemical Journal. 1989;264(2):313. doi: 10.1042/bj2640313. [DOI] [PMC free article] [PubMed] [Google Scholar]
- 11.Buchholz B, Hayes P, Walsby A. The Distribution of the Outer Gas Vesicle Protein, Gvpc, on the Anabaena Gas Vesicle, and Its Ratio to Gvpa. Microbiology. 1993;139(10):2353–2363. doi: 10.1099/00221287-139-10-2353. [DOI] [PubMed] [Google Scholar]
- 12.Hayes P, Buchholz B, Walsby A. Gas Vesicles Are Strengthened by the Outer-Surface Protein, Gvpc. Archives of microbiology. 1992;157(3):229–234. doi: 10.1007/BF00245155. [DOI] [PubMed] [Google Scholar]
- 13.Kinsman R, Walsby A, Hayes P. Gvpcs with Reduced Numbers of Repeating Sequence Elements Bind to and Strengthen Cyanobacterial Gas Vesicles. Molecular microbiology. 1995;17(1):147–154. doi: 10.1111/j.1365-2958.1995.mmi_17010147.x. [DOI] [PubMed] [Google Scholar]
- 14.DasSarma S, Karan R, DasSarma P, Barnes S, Ekulona F, Smith B. An Improved Genetic System for Bioengineering Buoyant Gas Vesicle Nanoparticles from Haloarchaea. BMC biotechnology. 2013;13(1):1. doi: 10.1186/1472-6750-13-112. [DOI] [PMC free article] [PubMed] [Google Scholar]
- 15.Sremac M, Stuart ES. Recombinant Gas Vesicles from Halobacterium Sp. Displaying Siv Peptides Demonstrate Biotechnology Potential as a Pathogen Peptide Delivery Vehicle. BMC biotechnology. 2008;8(1):9. doi: 10.1186/1472-6750-8-9. [DOI] [PMC free article] [PubMed] [Google Scholar]
- 16.Walsby AE, Revsbech NP, Griffel DH. The Gas-Permeability Coefficient of the Cyanobacterial Gas Vesicle Wall. J. Gen. Microbiol. 1992;138:837–845. [Google Scholar]
- 17.Cherin M, Melis JS, Bourdeau RW, Yin M, Kochmann DM, Foster FS, Shapiro MG. Acoustic Behavior of Halobacterium Salinarum Gas Vesicles in the High Frequency Range: Experiments and Modeling. doi: 10.1016/j.ultrasmedbio.2016.12.020. Submitted. [DOI] [PMC free article] [PubMed] [Google Scholar]
- 18.Burns PN. Harmonic Imaging with Ultrasound Contrast Agents. Clin. Radiol. 1996;51:50–55. [PubMed] [Google Scholar]
- 19.Maresca D, Skachkov I, Renaud G, Jansen K, van Soest G, de Jong N, van der Steen AF. Imaging Microvasculature with Contrast-Enhanced Ultraharmonic Ultrasound. Ultrasound in medicine & biology. 2014;40(6):1318–1328. doi: 10.1016/j.ultrasmedbio.2013.12.029. [DOI] [PubMed] [Google Scholar]
- 20.Blanco E, Shen H, Ferrari M. Principles of Nanoparticle Design for Overcoming Biological Barriers to Drug Delivery. Nature biotechnology. 2015;33(9):941–951. doi: 10.1038/nbt.3330. [DOI] [PMC free article] [PubMed] [Google Scholar]
- 21.Ruoslahti E. Rgd and Other Recognition Sequences for Integrins. Annual review of cell and developmental biology. 1996;12(1):697–715. doi: 10.1146/annurev.cellbio.12.1.697. [DOI] [PubMed] [Google Scholar]
- 22.Rodriguez PL, Harada T, Christian DA, Pantano DA, Tsai RK, Discher DE. Minimal" Self" Peptides That Inhibit Phagocytic Clearance and Enhance Delivery of Nanoparticles. Science. 2013;339(6122):971–975. doi: 10.1126/science.1229568. [DOI] [PMC free article] [PubMed] [Google Scholar]
- 23.Brock R. The Uptake of Arginine-Rich Cell-Penetrating Peptides: Putting the Puzzle Together. Bioconjugate chemistry. 2014;25(5):863–868. doi: 10.1021/bc500017t. [DOI] [PubMed] [Google Scholar]
- 24.Zakeri B, Fierer JO, Celik E, Chittock EC, Schwarz-Linek U, Moy VT, Howarth M. Peptide Tag Forming a Rapid Covalent Bond to a Protein, through Engineering a Bacterial Adhesin. Proceedings of the National Academy of Sciences of the United States of America. 2012;109(12):E690–7. doi: 10.1073/pnas.1115485109. [DOI] [PMC free article] [PubMed] [Google Scholar]
Associated Data
This section collects any data citations, data availability statements, or supplementary materials included in this article.