Abstract
Objective
In the work-up of patients presenting with a clinically isolated syndrome (CIS), 3T MRI might offer a higher lesion detection than 1.5T, but it remains unclear whether this affects the fulfilment of the diagnostic criteria for multiple sclerosis (MS).
Methods
We recruited 66 patients with CIS within 6 months from symptom onset and 26 healthy controls in 6 MS centers. All participants underwent 1.5T and 3T brain and spinal cord MRI at baseline according to local optimized protocols and the MAGNIMS guidelines. Patients who had not converted to MS during follow-up received repeat brain MRI at 3–6 months and 12–15 months. The number of lesions per anatomical region was scored by 3 raters in consensus. Criteria for dissemination in space (DIS) and dissemination in time (DIT) were determined according to the 2017 revisions of the McDonald criteria.
Results
Three-Tesla MRI detected 15% more T2 brain lesions compared to 1.5T (p < 0.001), which was driven by an increase in baseline detection of periventricular (12%, p = 0.015), (juxta)cortical (21%, p = 0.005), and deep white matter lesions (21%, p < 0.001). The detection rate of spinal cord lesions and gadolinium-enhancing lesions did not differ between field strengths. Three-Tesla MRI did not lead to a higher number of patients fulfilling the criteria for DIS or DIT, or subsequent diagnosis of MS, at any of the 3 time points.
Conclusion
Scanning at 3T does not influence the diagnosis of MS according to McDonald diagnostic criteria.
MRI is the most sensitive tool for the detection of inflammatory demyelination in the CNS.1–3 Numerous studies have stressed the importance of MRI in the (differential) diagnosis of multiple sclerosis (MS) and clinically isolated syndrome (CIS).4–7 In addition to diagnostic purposes leading to an early and accurate diagnosis, MRI also has a prognostic value regarding the prediction of the time to conversion from CIS to MS and development of long-term disability.8–11
Both the 2010 and the recently introduced 2017 revisions of the McDonald diagnostic criteria for MS do not specify MRI acquisition measures such as magnetic field strength.7,12 As higher field strengths improve signal-to-noise ratio, resulting in increased image quality,13,14 some expert panel guidelines recommend brain imaging at 3T MRI for diagnostic and treatment monitoring purposes.6,15 Previous single-center and single-vendor studies have demonstrated that 3T MRI increases lesion detection in the brain, especially in (juxta)cortical, periventricular, and infratentorial regions, but little is known about the spinal cord.16,17 More importantly, the diagnostic relevance of high-field MRI remains uncertain, particularly in relation to the demonstration of dissemination in space and time (DIS and DIT) for the diagnosis of MS.
The purpose of this study was to prospectively evaluate the effect of 3T MRI on brain and spinal cord lesion detection in a multicenter and multivendor setting in patients with CIS, and subsequently assess its effect on fulfilment of the criteria for DIS and DIT according to McDonald diagnostic criteria.
Methods
Previously we reported an interim analysis on interobserver agreement on lesion detection in a subset of the then ongoing prospective CIS project.18 We now present the full follow-up of the whole cohort.
Participants
For this study, we recruited participants from 6 different MS centers from the Magnetic Resonance Imaging in Multiple Sclerosis (MAGNIMS) network (magnims.eu) between July 2013 and September 2015.
Inclusion criteria were defined as follows: (1) for patients only: CIS suggestive of MS as defined by the International Panel on MS diagnosis7; (2) for patients only: baseline visit within 6 months after the first onset of clinical symptoms suggestive of demyelination; (3) age at baseline between 18 and 59 years; (4) no medical history of other immunologic disease, malignancy, or vascular pathology; (5) no known claustrophobia or allergy to a gadolinium-based contrast agent.
For the patients with CIS, the study protocol comprised 3 visits: baseline, first follow-up at 3–6 months, and a second follow-up at 12–15 months. Besides MRI, at all 3 time points a medical history was taken and a trained physician assessed the Expanded Disability Status Scale (EDSS). Information on oligoclonal band status was not available. In case of conversion to clinically definite MS during follow-up (i.e., the occurrence of a second clinical relapse, diagnosed by the treating neurologist) or fulfillment of the radiologic criteria for the diagnosis of MS, patients were excluded from further imaging. Healthy controls only underwent the baseline visit, as no clinical or radiologic changes were to be expected.
Standard protocol approvals, registrations, and patient consent
Each local institutional review board approved the study and all participants gave written informed consent prior to the first study activity.
MRI protocols
MRI examinations were performed for all participants at both 1.5T and 3T at all 3 visits. For each time point, the scan interval between the different field strengths was less than 72 hours. The scanning measures were based on local optimized acquisition protocols and in accordance with the MAGNIMS guidelines.6,15 Acquisition measures were comparable between field strengths. A detailed description of the acquisition protocols for the different vendors has previously been described.18 In brief, at both field strengths isotropic 3D T1-weighted imaging (T1WI) and 3D fluid-attenuated inversion recovery, axial 3 mm T2-weighted imaging (T2WI) and proton density (PD), and if available double inversion recovery brain imaging was performed at all time points. Patients received postcontrast T1 spin-echo at baseline only. Spinal cord imaging was performed for all participants at baseline only and consisted of sagittal 3 mm T1WI, T2WI, and PD sequences. For patients only, spinal cord imaging was performed after administration of a single dose of gadolinium-based contrast agent.
Lesion detection and diagnostic criteria
All scans were rated in consensus using a digital workstation (Sectra [Linköping, Sweden] IDS7 version 16.2.28) by 3 raters (M.H.J.H., M.L.d.V. or M.P.W., and F.B.) in random order, with a minimum time interval of 2 weeks between the rating of the 1.5T and the 3T scans. All T2 lesions larger than 3 mm at baseline or new at follow-up were scored according to their anatomical region (periventricular, [juxta]cortical, deep white matter, infratentorial, or spinal cord). In addition, baseline enhancing lesions in each anatomical region were reported for patients only. Subsequently, fulfilment of DIS and DIT for all 3 time points was determined according to the 2017 revisions of the McDonald criteria.12 In addition, the 2010 revisions of the McDonald criteria and the 2016 proposed MAGNIMS criteria were evaluated. Regarding clinical information, only the localization of the symptoms at onset as determined by the treating neurologist was provided. No additional information on age, sex, and center was available to the raters.
After all scans were scored separately, a side-by-side comparison of the 1.5T and 3T scans of each participant was performed (M.H.J.H., M.L.d.V.) to check for and if necessary correct artificial discrepancies between the ratings at both field strengths. For example, a lesion in the medial temporal lobe could have been identified as either periventricular or juxtacortical. To ensure consistency of the classification between the 1.5T and 3T scoring, we aligned the readings to assure that differences in lesion count were not based on such variations in interpretation of lesion location. The total number of lesions scored per field strength was not changed during this post hoc analysis.
Statistical analysis
Statistical analysis was performed using the Wilcoxon signed-rank test for continuous variables (number of lesions detected) and the McNemar test for dichotomous outcomes (diagnostic criteria) in SPSS 22.0 (IBM Corp., Armonk, NY). Statistical significance was defined as p < 0.05 and for subgroup analysis of the 5 anatomical regions p < 0.01 to correct for multiple testing.
Data availability
The data that support the findings of this study are available from the corresponding author (M.H.J.H.) upon reasonable request and approval by the MAGNIMS steering committee.
Results
Demographics
In total, 66 patients with CIS and 26 healthy controls were included in this study. The participant characteristics are described in table 1. In short, at baseline patients' mean age was 34.7 years, 71% were female, the median EDSS was 2.0, and most patients presented with a spinal cord syndrome (38%) or optic neuritis (39%). Healthy controls were 36.3 years old on average (compared to patients p = 0.80) and 62% were female (p = 0.37).
Table 1.
Cohort description
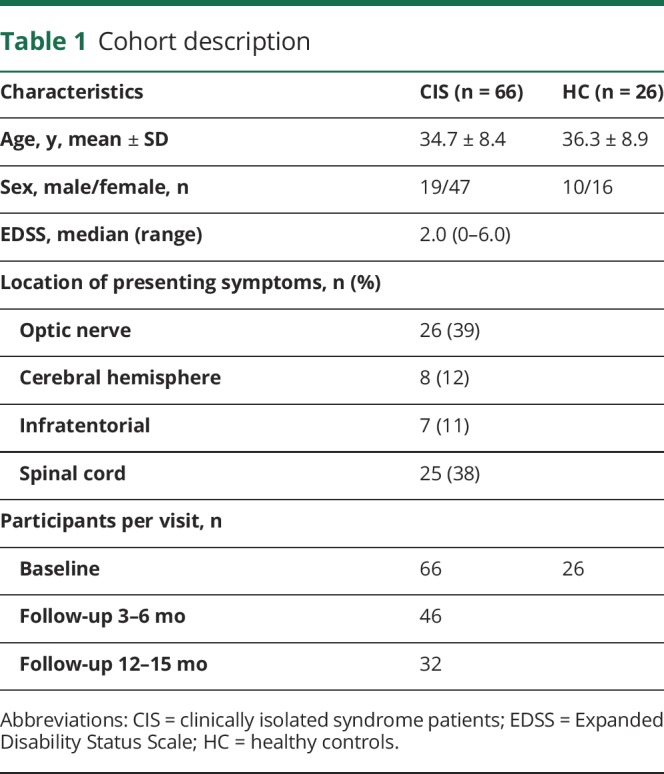
In total, 32 patients completed all 3 visits, 19 patients converted to definite MS before the third visit, and 15 patients became lost to follow-up due to various reasons, such as pregnancy, moving too far away from the hospital, or personal reasons.
Number of lesions
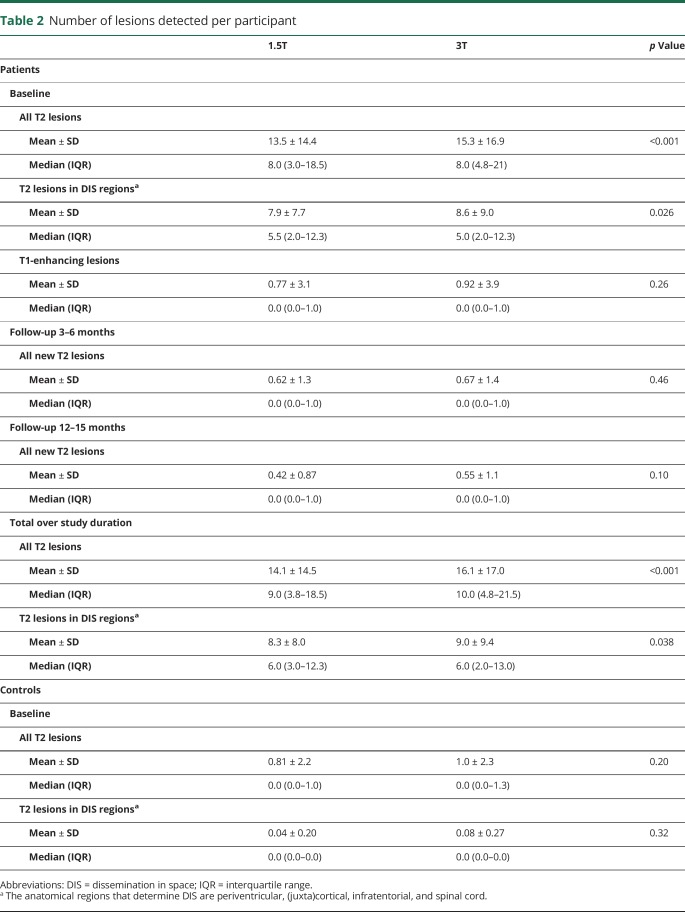
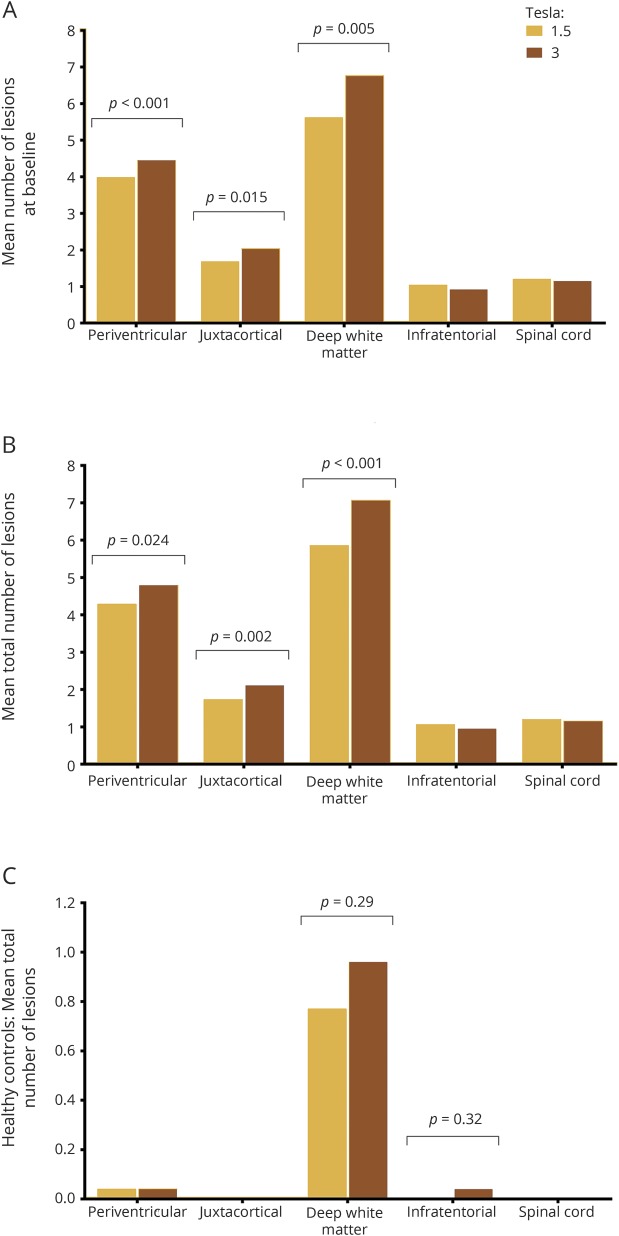
As described in table 2, the number of T2 lesions scored in patients at baseline was slightly but significantly higher at 3T compared to 1.5T, with a mean of 13.5 per patient at 1.5T (median 8, interquartile range [IQR] 3.0–18.5) and 15.3 at 3T (median 8, IQR 4.8–21.0) (p < 0.001). As figure 1 illustrates, this was driven by increased lesion detection at 3T in deep white matter, periventricular, and (juxta)cortical regions, of which the first 2 reached statistical significance. There was no difference in number of spinal cord lesions at baseline between field strengths. Only a limited number of gadolinium-enhancing lesions at baseline (mean 0.77 and 0.92 at 1.5T and 3T, respectively) and new T2 lesions at the 2 follow-up visits (mean 0.62 and 0.42 at 1.5T and 0.67 and 0.55 at 3T) were identified, without statistically significant differences between 1.5T and 3T. This led to a mean total (i.e., over the whole study period) number of T2 lesions of 14.1 at 1.5T (median 9, IQR 3.8–18.5) and 16.1 at 3T (median 10, IQR 4.8–21.5) (p < 0.001).
Table 2.
Number of lesions detected per participant
Figure 1. Mean number of lesions detected per participant per anatomical region.
(A, B) Graphs illustrate the significantly increased detection of periventricular, (juxta)cortical, and deep white matter lesions on 3T in patients with clinically isolated syndrome at baseline (A) and throughout the total study (B) when compared to 1.5T. (C) Graph demonstrates there was no effect of field strength on lesion detection in healthy controls in any anatomical region. As the number of lesions identified in healthy controls is much lower compared to patients, the scale of the graph has been adjusted. To correct for multiple testing, statistical significance was defined as p < 0.01.
When excluding deep white matter lesions and exclusively considering lesions in regions relevant for DIS, the mean total number of lesions was lower, but a difference between the field strengths remained, with a mean of 8.27 at 1.5T (median 6, IQR 3.0–12.3) and 9.00 at 3T (median 6, IQR 2.0–13.0) (p = 0.038). This overall difference between the 2 field strengths stemmed mainly from an increase in periventricular and (juxta)cortical lesions at 3T, similar to baseline lesion counts (figure 2). The number of infratentorial and spinal cord lesions was similar at both field strengths.
Figure 2. Lesion detection on 1.5T and 3T.
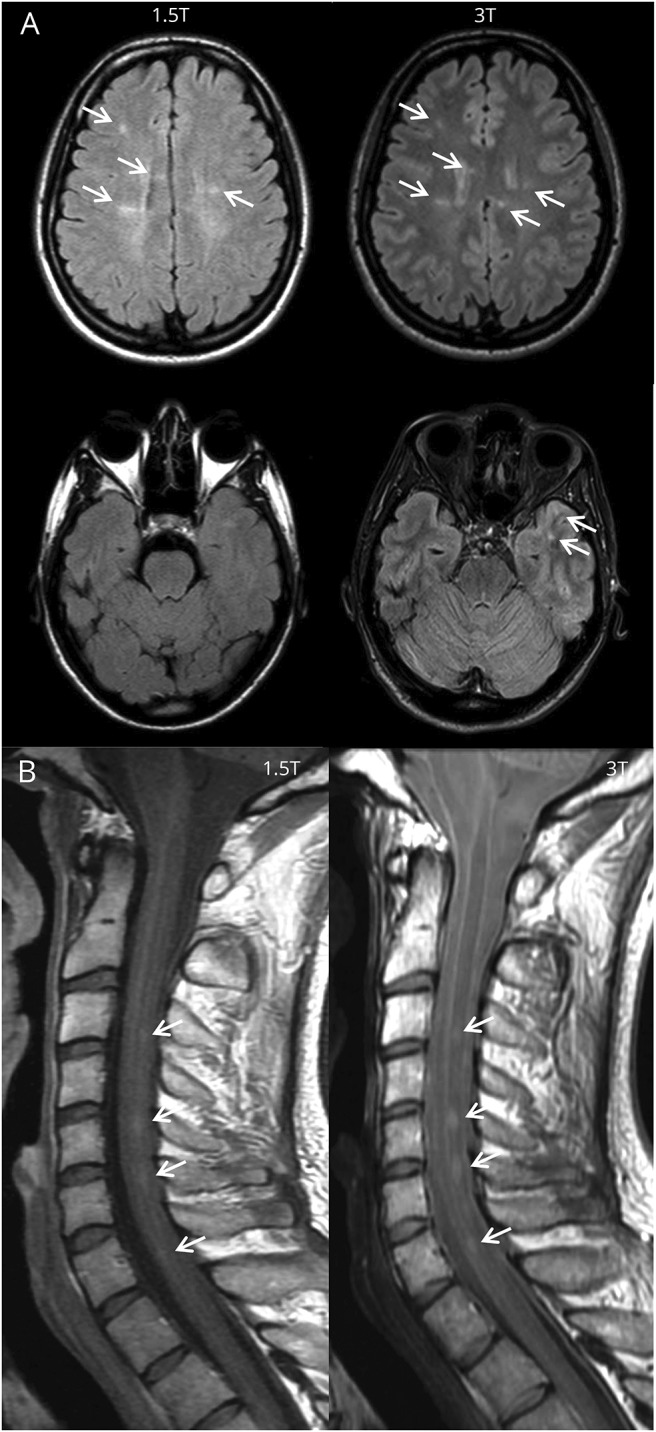
(A) Baseline fluid-attenuated inversion recovery brain imaging of a 28-year-old woman with clinically isolated syndrome presenting with optic neuritis. At 3T, more lesions were identified compared to 1.5T: periventricular lesions 6 vs 6, juxtacortical lesions 6 vs 3, and deep white matter lesions 12 vs 5. On both field strengths, no enhancing lesions were seen. This led to fulfilment of the 2017 revisions of the McDonald criteria for dissemination in space and not for dissemination in time at both 1.5T and 3T. Therefore the diagnosis of MS could not be made on both field strengths. So, even though high-field MRI increased the lesion detection of supratentorial demyelinating lesions in this patient, this did not change the diagnosis. (B) Baseline proton density spinal cord imaging of a 23-year-old man with clinically isolated syndrome, presenting with brainstem symptoms. Besides lesions in the brain, spinal cord lesions were identified on both field strengths. Even though there is a difference in image quality, an equal number of lesions were detected at 1.5T and 3T.
In 11 out of the 26 healthy controls, 1 or more T2 white matter lesions was identified, with a mean number of baseline T2 lesions per participant of 0.81 at 1.5T (median 0, IQR 0.00–1.00) and 1.04 at 3T (median 0, IQR 0.00–1.25) (p = 0.204). As table 2 and figure 1 illustrate, this concerns mostly deep white matter lesions. Only one periventricular lesion was identified at both field strengths and one cerebellar lesion at 3T.
Diagnostic criteria
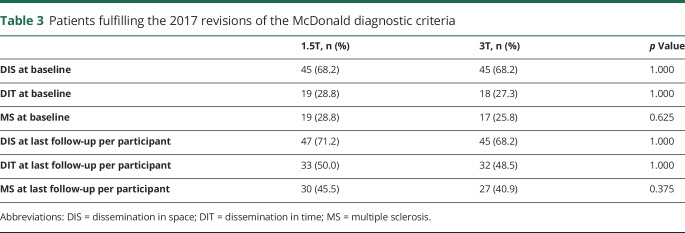
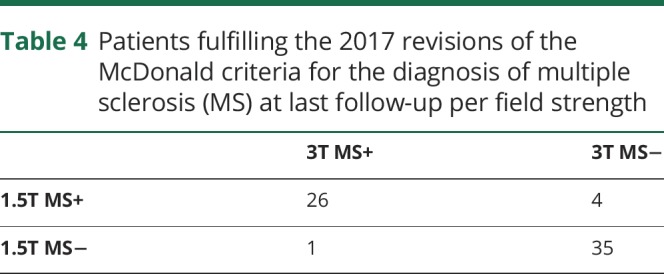
As table 3 describes, approximately 1 out of 4 patients with CIS fulfilled the 2017 revisions of the McDonald criteria for MS at baseline.12 During follow-up, this increased to 40%–45%. The increased T2 lesion detection at 3T, however, did not lead to an increased number of participants fulfilling the criteria for DIS or DIT and subsequently MS at 3T. Surprisingly, there were even slightly more patients classified as DIS and DIT at 1.5T. The difference between the number of patients classified as MS at last follow-up at 1.5T and at 3T resulted from 1 patient with a juxtacortical lesion identified at baseline at 1.5T only, 1 patient with a gadolinium-enhancing brainstem lesion at baseline identified at 1.5T only, 1 patient with a gadolinium-enhancing spinal cord lesion identified at 3T only, and 2 patients with a new periventricular lesion during follow-up identified at 1.5T only (table 4).
Table 3.
Patients fulfilling the 2017 revisions of the McDonald diagnostic criteria
Table 4.
Patients fulfilling the 2017 revisions of the McDonald criteria for the diagnosis of multiple sclerosis (MS) at last follow-up per field strength
In addition, the 2010 revisions of the McDonald criteria and the 2016 proposed MAGNIMS criteria were evaluated.19,20 For neither of these criteria was there a difference in DIS, DIT, or MS between the 2 field strengths (details not shown).
With the very limited numbers of lesions in healthy controls, none of these participants fulfilled the diagnostic criteria for DIS and therefore no controls could be classified as radiologically isolated syndrome. As no gadolinium was administered and no follow-up scans were performed, DIT could not formally be assessed for healthy controls.
Discussion
This prospective, multicenter, and multivendor study confirms the previously reported significantly increased detection of T2 brain lesions at 3T.16,21,22 As a novel finding, we show that spinal cord lesion detection is not adversely affected by high field strength. More importantly, we show that the significantly higher cerebral lesion detection rate at 3T did not lead to an increased frequency or earlier diagnosis of MS based on either the 2010 or 2017 revisions of the McDonald diagnostic criteria. Hence, the clinical relevance of an improved lesion identification at 3T MRI is very limited in the diagnostic workup of patients with CIS.
An increased lesion detection rate at 3T was seen in periventricular, (juxta)cortical, and deep white matter regions. Contrary to previous research, in our study, 3T did not improve identification of infratentorial lesions.16 One possible explanation is that we used 3D sequences with near isotropic resolution at both field strengths, where a previous study used 5-mm-thick axial sequences.16 Our findings suggest that for detecting infratentorial lesions, optimizing acquisition protocols is more important than scheduling the patient for a 3T examination.
In contrast to previous studies,16,21,22 we also studied the performance of spinal cord imaging at 3T. Spinal cord lesions are not only relevant for the fulfilment of the criteria for DIS and DIT, but are also predictive of conversion to clinically definite MS.23,24 As spinal cord imaging is prone to artefacts related to CSF and vascular pulsation artefacts and patient motion caused by breathing and swallowing, interpretation of these images can be challenging.25 Due to increased susceptibility effects, these issues are aggravated at 3T MRI. Contrary to expectations, we found that identification of spinal cord lesions was not adversely affected by different field strength. In addition, interrater agreement for the detection of spinal cord lesions has been found to be higher at 3T compared to 1.5T.18 Our results suggest that spinal cord lesion detection does not suffer more from artefacts at 3T than at 1.5T and therefore 3T MRI can also be used for diagnostic scans in patients presenting with a spinal cord syndrome.
A tendency towards an increased detection rate of gadolinium-enhancing lesions was seen at 3T. An increased detection of enhancing lesions could be expected at 3T. As T1 relaxation times in brain tissue are increased by high field strength, the contrast between brain tissue and the T1-shortening effect of gadolinium is increased.22 This relatively increased T1 contrast between brain tissue and gadolinium enhancement makes enhancing lesions easier to detect. The relatively small number of enhancing lesions in this cohort could be an explanation for the difference in detection rate not reaching statistically significance.
Subsequent evaluation of the diagnostic criteria for MS did not result in a significant difference in patients with CIS classified as DIS or DIT between the 2 field strengths. This extends the findings from previous single-center studies19,26 and indicates that, even though 3T slightly increases the detection rate of demyelinating lesions, high-field MRI does not allow a higher number of patients with CIS to be diagnosed with MS. Therefore, diagnostic scans for patients with CIS can be acquired at either 1.5T or 3T, provided protocols are well-optimized.
However, the differences in lesion detection between 1.5T and 3T point out the relevance of the magnetic field strength in the follow-up of an individual participant. In clinical practice, the possibility exists that baseline and follow-up scans for one patient will be acquired at different vendors using different field strengths. If so, it is important to realize the effect of field strength on the detection of T2 lesions, so as not to confuse an increased or decreased lesion detection resulting from the technical properties of the scan with actual disease activity in that patient.27
Adding to the previously mentioned studies comparing 1.5T and 3T, we also recruited 26 healthy controls. This is highly relevant, as the improved image quality of high-field MRI allows not only for an increased detection of demyelinating lesions but also of nonspecific white matter lesions presumably due to ischemic small vessel disease, which occurred in ±40% of our control group. In CIS and even in established MS, it is not always possible to differentiate disease-specific pathology from white matter lesions related to age or comorbidity, but such nonspecific focal lesions can be analyzed in healthy controls. Overall, no statistically significant difference in lesion detection between the 2 field strengths could be demonstrated for the healthy controls. However, a tendency towards an increase in deep white matter lesions was seen. These nonspecific lesions could also in part explain the higher detection rate of deep white matter lesions in patients with CIS. On the other hand, there was no effect of 3T on identification of lesions in the anatomical regions relevant for DIS in healthy controls and imaging at high field strength did not lead to any healthy control being classified as a radiologic isolated syndrome. These results in healthy controls support the conclusion in patients with CIS that for diagnostic purposes 1.5T and 3T vendors perform similarly.
Beyond high-field MRI, various aspects of MS lesion detection are also being evaluated on ultra-high-field MRI.28–30 It remains uncertain whether the benefit of a further improved signal-to-noise ratio and an increased resolution will be of clinical relevance. As to be expected, 7T increases the detection rate of T2 lesions, especially for cortical gray matter lesions.31 It remains to be evaluated if this will influence the fulfilment of the diagnostic criteria for MS in multicenter studies.
Taken together, even though there is a slightly increased detection of periventricular and (juxta)cortical lesions at 3T compared to 1.5T, this does not affect the diagnosis for patients with CIS suggestive of MS. Adding to this the similar performance in detection of spinal cord lesions and gadolinium-enhancing lesions, there is no real added clinical benefit in opting for either one of the field strengths. Altogether, 3T has no added value in the diagnostic workup of patients with CIS.
Acknowledgment
The authors thank the following MAGNIMS steering committee members for their contribution to the study design and interpretation of the data: Tarek Yousry, MD, PhD (Queen Square MS Centre, UCL Institute of Neurology); Nicola De Stefano, MD, PhD (University of Siena); Christian Enzinger, MD, PhD (Medical University of Graz); Massimo Filippi, MD, PhD (San Raffaele Scientific Institute, Vita-Salute San Raffaele University); Maria A. Rocca (San Raffaele Scientific Institute, Vita-Salute San Raffaele University); Jette L. Frederiksen, MD, PhD (Glostrup Hospital and University of Copenhagen); Ludwig Kappos, MD, PhD (University of Basel); Jacqueline Palace, MD, PhD (University of Oxford Hospitals Trust); Alex Rovira, MD, PhD (Hospital Universitari Vall d’Hebron, Universitat Autònoma de Barcelona); Jauma Sastre-Garriga, MD, PhD (Hospital Universitari Vall d'Hebron, Universitat Autònoma de Barcelona); Hugo Vrenken, MD, PhD (MS Centre VU University Medical Centre Amsterdam).
Glossary
- CIS
clinically isolated syndrome
- DIS
dissemination in space
- DIT
dissemination in time
- EDSS
Expanded Disability Status Scale
- IQR
interquartile range
- MAGNIMS
Magnetic Resonance Imaging in Multiple Sclerosis
- MS
multiple sclerosis
- PD
proton density
- T1WI
T1-weighted imaging
- T2WI
T2-weighted imaging
Footnotes
CME Course: NPub.org/cmelist
Author contributions
The study was designed by I.D.K., M.P.W., and F.B. Data were collected by M.H.J.H., J.B., I.D.K., N.C., E.S., M. Andelova, M. Amann, J.M.L., P.P., J.K., C.O.-G., O.C., C.G., C.L., M.P.W., and F.B. Analysis of the data was performed by M.H.J.H., M.L.d.V., M.P.W., and F.B. Statistical analysis was done by M.H.J.H. and B.I.L.-W. The manuscript was drafted by M.H.J.H. and all other authors critically revised the manuscript for important intellectual content.
Study funding
This study has received funding from a program grant (14-358e) from the Dutch MS Research Foundation (Voorschoten, the Netherlands).
Disclosure
M. Hagens, J. Burggraaff, I. Kilsdonk, M. de Vos, N. Cawley, and E. Sbardella report no disclosures relevant to the manuscript. M. Andelova received travel and conference fees support from Novartis and Biogen. M. Amann and J. Lieb report no disclosures relevant to the manuscript. P. Pantano has received funding for travel from Novartis, Genzyme, and Bracco and speaker honoraria from Biogen. B. Lissenberg-Witte reports no disclosures relevant to the manuscript. J. Killestein has accepted speaker and consultancy fees from Merck-Serono, Teva, Biogen, Genzyme, Roche, and Novartis. C. Oreja-Guevara received honoraria as speaker from Biogen-Idec, Roche, Merck-Serono, Teva, Genzyme, and Novartis. O. Ciccarelli is supported by the National Institute for Health Research University College London Hospitals Biomedical Research Centre and serves as a consultant for Biogen, Roche, Teva, Genzyme, and Novartis. C. Gasperini received fees as speaker for Bayer-Schering Pharma, Sanofi-Aventis, Genzyme, Biogen, Teva, Novartis, and Merck-Serono, and received a grant for research by Teva. C. Lukas holds an endowed professorship supported by the Novartis Foundation, has received consulting and speaker's honoraria from Biogen-Idec, Bayer Schering, Novartis, Sanofi, Genzyme, and TEVA, and has received research scientific grant support from Merck-Serono and Novartis. M. Wattjes serves as a consultant for Roche, Novartis, and Biogen. F. Barkhof serves as a consultant for Bayer-Schering Pharma, Sanofi-Aventis, Genzyme, Biogen, Teva, Novartis, Roche, Synthon BV, and Jansen Research. Go to Neurology.org/N for full disclosures.
References
- 1.Bakshi R, Thompson AJ, Rocca MA, et al. MRI in multiple sclerosis: current status and future prospects. Lancet Neurol 2008;7:615–625. [DOI] [PMC free article] [PubMed] [Google Scholar]
- 2.Paty DW, Oger JJ, Kastrukoff LF, et al. MRI in the diagnosis of MS: a prospective study with comparison of clinical evaluation, evoked potentials, oligoclonal banding, and CT. Neurology 1988;38:180–185. [DOI] [PubMed] [Google Scholar]
- 3.Dekker I, Wattjes MP. Brain and spinal cord MR imaging features in multiple sclerosis and variants. Neuroimaging Clin N Am 2017;27:205–227. [DOI] [PubMed] [Google Scholar]
- 4.Fazekas F, Barkhof F, Filippi M, et al. The contribution of magnetic resonance imaging to the diagnosis of multiple sclerosis. Neurology 1999;53:448–456. [DOI] [PubMed] [Google Scholar]
- 5.McDonald WI, Compston A, Edan G, et al. Recommended diagnostic criteria for multiple sclerosis: guidelines from the International Panel on the Diagnosis of Multiple Sclerosis. Ann Neurol 2001;50:121–127. [DOI] [PubMed] [Google Scholar]
- 6.Rovira A, Wattjes MP, Tintore M, et al. Evidence-based guidelines: MAGNIMS consensus guidelines on the use of MRI in multiple sclerosis: clinical implementation in the diagnostic process. Nat Rev Neurol 2015;11:471–482. [DOI] [PubMed] [Google Scholar]
- 7.Polman CH, Reingold SC, Banwell B, et al. Diagnostic criteria for multiple sclerosis: 2010 revisions to the McDonald criteria. Ann Neurol 2011;69:292–302. [DOI] [PMC free article] [PubMed] [Google Scholar]
- 8.Beck RW, Trobe JD, Moke PS, et al. High- and low-risk profiles for the development of multiple sclerosis within 10 years after optic neuritis: experience of the Optic Neuritis Treatment Trial. Arch Ophthalmol 2003;121:944–949. [DOI] [PubMed] [Google Scholar]
- 9.Fisniku LK, Brex PA, Altmann DR, et al. Disability and T2 MRI lesions: a 20-year follow-up of patients with relapse onset of multiple sclerosis. Brain 2008;131:808–817. [DOI] [PubMed] [Google Scholar]
- 10.Minneboo A, Barkhof F, Polman CH, Uitdehaag BM, Knol DL, Castelijns JA. Infratentorial lesions predict long-term disability in patients with initial findings suggestive of multiple sclerosis. Arch Neurol 2004;61:217–221. [DOI] [PubMed] [Google Scholar]
- 11.Tintore M, Rovira A, Rio J, et al. Defining high, medium and low impact prognostic factors for developing multiple sclerosis. Brain 2015;138:1863–1874. [DOI] [PubMed] [Google Scholar]
- 12.Thompson AJ, Banwell BL, Barkhof F, et al. Diagnosis of multiple sclerosis: 2017 revisions of the McDonald criteria. Lancet Neurol 2018;17:162–173. [DOI] [PubMed] [Google Scholar]
- 13.Kilsdonk ID, de Graaf WL, Barkhof F, Wattjes MP. Inflammation high-field magnetic resonance imaging. Neuroimaging Clin N Am 2012;22:135–157. [DOI] [PubMed] [Google Scholar]
- 14.Wattjes MP, Barkhof F. High field MRI in the diagnosis of multiple sclerosis: high field-high yield? Neuroradiology 2009;51:279–292. [DOI] [PubMed] [Google Scholar]
- 15.Wattjes MP, Rovira A, Miller D, et al. Evidence-based guidelines: MAGNIMS consensus guidelines on the use of MRI in multiple sclerosis: establishing disease prognosis and monitoring patients. Nat Rev Neurol 2015;11:597–606. [DOI] [PubMed] [Google Scholar]
- 16.Wattjes MP, Lutterbey GG, Harzheim M, et al. Higher sensitivity in the detection of inflammatory brain lesions in patients with clinically isolated syndromes suggestive of multiple sclerosis using high field MRI: an intraindividual comparison of 1.5 T with 3.0 T. Eur Radiol 2006;16:2067–2073. [DOI] [PubMed] [Google Scholar]
- 17.Simon B, Schmidt S, Lukas C, et al. Improved in vivo detection of cortical lesions in multiple sclerosis using double inversion recovery MR imaging at 3 Tesla. Eur Radiol 2010;20:1675–1683. [DOI] [PMC free article] [PubMed] [Google Scholar]
- 18.Hagens MH, Burggraaff J, Kilsdonk ID, et al. Impact of 3 Tesla MRI on interobserver agreement in clinically isolated syndrome: a MAGNIMS multicentre study. Mult Scler Epub 2018. [DOI] [PMC free article] [PubMed] [Google Scholar]
- 19.Kilsdonk ID, Barkhof F, Wattjes MP. 2010 revisions to McDonald criteria for diagnosis of multiple sclerosis: impact of 3-Tesla magnetic resonance imaging. Ann Neurol 2011;70:182–183. [DOI] [PubMed] [Google Scholar]
- 20.Filippi M, Rocca MA, Ciccarelli O, et al. MRI criteria for the diagnosis of multiple sclerosis: MAGNIMS consensus guidelines. Lancet Neurol 2016;15:292–303. [DOI] [PMC free article] [PubMed] [Google Scholar]
- 21.Nielsen K, Rostrup E, Frederiksen JL, et al. Magnetic resonance imaging at 3.0 Tesla detects more lesions in acute optic neuritis than at 1.5 Tesla. Invest Radiol 2006;41:76–82. [DOI] [PubMed] [Google Scholar]
- 22.Sicotte NL, Voskuhl RR, Bouvier S, Klutch R, Cohen MS, Mazziotta JC. Comparison of multiple sclerosis lesions at 1.5 and 3.0 Tesla. Invest Radiol 2003;38:423–427. [DOI] [PubMed] [Google Scholar]
- 23.Bot JC, Barkhof F, Polman CH, et al. Spinal cord abnormalities in recently diagnosed MS patients: added value of spinal MRI examination. Neurology 2004;62:226–233. [DOI] [PubMed] [Google Scholar]
- 24.Sombekke MH, Wattjes MP, Balk LJ, et al. Spinal cord lesions in patients with clinically isolated syndrome: a powerful tool in diagnosis and prognosis. Neurology 2013;80:69–75. [DOI] [PubMed] [Google Scholar]
- 25.Bot JC, Barkhof F. Spinal-cord MRI in multiple sclerosis: conventional and nonconventional MR techniques. Neuroimaging Clin N Am 2009;19:81–99. [DOI] [PubMed] [Google Scholar]
- 26.Wattjes MP, Harzheim M, Lutterbey GG, et al. Does high field MRI allow an earlier diagnosis of multiple sclerosis? J Neurol 2008;255:1159–1163. [DOI] [PubMed] [Google Scholar]
- 27.Wattjes MP, Steenwijk MD, Stangel M. MRI in the diagnosis and monitoring of multiple sclerosis: an update. Clin Neuroradiol 2015;25(suppl 2):157–165. [DOI] [PubMed] [Google Scholar]
- 28.Kilsdonk ID, Jonkman LE, Klaver R, et al. Increased cortical grey matter lesion detection in multiple sclerosis with 7 T MRI: a post-mortem verification study. Brain 2016;139:1472–1481. [DOI] [PubMed] [Google Scholar]
- 29.Sinnecker T, Kuchling J, Dusek P, et al. Ultrahigh field MRI in clinical neuroimmunology: a potential contribution to improved diagnostics and personalised disease management. EPMA J 2015;6:16. [DOI] [PMC free article] [PubMed] [Google Scholar]
- 30.Tallantyre EC, Dixon JE, Donaldson I, et al. Ultra-high-field imaging distinguishes MS lesions from asymptomatic white matter lesions. Neurology 2011;76:534–539. [DOI] [PMC free article] [PubMed] [Google Scholar]
- 31.de Graaf WL, Kilsdonk ID, Lopez-Soriano A, et al. Clinical application of multi-contrast 7-T MR imaging in multiple sclerosis: increased lesion detection compared to 3 T confined to grey matter. Eur Radiol 2013;23:528–540. [DOI] [PubMed] [Google Scholar]
Associated Data
This section collects any data citations, data availability statements, or supplementary materials included in this article.
Data Availability Statement
The data that support the findings of this study are available from the corresponding author (M.H.J.H.) upon reasonable request and approval by the MAGNIMS steering committee.


