

Abstract
Acetylcholine (ACh) release in the cortex is critical for learning, memory, attention, and plasticity. Here, we explore the cholinergic and noncholinergic projections from the basal forebrain (BF) to the auditory cortex using classical retrograde and monosynaptic viral tracers deposited in electrophysiologically identified regions of the auditory cortex. Cholinergic input to both primary (A1) and nonprimary auditory cortical (belt) areas originates in a restricted area in the caudal BF within the globus pallidus (GP) and in the dorsal part of the substantia innominata (SId). On the other hand, we found significant differences in the proportions of cholinergic and noncholinergic projection neurons to primary and nonprimary auditory areas. Inputs to A1 projecting cholinergic neurons were restricted to the GP, caudate-putamen, and the medial part of the medial geniculate body, including the posterior intralaminar thalamic group. In addition to these areas, afferents to belt-projecting cholinergic neurons originated from broader areas, including the ventral secondary auditory cortex, insular cortex, secondary somatosensory cortex, and the central amygdaloid nucleus. These findings support a specific BF projection pattern to auditory cortical areas. Additionally, these findings point to potential functional differences in how ACh release may be regulated in the A1 and auditory belt areas.
Keywords: monosynaptic viral tracing, primary and secondary auditory cortex
Introduction
Learning-induced plasticity in the auditory cortex is a well-documented phenomenon. For example, learning a tone can cause its frequency representation to expand in the primary auditory cortex (A1; Bakin and Weinberger 1990; Kisley and Gerstein 2001; Weinberger 2004). The degree of increase in the tone representation has been correlated with behavioral importance (Rutkowski and Weinbeger 2005; Weinberger 2007) and memory strength (Bieszczad and Weinberger 2010), compatible with the notion that these types of cortical changes underlie learning and memory.
The basal forebrain (BF) provides cholinergic input to the entire cerebral cortex, including the auditory cortex (Mesulam et al. 1983). Acetylcholine (ACh) release is a critical component for plasticity in the primary auditory cortex (A1). Leach et al. (2013) found that cholinergic lesions of auditory-projecting BF cells were sufficient to impair sound localization, as well as learning-induced plasticity. Furthermore, Butt et al. (2009) showed that ACh release measured in A1 increased in parallel to behavioral learning during auditory classical conditioning. Simply pairing a tone with electrical stimulation of the BF is sufficient to induce plasticity similar to that observed during natural learning (Bakin and Weinberger 1996; Bjordahl et al. 1998; Kilgard and Merzenich 1998). Additionally, BF stimulation-induced plasticity has been observed in the secondary auditory cortex (A2; Puckett et al. 2007). In some cases, plasticity in A2 was reported to occur to a greater degree than the plasticity observed in A1 (Diamond and Weinberger 1984, 1986; Puckett et al. 2007), suggesting potential differences in the BF innervation pattern between A1 and A2.
Despite the strong evidence for the functional role of ACh in auditory processes, the anatomical circuitry that supports the release of ACh in the auditory cortex is not well understood. It has been hypothesized that the amygdala serves as a critical input to the cholinergic cells involved in learning-induced plasticity in A1 (Weinberger et al. 1990, 1993; Suga and Ma 2003). Indeed, electrophysiological stimulation of the basolateral amygdala paired with tone presentation results in plasticity in A1 (Chavez et al. 2009, 2012, 2013). However, the underlying anatomy that supports the functional relationship between the amygdala, BF, and A1 is unknown. Furthermore, whether such a relationship between amygdala, BF, and nonprimary auditory regions exists is yet to be determined. The differential degree of plasticity observed between the A1 and A2 regions may reflect differential input to auditory-projecting cholinergic neurons and/or differential cholinergic innervation of auditory cortical areas.
To elucidate the underlying anatomy, the current experiments use electrophysiological identification of auditory cortical subdivisions in combination with classical retrograde tracing to investigate the cholinergic inputs to A1 and auditory belt cortical areas. Additionally, the current experiment uses monosynaptic viral tracing techniques (Watabe-Uchida et al. 2012) to describe the direct input to the auditory cortically projecting cholinergic BF cells in Chat::Cre transgenic rats (Witten et al. 2011).
Materials and Methods
Subjects
Seventeen male adult Sprague Dawley rats (Harlan, ) were used for the retrograde tracing studies. In addition, Chat::Cre transgenic rats were donated from the Deisseroth group (Witten et al. 2011) and were bred to generate 8 adult Chat::Cre transgenic rats (3 male, 5 female; ) that were used for viral tracing experiments. Rats were housed in a vivarium (maintained at 22 °C, 12/12 h light–dark cycle) with ad libitum access to food and water. All procedures were performed in accordance with the Rutgers, The State University of New Jersey Animal Research Committee, the Society for Neuroscience's policies on the use of animals in neuroscience research, and the NIH Animal Welfare guidelines.
Electrophysiology
To minimize cortical damage, the number of cortical recording sites was limited to what was sufficient to distinguish A1 from the belt area. On average, a total of 6 penetrations (4–8 for A1 and 4–12 for belt areas) were needed to identify any one cortical region of interest. Multiunit extracellular recordings were made with a linear 4-electrode array (305–505 µm separation) of Parylene-coated tungsten microelectrodes (0.2–3.0 MΩ, FHC, Bowdoin, ME, USA), in Layers IV–V of auditory cortex. Neural activity was amplified (1000×), bandpass filtered (0.3–3.0 kHz, Digidata 1440a; Molecular Devices, Sunnyvale, CA, USA), and monitored via pCLAMP software (Molecular Devices). A calibrated speaker (MF1; Tucker-Davis Technologies, Alachua, FL, USA) was placed at the ear contralateral to the craniotomy. Acoustic stimuli were generated using Tucker-Davis Technologies hardware and MATLAB software (MathWorks, Natick, MA, USA). First, white noise stimuli (1.0–50.0 kHz) were presented every 700 ms (0–80 dB SPL in 10 dB SPL steps) 10 times, to determine threshold response. Then, pure tone bursts (50 ms duration, cosine-squared gate, rise/fall time of 10 ms) of 0.5–54.0 kHz were presented every 700 ms from 0 to 80 dB SPL (sound pressure level) in 10 dB steps (252 stimuli combinations) and repeated 7 times pseudo-randomly to determine frequency response. Frequency response areas (FRA) were created offline (MATLAB custom software) using evoked spike-time data, 6–40 ms following tone onset (see Supplementary Fig. 1). Baseline recordings were taken during a 0–50 ms time window before tone presentation. Evoked activity was defined as activity ≥2.5 SE above mean spontaneous baseline activity. The characteristic frequency (CF) was the frequency that elicited an evoked discharge at the lowest dB SPL, If >1 stimulus frequency was elicited at the same dB SPL, then the frequency that elicited the greatest number of spikes was identified as the CF. A1 was defined by a general progression of low to high CFs along the posterior to anterior axis. Anterior placements that resulted in a reversal in the CF progression were defined as lying in the anterior auditory field (AAF; Rutkowski et al. 2003). Furthermore, the posterior dorsal auditory field (PDAF) belt area was identified as more responsive to noise than to tone (Rutkowski et al. 2003). We identified the suprarhinal auditory field (SRAF; Polley et al. 2007; Profant et al. 2013), as the auditory responsive region just above the rhinal sulcus.
Retrograde Tracing Surgical Procedure
Sprague Dawley rats were anesthetized with ketamine/xylazine (100 mg/kg ketamine, Ketaset; 1 mg/kg xylazine, AnaSed Injection; i.p.; Henry Schein, Dublin, OH, USA) anesthesia, bronchial secretions were minimized by treatment with atropine sulfate (0.25 mg/kg, i.m.), and body temperature was maintained at 37°C with a homeothermic heating pad (Gaymar T/pump warm water recirculator and heating pad). Subjects were secured to a stereotaxic frame via a pedestal created with dental acrylic (Ortho-Jet BCA powder and liquid; Henry Schein) and skull screws, such that the ears were not obstructed by earbars. A craniotomy was made over the right auditory cortex, and the dura was resected. Following the electrophysiological identification of different auditory cortical regions, either Fluoro-Gold (FG; 2.0% in 0.9% saline; Fluorochrome LLC; Denver, CO, USA) or Fast Blue (FB; Sigma-Aldrich, St Louis, MO, USA) was ionotophoretically (5 µA; 7 s on/off for 5–7 min) or pressure injected, respectively. In 2 separate cases, a nonoverlapping injection of FG into A1 and FB into an auditory belt area was accomplished within a single rat. In addition to electrophysiological identification of tracer placement, retrograde labeling within the auditory thalamus provided supplementary confirmation of the location of the cortical injection site.
Rats with retrograde labeling primarily limited to the ventral division of the medial geniculate body (MGV) of the thalamus were considered successfully labeled within A1 or AAF (Lee and Winer 2008). On the other hand, retrograde labeling primarily confined within the dorsal division of the medial geniculate body (MGD) confirmed injection sites within secondary/belt auditory cortex (Lee and Winer 2008).
Monosynaptic Tracing Surgical Procedure
Rabies monosynaptic virus tracing (Wickersham et al. 2007; Watabe-Uchida et al. 2012) was used in Chat::Cre transgenic rats expressing Cre under the choline acetyl transferase promoter (Witten et al. 2011). Rats were anesthetized with isoflurane (Isothesia, Henry Schein), and helper viruses (AAV-EF1a-FLEX-TVAmCherry and AAV-CA-FLEX-RG, Watabe-Uchida et al. 2012; UNC vector core) were first injected in the BF area that contains the auditory cortically projecting BF cholinergic cells (see Results). Thus, mCherry fluorescent marker, TVA viral receptor (found in birds but not in mammals), and rabies virus envelope glycoprotein (RG) are expressed in a Cre-dependent manner in cholinergic cells. Following 21 days of recovery, rats were again anesthetized with a K/X mixture (see above), and the auditory cortex was identified electrophysiologically (see above). Modified rabies pseudotyped with the avian virus envelope (EnvA G-deleted rabies e-GFP; Watabe-Uchida et al. 2012; Salk Vector Core) was injected into the identified cortical region. We limited the size of the rabies injection to prevent any spillover into adjacent cortical regions. In each case, a 0.2 µL injection was made in each identified cortical region. The modified rabies restricts infection to TVA receptor-expressing cells. Also, the rabies virus lacks the RG necessary for transynaptic spread of the virus. This procedure results in specific infection of mCherry/TVA-expressing cholinergic cells (previously infected with helper viruses) and restricts transynaptic spread of the rabies virus to cells monosynaptically connected to these cholinergic neurons (Ginger et al. 2013; Callaway and Luo 2015). Double-labeled e-GFP (modified rabies) and mCherry (helper virus) cells are cholinergic neurons (starter cells) that projected to the target auditory cortical region, whereas e-GFP-positive singly labeled cells indicate monosynaptic (afferent) input to the starter cells.
Histology
After a 7-day survival period, subjects were given an overdose of urethane. They were then perfused transcardially with physiological saline, followed by 500 mL of cold fixative consisting of 4% paraformaldehyde in 0.1 M phosphate buffer (pH = 6.9). After perfusion, the brains were removed and post-fixed overnight in the same fixative. Brains were cryoprotected in 30% sucrose solution in 0.1 M phosphate buffer. Subsequently, 50-µm-thick coronal sections were cut on a sliding microtome. Sections were collected and every fourth section was mounted and coverslipped with DPX (BDH Chemicals, Ltd). Another series of every fourth section was stained for choline acetyltransferase (ChAT) using a monoclonal goat anti-ChAT antibody (1:500, 24 h; Boehringer-Mannheim) and CY3-conjugated anti-goat secondary antibody (1:200, 3 h; Vector). To confirm specificity of viral targeting, sections from 1 case of helper virus-injected animal were immunostained for ChAT. Following incubation in monoclonal goat anti-ChAT antibody, sections were incubated in CY2-conjugated anti-goat secondary antibody (1:200, 3 h; Vector). In another series, mCherry helper virus signal was enhanced with mCherry antibody staining. Briefly, sections were incubated in polyclonal rabbit anti-mCherry antibody (1:500, 24 h; abcam) followed by incubation in CY3-conjugated donkey anti-rabbit secondary antibody (1:200, 3 h; Jackson Immuno Research Inc.). Finally, 1 series of monosynaptically labeled brains was used for further DAB staining. Sections were first wet mounted onto slides and imaged for e-GFP and mCherry expression. Next, sections were removed from the slides and incubated in rabbit anti-GFP antibody (1:1000, 24 h; Invitrogen) and biotinylated donkey anti-rabbit IgG (1:200, 3 h; Jackson Immuno Research Inc.). Sections were then incubated in the A and B component of the ABC kit (1:500, 2 h; Vector Laboratories) followed by a rinse in 0.1 M PB (2 h). Then sections were placed in DAB reaction solution until cells were sufficiently stained (20 mg DAB, 50 mL TBS, 1 mL 0.03% hydrogen peroxide). Following the immunostaining, the sections were coverslipped with DPX.
Data Analysis
A portion of the images were acquired using an Olympus Fluoview (FV100) confocal microscope with the appropriate excitation/emission laser settings (mCherry: 559/567; e-GFP: 488/504). All other images were acquired using a Zeiss epifluorescent microscope (Axioscop) with appropriate filter set (UV G365/LP420; Blue BP450/490-LP520 and Green BP546/12-LP590 AXIO). Fluorescently labeled cells were mapped from every fourth sections at a magnification of ×20 using an interactive computer system connected to the microscope equipped with the Neurolucida® software package (MicroBrightField, Inc., Williston, VT, USA). Each mapped section was normalized to a zero point identified as the crossing of the anterior commissure, which we refer to hereafter as bregma. Sections were then recorded in 200 µm steps relative to this reference point using Neurolucida® software. Following mapping with the epifluorescent microscope, coverslips were removed and sections were re-stained with thionin to identify cytoarchitectonic areas. Images of the Nissl-stained sections were overlaid with the appropriate mapping files using the Neurolucida® “virtual slice module.” All mapping data were then exported via Neurolucida Explorer software (MicroBrightField, Inc.) for further analysis. For retrograde tracing, cell counts per mapped section (in relative distance to the reference point from 1 in 4 series, 50-µm-thick section) were normalized to the total number of cells for each animal and then averaged. We also calculated the number of cells normalized to injection volume. The injection volume was computed from the mapped surface values in each mapped section and the section distances using the Neurolucida Explorer formula. Statistical analyses were conducted using 2-tailed t-tests comparing the 2 groups (A1 vs. belt). In the virus-tracing experiments, we normalized the monosynaptically labeled afferent cell counts to the number of double-labeled starter cells (auditory-projecting cholinergic cells) for each individual case (afferents/starter cell total). Statistical analyses were conducted using 2-tailed t-tests (A1 vs. belt).
In this text, we use the term SId (substantia innominata, dorsal part) as defined by Grove (1988) and Bourgeais et al. (2001) to describe a narrow zone between the internal capsule and optic tract that blends into the caudal part of the globus pallidus (GP). In other terms, we adhered to the nomenclature adapted by Paxinos and Watson (2005).
Results
Retrograde Tracing from the Primary Auditory Cortex
Of the 17 animals that were injected with retrograde tracer, 8 injections were confirmed in A1 and 4 were confirmed in belt areas. All other cases were excluded from further analysis due to spill over into somatosensory cortex (n = 2, confirmed through thalamic labeling; see Supplementary Fig. 2A) or overlapping injections between A1 and belt areas (n = 3, see Supplementary Fig. 2B).
In A1 injected animals, all cases showed retrograde labeling primarily in the MGV and in the caudal part of the BF. Figure 1A–E is a representative case (#13012) of the distribution of labeled cells in the BF after injection of Fluro-Gold (FG) into A1, displayed in a series of rostro-caudal sections. Retrogradely labeled cells were confined to the caudal part of the substantia innominata (SId) and GP (Fig. 1A–C). Most of the A1 projecting BF cells were located 2.4–3.2 mm behind bregma. Figure 2A,B shows the location of A1 projecting cholinergic cells in the BF superimposed on the Nissl-stained section it was mapped from confirming the location of labeled cells within the GP and the SId. In sum, BF cells projecting to A1 are located within the SId and GP and are primarily cholinergic. On average (n = 8), 83.3% of retrogradely labeled cells from the A1 injections were cholinergic while 16.7% were noncholinergic (Table 1). To explore possible cortical layer-specific differences, we examined each injection site and the retrograde labeling in the BF. Six out of the 8 injection cases included all cortical layers, and 2 out of 8 included Layers I–IV. There were no statistical differences in the proportion of retrogradely labeled cholinergic cells between the 2 groups (t = 0.45, df = 6, P = 0.67; Table 1).
Figure 1.
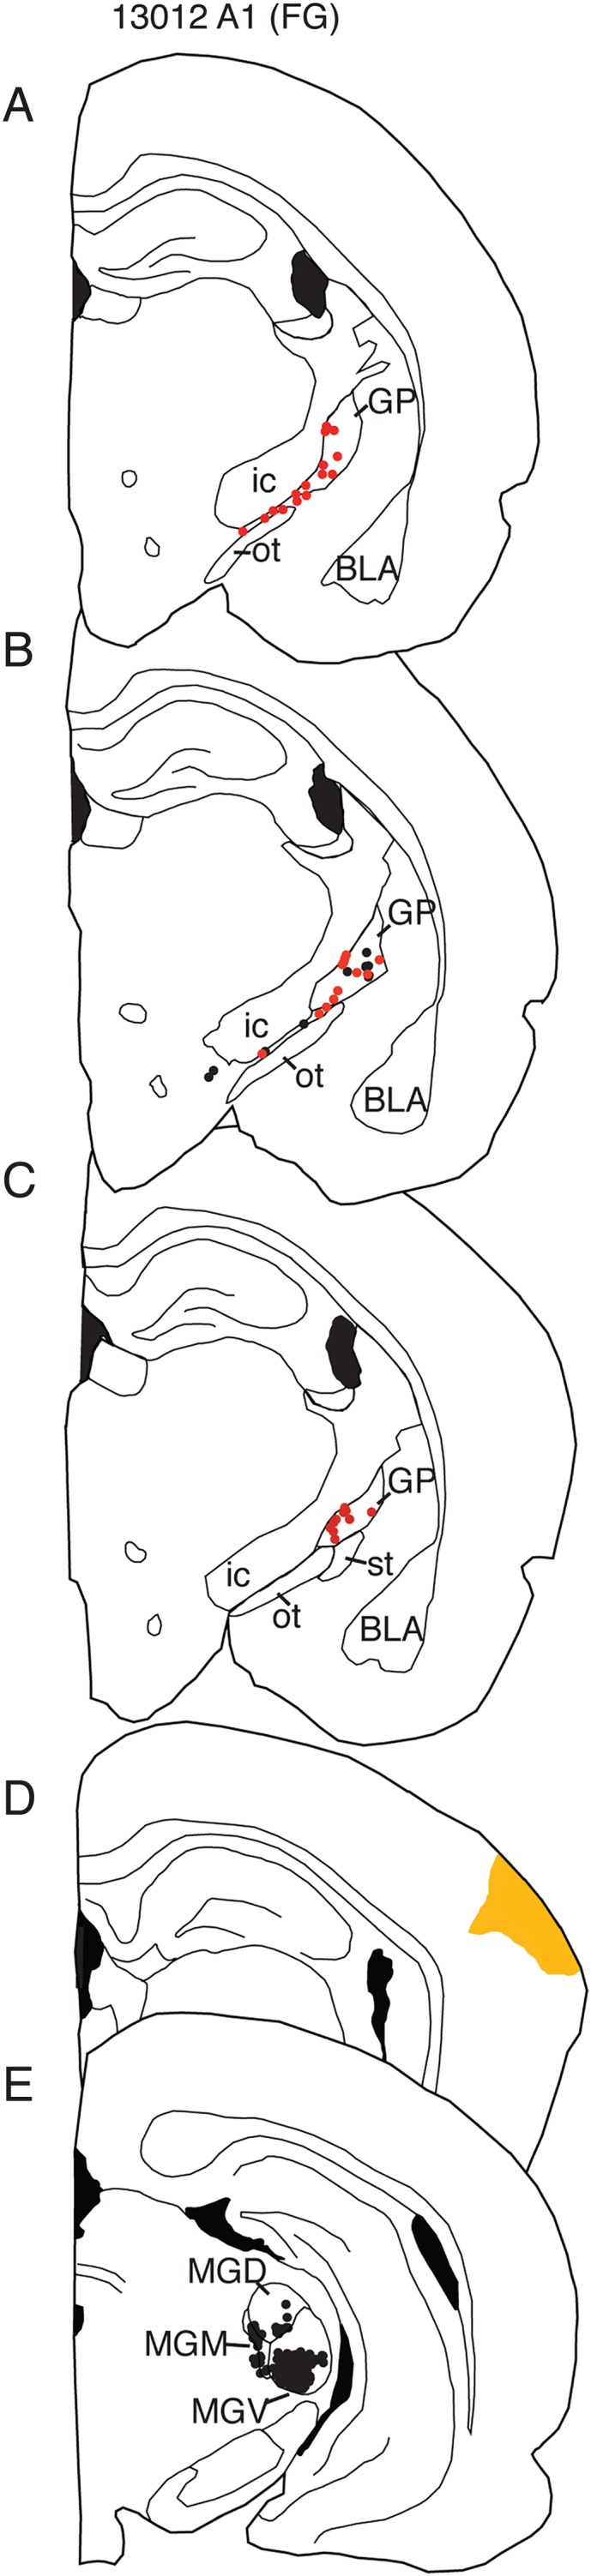
An example of retrograde labeling of BF cells that project to A1 (A–E). Injections of retrograde tracers into the primary auditory cortex resulted in labeling in the most caudal regions of BF, including the SId and GP. The majority of the BF cells projecting to A1 were cholinergic (red dots indicate cholinergic cells; black dots indicate noncholinergic cells). Sid, dorsal part of the substantia inominata; GP, globus pallidus; BLA, basolateral amygdala; ic, internal capsue; ot, optic tract; MGD, dorsal part of the medial geniculate nucleus; MGM, medial part of the medial geniculate nucleus; MGV, ventral part of the medial geniculate nucleus.
Figure 2.

(A) Location of retrogradely labeled cholinergic cells that project to A1 superimposed on the Nissl-stained image A from the same section from which the cells were mapped (B). (A) Note the location of labeled cells within the GP and the area between the internal capsule and optic tract. (C) FG and FB labeled cells from case 13064, with FG injection into the A1 and FB into the SRAF. Blue cells project to belt, yellow cells project to A1, and teal-colored cells project to both A1 and belt (marked with *). (D) The injection sites for A1 and belt and E is the section that the cells from D were mapped from. SRAF, suprarhinal auditory field; f, fornix; mt, mammilothalamic tract.
Table 1.
Individual subject retrograde tracing data
| ID | Location | R non-Chat | R Chat | Total | Inj volume | Inj layer |
|---|---|---|---|---|---|---|
| 13007FG | A1 | 6 | 47 | 53 | 326 754 000 | All |
| 13052FG | A1 | 4 | 17 | 21 | 325 035 000 | All |
| 13085FG | A1 | 8 | 44 | 52 | 835 511 000 | All |
| 13033FG | A1 | 1 | 36 | 37 | 1 532 680 000 | All |
| 13064FG | A1 | 27 | 84 | 111 | 2 454 010 000 | All |
| 13065FG | A1 | 22 | 75 | 97 | 3 552 200 000 | All |
| 13012FG | A1 | 14 | 39 | 53 | 582 844 000 | Layers I–IV |
| 13084FG | A1 | 5 | 38 | 43 | 329 041 000 | Layers I–IV |
| 13064FB | SRAF | 26 | 56 | 82 | 24 280 900 | Layers I–IV |
| 13065FB | SRAF | 68 | 70 | 138 | 1 549 170 000 | Layers I–IV |
| 13143FG | PDAF | 21 | 47 | 68 | 1 503 910 000 | All |
| 13082FG | AAF | 20 | 40 | 60 | 860 290 000 | All |
Note: Individual subject data displaying number of cholinergic and noncholinergic retrogradely labeled cells in the BF (SId and GP). Location refers to the injection site of the retrograde tracer. Injection area is expressed in total µm3.
ID, subject ID followed by tracer used (FB, Fast Blue; FG, Fluoro-Gold); R non-Chat, noncholinergic retrogradely labeled cell counts in the BF; R Chat, cholinergic retrogradely labeled cell counts in the BF; Total, total number of retrogradely labeled cells; Inj. layer, the cortical layers included in the injection sites.
Retrograde Tracing from Nonprimary Auditory Cortical Areas
Figure 2C is an example of retrogradely double-labeled cells projecting to A1 and SRAF in a case where FG and FB were injected into the respective cortical areas and the 2 injection sites were nonoverlapping. On average, 12% of the total retrogradely labeled cells projected to both A1 and SRAF. The majority of the double-labeled cells were also ChAT positive (66.2%).
Injections into non-A1 auditory cortical areas, including PDAF (Fig. 3A–C), SRAF (Fig. 3D–F), and AAF (Fig. 3G–I), resulted in similar retrograde labeling patterns in the BF in 4 rats (Table 1, cholinergic vs. noncholinergic neurons). Although, classically, AAF is considered to be continuous with A1 and receives input from the MGV, previous studies have found physiological differences between these areas (Rutkowski et al. 2003). Additionally, we found that the BF projection is more in line with a belt area pattern than A1 in terms of the proportion of cholinergic or noncholinergic projection neurons (Table 1). Given the similarities in the BF projections among AAF, SRAF, and PDAF regions, and the low number of individual cases, these data are considered together and are collectively referred to as the belt group. Figure 3 shows the distribution of labeled cells in the BF from 3 representative cases, in a series of rostro-caudal sections. To summarize, belt-projecting BF cells are located in an area of the BF similar to the location of A1-projecting BF cells. However, on average (n = 4), only 63.7% of retrogradely labeled cells were cholinergic; 36.3% were noncholinergic (Table 1). Again, similar to A1-projecting BF cells, belt-projecting BF cells were located 2.0–3.2 mm behind bregma. To explore layer-specific effects, the injection sites for each subject were compared. We found that 2 of the 4 injection sites in the belt areas included all cortical layers, while the other 2 included Layers I–IV. Despite the difference in injection site, again no statistical differences were detected in the proportion of cholinergic projection cells in either group (t = 0.89, df = 3, P = 0.44).
Figure 3.

Examples of retrograde injections in different labeling in the BF and auditory thalamus following tracer nonprimary auditory cortical areas: (A–C) Posterior dorsal auditory area (PDAF); (D–F) suprarhinal auditory field (SRAF); (G–I) anterior auditory area (AAF). Retrogradely labeled cholinergic (red) and noncholinergic neurons (black) in the BF were restricted to the caudal GP and SId. In the case of PDAF and SRAF, thalamic labeling was confined the dorsal division of the medial geniculate (MGD), whereas labeling in case of AAF was located primarily in the ventral division of the medial geniculate (MGV). However, all cases resulted in a similar proportion of cholinergic/noncholinergic cell labeling (Table 1). st, stria terminalis. Cortical injection sites are in orange.
Figure 4 displays the average distribution of all labeled cells in the A1 and belt cortical areas per mapped sections. In total, there were a significantly greater proportion of cholinergic cells projecting to A1 than to belt areas ( A1; belt; t = 3.9, df = 10, P = 0.003). There were also significantly greater proportions of noncholinergic cells projecting to belt areas than A1 (t = 3.9, df = 10, P = 0.003). However, there were no significant differences in the total number of FG-labeled cells projecting to A1 and belt (t = 0.62, df = 9, P = 0.62; , respectively), normalized to injection volume (107 µm3).
Figure 4.

(A) The average proportion of retrogradely labeled cholinergic and noncholinergic cells projecting to A1 mapped from series of sections 200 µm apart. (B) The average proportion of belt-projecting cholinergic and noncholinergic cells. On average, A1- and belt-projecting cells were contained in the area between 2.2 and 3.2 mm posterior to the crossing of the anterior commisure. However, there were significantly greater proportions of cholinergic cells projecting to A1 than to belt and a significantly greater proportion of noncholinergic cells projecting to belt than to A1 (see Results).
Monosynaptic Tracing
To more completely understand the BF-auditory cortical network, we used monosynaptic viral tracing techniques to identify the afferents to the auditory-projecting BF cholinergic cells. First, 1 rat with helper virus injection only was used for ChAT immunostaining to confirm co-localization of ChAT and mCherry viral labeling. We found that 100% of the mCherry cells were co-localized with ChAT immunostaining (Fig. 5). Additionally, the TVAmCherry expressing axons were imaged across the different auditory regions (Fig. 6). Double-labeled starter cells were contained within the same area of GP and SId as observed in the retrograde tracer experiment. Figure 7A–D is a series of selected rostro-caudal maps from a representative case (14016) of monosynaptic labeling of A1 projecting cholinergic cells in the BF. e-GFP afferents arose locally from within the GP, as well as from caudate-putamen and medial nucleus of the medial geniculate body (MGM), including the posterior intralaminar thalamic group, suprageniculate thalamic nucleus, and the posterior thalamic nuclear group (PIL, SG, PoT in the Paxinos–Watson atlas). In a fraction of cases, sparse cell labeling was also observed in the central amygdaloid nucleus (CeA; Table 2).
Figure 5.

Confocal images of ChAT immunostaining (A) and Cre-dependent mCherry viral labeling (B) showing that most of the mCherry-positive cells are double-labeled specifically for ChAT (yellow in C).
Figure 6.

Confocal images of mCherry-labeled axons/terminals in the ventral (AuV) and dorsal secondary auditory (AuD) areas flanking the primary (A1) auditory cortex. The auditory areas were identified using the appropriate figures of the Paxinos–Watson atlas.
Figure 7.

Rostral to caudal series from monosynaptic tracing from A1 (A–D) and belt (E–H). Red labels indicate double-labeled cortically projecting cholinergic cells (starter cells) while green labels indicate their afferents. The majority of afferents arise from the caudate-putamen (CP) and a small proportion arises from the MGM. However, afferents to the belt-projecting cholinergic neurons also arise from the cortex and central amygdaloid nucleus (CeA). fh, fimbria hippocampi; st, stria terminalis; cp, cerebral peduncle; S1BF, primary somatosensory cortex, barrel field; S1ULp, primary somatosensory cortex, upper lip; S2, secondary somatosensory cortex, GI, granular insular cortex; DI, dysgranular insular cortex; AIP, agranular insular, posterior part; AuD, secondary auditory area, dorsal part; Au1, primary auditory area; AuV, secondary auditory area, ventral part; Ect, ectorhinal cortex; PRh, perirhinal cortex; TeA, temporal association cortex; V2L, secondary visual cortex, lateral area; DLEnt, dorsal lateral entorhinal cortex; mcp, middle cerebellar peduncle; PAG, periaqueductal gray; scp, superior cerebellar peduncle.
Table 2.
Individual subject data of monosynaptically labeled afferents of cholinergic BF cells
| ID | Inj site | CP | GP | MGM | Cortex | CeA | Other | ChAT:e-GFP |
|---|---|---|---|---|---|---|---|---|
| 14016 | A1 | 418 | 20 | 17 | 1 | 9 | 6 | 23:471 |
| 14019 | A1 | 366 | 18 | 12 | 0 | 1 | 6 | 10:403 |
| 14038 | A1 | 205 | 9 | 11 | 0 | 1 | 1 | 13:227 |
| 14091 | A1 | 260 | 8 | 8 | 5 | 0 | 13 | 11:294 |
| 14057 | A1 | 170 | 4 | 0 | 0 | 7 | 0 | 9:181 |
| 14092 | PDAF | 740 | 56 | 22 | 66 | 50 | 38 | 19:975 |
| 14090 | AAF | 726 | 24 | 21 | 47 | 53 | 31 | 16:902 |
Note: Individual subject data of monosynaptically labeled afferent cells.
ID, subject ID number; Inj site, location of rabies virus injection; MGM, afferent cells within the medial division of the medial geniculate nucleus; CP, afferent cells within the caudate-putamen; CeA, afferent cells within the central amygdaloid nucleus; GP, afferent cells within the globus pallidus; Cortex, afferent cells within the cortex; Other, afferent cells in other brain regions; ChAT:e-GFP, ratio of cholinergic starter cells to the total number of afferent cells.
Figure 7E–L displays the location of belt-projecting BF cholinergic cells and their input cells in case 14092 (PDAF) in a series of selected rostro-caudal sections. Again, e-GFP-labeled afferents arose within the GP/SId area, C-P, and the MGM. However, unlike afferents to A1 projecting cholinergic cells, belt-projecting BF cholinergic cells received input from the cortex, including the ventral secondary auditory area, insular cortex, as well as from the secondary somatosensory area, CeA, and sparse labeling from various other regions including the inferior colliculus, superior colliculus, periaqueductal gray, mesopontine tegmentum, substantia nigra, bed nucleus of the stria terminalis, and lateral preoptic and hypothalamic areas (Table 2). Figure 8 shows e-GFP-labeled input cells in the caudate-putamen and single- and double-labeled cells within the GP, providing evidence for local afferents to A1-projecting cholinergic cells within the GP. Figure 9 displays the normalized afferent cell counts to the A1- and belt-projecting cholinergic neurons.
Figure 8.

A section processed for e-GFP DAB. (A) A low magnification of the section and the black box outlines the areas displayed in B–D. (B) mCherry-labeled cholinergic cells within the GP area. (C) e-GFP cells from the same area. Double-labeled cells (asterisk) within the GP are cholinergic cells projecting to A1, while cells labeled (arrows) with e-GFP alone are monosynaptically labeled afferents to these cholinergic cells. In B, there are mCherry cells that do not project to A1 and therefore are not colocalized with e-GFP, while in this field there are at least 2 cells (arrows) that are afferents to auditory-projecting cholinergic neurons. (D) Showing the same area as B,C after processed for DAB. Labels are the same as in B,C.
Figure 9.

Average cell counts of monosynaptically labeled afferents of A1 and belt projecting cholinergic starter cells of the BF. Afferent cell counts were first normalized to the number of double-labeled (ChAT/GFP) cholinergic cells (afferent count/total starter cells) and then averaged within each group. There are significantly more afferents in the CP, Cortex, and CeA, to the belt-projecting cholinergic neurons than that to A1-projecting cholinergic neurons. IPACL, interstitial nucleus of the posterior limb of the anterior commissure, lateral part.
Similar to our retrograde tracer findings, AAF rabies injection resulted in afferent labeling patterns more like PDAF than A1 (Table 2). For this reason, AAF is grouped with PDAF for statistical analyses. Overall, there was a significantly greater ratio of monosynaptically labeled afferents projecting to auditory belt areas innervating cholinergic cells than to A1 (53.9:1 afferents:starter cell belt; 25:1 afferents:starter cell, A1; t = 4.1, df = 5, P = 0.009). Additionally, there were significantly more afferent neurons to belt-projecting starter cells from the C-P (t = 3.0, df = 5, P = 0.029), Cortex (t = 15.5, df = 5, P = 0.00002), CeA (t = 9.0, df = 5, P = 0.0002), and other regions combined (t = 4.2, df = 5, P = 0.008) than afferents to A1-projecting starter neurons. There were no significant differences in the number of afferents arising from the GP (t = 2.3, df = 5, P = 0.06) or MGM (t = 1.6, df = 5, P = 0.166) to either A1 or belt starter cells.
Discussion
Although previous research has demonstrated a general topographic organization of the BF cholinergic system (Saper 1984, 1987), it had been generally accepted as a diffuse neuromodulatory system (Sarter and Bruno 1997). However, recent anatomical studies suggest that there is a large degree of specificity in the organization of the BF cholinergic system that could underlie the spatiotemporal precision in the action of ACh on cortical networks (Parikh et al. 2007; Munoz and Rudy 2014; Zaborszky et al. 2015; Gritton et al. 2016). Here we used a focused approach to uncover the specificity of the BF projection system in relation to the auditory cortex. Retrograde tracing from all auditory cortical areas resulted in labeling within the SId and GP with significantly more cholinergic cells projecting to A1 than to belt regions. Furthermore, we used monosynaptic viral tracing in the ChAT::Cre transgenic rat to trace the specific inputs to A1- and belt-projecting cholinergic cells (Fig. 9). Both A1- and belt-projecting cholinergic cells receive input from the caudate-putamen, globus pallidus, and the medial geniculate nucleus. However, belt-projecting cholinergic cells also received input from additional sources including the deep layers of the temporal cortex, central amygdala, and sparse input from various other areas, providing evidence for broader afferent influence in belt than in A1.
Retrograde Tracing from the Auditory Cortex: Comparing with Previous Findings in Different Species
It was previously reported that the auditory cortex receives most of its cholinergic input from the posterior lateral portions of the BF, in an area similar to the one we report here in our retrograde tracing findings (Rye et al. 1984; Saper 1984; Moriizumi and Hattori 1992a; Kamke et al. 2005; Bajo et al. 2014). However, additional projections from the diagonal band of Broca (Kamke et al. 2005, Cat; Bajo et al. 2014, Ferret) have also been reported. The lack of labeling in the diagonal band of Broca in the current experiment may reflect a species difference or may be due to our conservative approach in combining electrophysiological identification of auditory cortical regions and confirmation of tracer placement based upon the distribution of retrogradely labeled cells within the auditory thalamus.
Letzkus et al. (2011) reported that ACh release in the superficial layers of the auditory cortex resulted in the disinhibition of L2/3 pyramidal cells, increasing their responsiveness to tone-shock pairings during learning. Previous studies have also demonstrated that ACh release enhances the responsiveness of pyramidal cells in the auditory cortex via muscarinic receptors (for review, see Metherate 2011). Based on our data, we hypothesize that the effect of ACh release could be greater in the primary rather than in the secondary auditory cortex due to the greater number of retrogradely labeled cholinergic projections cells as well as the apparent denser innervation pattern in superficial layers of A1 (Fig. 6).
Our data also suggest a greater noncholinergic (putatively GABAergic) effect in secondary auditory cortex. While previous studies make clear that ACh release is critical for plasticity, the function of the noncholinergic projection remains unclear. Further research is needed to elucidate the noncholinergic BF contributions to the functions of auditory cortex.
Input to Cholinergic Cells
While the critical nature of ACh release in the auditory cortex for learning-induced plasticity has been known for quite some time, the network that supports this phenomenon has not been well understood. Using electron microscopy (EM), cholinergic cells in the ventral pallidum (VP) and SI were shown to receive catecholaminergic, accumbens, and amygdala input (Zaborszky et al. 1984, 1993; Zaborszky and Cullinan 1992, 1996; Gaykema and Zaborszky 1996). Furthermore, cholinergic cells in the GP were shown to receive sparse dorsal striatal input (Henderson 1997); however, none of the targets of the cholinergic neurons in these EM studies were disclosed, which is important due to the fact that cholinergic neurons from any region of the BF project to widespread cortical areas. No study has investigated inputs to cholinergic cells in the caudal GP/SId, a BF region that besides innervating the auditory cortex, also projects to the perirhinal and ventral visual association areas (Carey and Rieck 1987; Shi and Cassell 1997; Burwell and Amaral 1998; Kondo and Zaborszky 2016).
BF-Auditory Cholinergic Networks Implicated in Auditory Plasticity
Models hypothesizing the networks underlying learning-induced plasticity in A1 suggest that ACh release is achieved through BF activation via the amygdala (Weinberger et al. 1993; Suga and Ma 2003; Fig. 10). Despite previous findings that electrical stimulation of the basolateral amygdala paired with the presentation of a pure tone results in plasticity in A1 (Chavez et al. 2009, 2012, 2013), our data using monosynaptic viral tracing show no evidence for direct projections from the basolateral amygdala to cholinergic neurons that project to auditory cortical areas. Instead we observed sparse labeling in the CeA in only some of the cases of A1-projecting cholinergic cells, suggesting that a weak influence might arise from the CeA. However, a sizable input to belt-projecting cholinergic neurons seems to originate in CeA, likely providing inhibitory influence to the cholinergic cells. The lack of basolateral amygdala labeling may reflect the absence of a direct BLA-cholinergic-cortical circuitry or could be due to insufficient afferent viral labeling with the basolateral amygdala (see Technical issues with monosynaptic labeling below).
Figure 10.

(A) Summary of the hypothesized circuitry that supports ACh release in the auditory cortex underlying learning-induced plasticity. Both the Weinberger et al. (1993) and Suga models (Suga and Ma 2003) agree that the amygdala could serve as the critical input to the cholinergic basal forebrain that would result in ACh release in the auditory cortex. Additionally, Moriizumi and Hattori (1992b) found projections from the MGM to both cholinergic and noncholinergic cells in the GP region that projected to auditory cortex while Shammah-Lagnado et al. (1996) described projections from the GP to the MGM. Finally, McGeorge and Faull (1989) described the projection of the auditory cortex to the C-P. (B) Summary of the connections described in the current study. The majority of cholinergic and noncholinergic cells projecting to the A1 (orange) and belt (blue) auditory cortical areas are located in the GP/SId. Cholinergic cells are separated from the noncholinergic GP neurons for illustration purposes. Input cells to A1- or belt-projecting cholinergic cells are also labeled orange (A1) and blue (belt), respectively. Thickness of lines indicates the relative strength of the projections.
On the other hand, we found that the majority of the afferents to auditory cortically projecting cholinergic BF cells originates in the striatum. While auditory cortico-striatal projections have been known for many years (McGeorge and Faull 1989; Bordi and LeDoux 1992), they have primarily been thought of in terms of auditory motor function (Znamenskiy and Zador 2013; Xiong et al. 2015). Our study suggests that the striatum may heavily influence cholinergic cells within the BF that in turn interact with auditory cortical processing in general. Specifically, based on our data, it appears that the inhibitory striatal projection neurons may play a role in reducing the cholinergic tone of the auditory cortex.
Moriizumi and Hattori (1992b) described a projection from the medial geniculate body to the GP and speculated on the existence of a network between the MGM, GP, and auditory cortex as part of a larger network that may support some auditory motor functions. Here, we confirmed that this circuit does exist. Like the striatum, we have discovered that the MGM cells may play a more direct role in auditory cortical ACh release than was previously appreciated. While it has been known that the MGM is capable of learning-induced plasticity (Gabriel et al. 1975; Disterhoft and Stuart 1976; Ryugo and Weinberger 1978; Edeline 1990; Lennartz and Weinberger 1992; McEchron et al. 1995; O'Connor et al. 1997) and provides input to both amygdala and auditory cortex (LeDoux et al. 1985), its presumed role in ACh release was limited (Weinberger et al. 1993; Suga and Ma 2003). In contrast, our findings suggest that the MGM (including SG, PIL, POT) provides direct input to the cholinergic auditory-projecting cells and may directly contribute to learning-induced ACh release.
Technical Issues with the Monosynaptic Labeling
There is a disparity between the number of labeled cholinergic projection cells using the monosynaptic tracing method and the number labeled through classical retrograde tracing. This difference may be partially due to the smaller injection size that was used for the rabies virus compared with the size used for retrograde tracers. A smaller injection size was used to minimize the spread of the virus and may have resulted in fewer cells labeled than if we had used the same volume of injection as the retrograde tracer. Additionally, others have reported that monosynaptic viral labeling results in fewer labeled cells than traditional tracing methods. Although this is a common phenomenon that occurs using the monosynaptic tracing method, the cause of this disparity is still unknown (Ginger et al. 2013; Wall et al. 2013; Mori and Morimoto 2014). To allow for the greatest amount of expression under these conditions, we used a 7-day survival period following rabies virus infusion allowing a more complete transport and replication of the virus. Another issue that arises from using the monosynaptic viral tracing method is that rabies virus spread is incomplete in helper virus labeled cells; therefore, it is possible that the virus may incompletely label afferents (Callaway and Luo 2015). However, the differential input to A1 and belt shows that the virus is capable of uncovering significant differences between afferents to cholinergic neurons projecting to auditory-related cortical areas.
Concluding Remarks
Our findings provide new insight into the underlying anatomy that may explain the functional differences observed in how plasticity is expressed in A1 and belt cortex. Further studies may disclose layer (Bloem et al. 2014) and cell-specific action of ACh in the different auditory cortical areas. The anatomical findings of the current experiments provide targets for manipulation for future functional studies to test the specific roles of the MGM, striatal, and central amygdaloid afferents in cholinergic-dependent auditory perception, plasticity, learning, memory, and attention.
Supplementary Material
Supplementary material can be found at: http://www.cercor.oxfordjournals.org/.
Funding
This work was supported by NIH/NINDS Grant 23945 to L.Z.
Supplementary Material
Notes
Special thanks to Karl Deisseroth for providing the ChAT::Cre rats for breeding. Conflict of Interest: None declared.
References
- Bajo VM, Leach ND, Cordery PM, Nodal FR, King AJ. 2014. The cholinergic basal forebrain in the ferret and its inputs to the auditory cortex. Eur J Neurosci. 40(6):2922–2940. [DOI] [PMC free article] [PubMed] [Google Scholar]
- Bakin JS, Weinberger NM. 1990. Classical conditioning induces CS-specific receptive field plasticity in the auditory cortex of the guinea pig. Brain Res. 536(1–2):271–286. [DOI] [PubMed] [Google Scholar]
- Bakin JS, Weinberger NM. 1996. Induction of a physiological memory in the cerebral cortex by stimulation of the nucleus basalis. Proc Natl Acad Sci USA. 93(20):11219–11224. [DOI] [PMC free article] [PubMed] [Google Scholar]
- Bieszczad KM, Weinberger NM. 2010. Representational gain in cortical area underlies increase of memory strength. Proc Natl Acad Sci USA. 107(8):3793–3798. [DOI] [PMC free article] [PubMed] [Google Scholar]
- Bjordahl TS, Dimyan MA, Weinberger NM. 1998. Induction of long-term receptive field plasticity in the auditory cortex of the waking guinea pig by stimulation of the nucleus basalis. Behav Neurosci. 112(3):467–479. [DOI] [PubMed] [Google Scholar]
- Bloem B, Schoppink L, Rotaru DC, Faiz A, Hendriks P, Mansvelder HD, van de Berg WD, Wouterlood F. 2014. Topographic mapping between basal forebrain cholinergic neurons and the medial prefrontal cortex in mice. J Neurosci. 34(49):16234–16246. [DOI] [PMC free article] [PubMed] [Google Scholar]
- Bordi F, LeDoux J. 1992. Sensory tuning beyond the sensory system: an initial analysis of auditory response properties of neurons in the lateral amygdaloid nucleus and overlying areas of the striatum. J Neurosci. 12(7):2493–2503. [DOI] [PMC free article] [PubMed] [Google Scholar]
- Bourgeais L, Gauriau C, Bernard J-F. 2001. Projections from the nociceptive area of the central nucleus of the amygdala to the forebrain: a PHA-L study in the rat. Eur J Neurosci. 14:229–255. [DOI] [PubMed] [Google Scholar]
- Burwell RD, Amaral DG. 1998. Cortical afferents of the perirhinal, postrhinal, and entorhinal cortices of the rat. J Comp Neurol. 398:179–205. [DOI] [PubMed] [Google Scholar]
- Butt AE, Chavez CM, Flesher MM, Kinney-Hurd BL, Araujo GC, Miasnikov AA, Weinberger NM. 2009. Association learning-dependent increases in acetylcholine release in the rat auditory cortex during auditory classical conditioning. Neurobiol Learn Mem. 92(3):400–409. [DOI] [PubMed] [Google Scholar]
- Callaway EM, Luo L. 2015. Monosynaptic circuit tracing with glycoprotein-deleted rabies viruses. J Neurosci. 35(24):8979–8985. [DOI] [PMC free article] [PubMed] [Google Scholar]
- Carey RG, Rieck RW. 1987. Topographic projections to the visual cortex from the basal forebrain in the rat. Brain Res. 424(2):205–215. [DOI] [PubMed] [Google Scholar]
- Chavez CM, McGaugh JL, Weinberger NM. 2009. The basolateral amygdala modulates specific sensory memory representations in the cerebral cortex. Neurobiol Learn Mem. 91(4):382–392. [DOI] [PMC free article] [PubMed] [Google Scholar]
- Chavez CM, McGaugh JL, Weinberger NM. 2012. Amygdala strengthening of cortical memory representations, chap. 7. In: Ferry B, editor. The amygdala: a discrete multitasking manager. New York: InTech; p. 171–202. [Google Scholar]
- Chavez CM, McGaugh JL, Weinberger NM. 2013. Activation of the basolateral amygdala induces long-term enhancement of specific memory representations in the cerebral cortex. Neurobiol Learn Mem. 101:8–18. [DOI] [PMC free article] [PubMed] [Google Scholar]
- Diamond DM, Weinberger NM. 1984. Physiological plasticity of single neurons in auditory cortex of the cat during acquisition of the pupillary conditioned response: II. Secondary field (AII). Behav Neurosci. 98(2):189–210. [PubMed] [Google Scholar]
- Diamond DM, Weinberger NM. 1986. Classical conditioning rapidly induces specific changes in frequency receptive fields of single neurons in secondary and ventral ectosylvian auditory cortical fields. Brain Res. 372:357–360. [DOI] [PubMed] [Google Scholar]
- Disterhoft JF, Stuart DK. 1976. Trial sequence of changed unit activity in auditory system of alert rat during conditioned response acquisition and extinction. J Neurophysiol. 39(2):266–281. [DOI] [PubMed] [Google Scholar]
- Edeline JM. 1990. Frequency-specific plasticity of single unit discharges in the rat medial geniculate body. Brain Res. 529(1-2):109–119. [DOI] [PubMed] [Google Scholar]
- Gabriel M, Saltwick SE, Miller JD. 1975. Conditioning and reversal of short-latency multiple-unit responses in the rabbit medial geniculate nucleus. Science. 189(4208):1108–1109. [DOI] [PubMed] [Google Scholar]
- Gaykema RP, Zaborszky L. 1996. Direct catecholaminergic-cholinergic interactions in the basal forebrain. II. Substantia nigra-ventral tegmental area projections to cholinergic neurons. J Comp Neurol. 374(4):555–577. [DOI] [PubMed] [Google Scholar]
- Ginger M, Haberl M, Conzelmann KK, Schwarz MK, Frick A. 2013. Revealing the secrets of neuronal circuits with recombinant rabies virus technology. Front Neural Circuits. 7(2):1–15. [DOI] [PMC free article] [PubMed] [Google Scholar]
- Gritton HJ, Howe WM, Mallory CS, Hetrick VL, Berke JD, Sarter M. 2016. Cortical cholinergic signaling controls the detection of cues. Proc Natl Acad Sci USA. 113(8):E1089–E1097. [DOI] [PMC free article] [PubMed] [Google Scholar]
- Grove EA. 1988. Efferent connections of the substantia innominata in the rat. J Comp Neurol. 277:347–364. [DOI] [PubMed] [Google Scholar]
- Henderson Z. 1997. The projection from the striatum to the nucleus basalis in the rat: an electron microscopic study. Neuroscience. 78(4):943–955. [DOI] [PubMed] [Google Scholar]
- Kamke MR, Brown M, Irvine DR. 2005. Origin and immunolesioning of cholinergic basal forebrain innervation of cat primary auditory cortex. Hear Res. 206(1-2):89–106. [DOI] [PubMed] [Google Scholar]
- Kilgard MP, Merzenich MM. 1998. Cortical map reorganization enabled by nucleus basalis activity. Science. 279(5357):1714–1718. [DOI] [PubMed] [Google Scholar]
- Kisley MA, Gerstein GL. 2001. Daily variation and appetitive conditioning induced plasticity of auditory cortex receptive fields. Eur J Neurosci. 13(10):1993–2003. [DOI] [PubMed] [Google Scholar]
- Kondo H, Zaborszky L. 2016. Topographic organization of the basal forebrain projections to the perirhinal, postrhinal, and entorhinal cortex in rats. J Comp Neurol. 10.1002/cne.23967. [DOI] [PMC free article] [PubMed]
- Leach ND, Nodal FR, Cordery PM, King AJ, Bajo VM. 2013. Cortical cholinergic input is required for normal auditory perception and experience-dependent plasticity in adult ferrets. J Neurosci. 33(15):6659–6671. [DOI] [PMC free article] [PubMed] [Google Scholar]
- LeDoux JE, Ruggiero DA, Reis DJ. 1985. Projections to the subcortical forebrain from anatomically defined regions of the medial geniculate body in the rat. J Comp Neurol. 242:182–213. [DOI] [PubMed] [Google Scholar]
- Lee CC, Winer JA. 2008. Connections of cat auditory cortex: I. Thalamocortical system. J Comp Neurol. 507(6):1879–1900. [DOI] [PMC free article] [PubMed] [Google Scholar]
- Lennartz RC, Weinberger NM. 1992. Frequency-specific receptive field plasticity in the medial geniculate body induced by Pavlovian fear conditioning is expressed in the anesthetized brain. Behav Neurosci. 106(3):484–497. [DOI] [PubMed] [Google Scholar]
- Letzkus JJ, Wolff SB, Meyer EM, Tovote P, Courtin J, Herry C, Luthi A. 2011. A disinhibitory microcircuit for associative fear learning in the auditory cortex. Nature. 480:331–337. [DOI] [PubMed] [Google Scholar]
- McEchron MD, McCabe PM, Green EJ, Llabre MM, Schneiderman N. 1995. Simultaneous single unit recording in the medial nucleus of the medial geniculate nucleus and amygdaloid central nucleus throughout habituation, acquisition, and extinction of the rabbit's classically conditioned heart rate. Brain Res. 682(1-2):157–166. [DOI] [PubMed] [Google Scholar]
- McGeorge AJ, Faull RL. 1989. The organization of the projection from the cerebral cortex to the striatum in the rat. Neuroscience. 29(3):503–537. [DOI] [PubMed] [Google Scholar]
- Mesulam MM, Mufson EJ, Wainer BH, Levey AI. 1983. Central cholinergic pathways in the rat: an overview based on an alternative nomenclature (Ch1-Ch6). Neuroscience. 10(4):1185–1201. [DOI] [PubMed] [Google Scholar]
- Metherate R. 2011. Functional connectivity and cholinergic modulation in auditory cortex. Neurosci Biobehav Rev. 35:2058–2063. [DOI] [PMC free article] [PubMed] [Google Scholar]
- Mori T, Morimoto K. 2014. Rabies virus glycoprotein variants display different patterns in rabies monosynaptic tracing. Front Neuroanat. 7:47. [DOI] [PMC free article] [PubMed] [Google Scholar]
- Moriizumi T, Hattori T. 1992. a. Separate neuronal populations of the rat globus pallidus projecting to the subthalamic nucleus, auditory cortex and pedunculopontine tegmental area. Neuroscience. 46(3):701–710. [DOI] [PubMed] [Google Scholar]
- Moriizumi T, Hattori T. 1992. b. Ultrastructural morphology of projections from the medial geniculate nucleus and its adjacent region to the basal ganglia. Brain Res Bull. 29(2):193–198. [DOI] [PubMed] [Google Scholar]
- Munoz W, Rudy B. 2014. Spatiotemporal specificity in cholinergic control of neocortical function. Curr Opin Neurobiol. 26:149–160. [DOI] [PMC free article] [PubMed] [Google Scholar]
- O'Connor KN, Allison TL, Rosenfield ME, Moore JW. 1997. Neural activity in the medial geniculate nucleus during auditory trace conditioning. Exp Brain Res. 113(3):534–556. [DOI] [PubMed] [Google Scholar]
- Parikh V, Kozak R, Martinez V, Sarter M. 2007. Prefrontal acetylcholine release controls cue detection on multiple timescales. Neuron. 56(1):141–154. [DOI] [PMC free article] [PubMed] [Google Scholar]
- Paxinos G, Watson C. 2005. The rat brain in stereotaxic coordinates. 5th ed Burlington: (MA: ): Elsevier Academic Press. [Google Scholar]
- Polley DB, Read HL, Storace DA, Merzenich MM. 2007. Multiparametric auditory receptive field organization across five cortical fields in the albino rat. J Neurophysiol. 97(5):3621–3638. [DOI] [PubMed] [Google Scholar]
- Profant O, Burianova J, Syka J. 2013. The response properties of neurons in different fields of the auditory cortex in the rat. Hear Res. 296:51–59. [DOI] [PubMed] [Google Scholar]
- Puckett AC, Pandya PK, Moucha R, Dai W, Kilgard M. 2007. Plasticity in the rat posterior auditory field following nucleus basalis stimulation. J Neurophysiol. 98:253–265. [DOI] [PubMed] [Google Scholar]
- Rutkowski RG, Miasnikov AA, Weinberger NM. 2003. Characterization of multiple physiological fields within the anatomical core of rat auditory cortex. Hear Res. 181(1-2):116–130. [DOI] [PubMed] [Google Scholar]
- Rutkowski RG, Weinbeger NM. 2005. Encoding of learned importance of sound by magnitude of representational area in primary auditory cortex. Proc Natl Acad Sci USA. 102(38):13664–13669. [DOI] [PMC free article] [PubMed] [Google Scholar]
- Rye DB, Wainer BH, Mesulam MM, Mufson EJ, Saper CB. 1984. Cortical projections arising from the basal forebrain: a study of cholinergic and noncholinergic components employing combined retrograde tracing and immunohistochemical localization of choline acetyltransferase. Neuroscience. 13(3):627–643. [DOI] [PubMed] [Google Scholar]
- Ryugo DK, Weinberger NM. 1978. Differential plasticity of morphologically distinct neuron populations in the medical geniculate body of the cat during classical conditioning. Behav Biol. 22(3):275–301. [DOI] [PubMed] [Google Scholar]
- Saper CB. 1984. Organization of cerebral cortical afferent systems in the rat. II. Magnocellular basal nucleus. J Comp Neurol. 222:313–334. [DOI] [PubMed] [Google Scholar]
- Saper CB. 1987. Diffuse cortical projection systems: anatomical organization and role in cortical function. In: Mountcastle VB, Plum F, Geiger S, editors. Handbook of physiology: the nervous system Vol 5, Part 1. Bethesda: (MD: ): American Physiological Society; p. 169–210. [Google Scholar]
- Sarter M, Bruno J. 1997. Cognitive functions of cortical acetylcholine: toward a unifying hypothesis. Brain Res Rev. 23:28–46. [DOI] [PubMed] [Google Scholar]
- Shamma-Lagnado SJ, Alheid GF, Heimer L. 1996. Efferent connections of the caudal part of the globus pallidus in the rat. J Comp Neurol. 376:489–507. [DOI] [PubMed] [Google Scholar]
- Shi CJ, Cassell MD. 1997. Cortical, thalamic, and amygdaloid projections of rat temporal cortex. J Comp Neurol. 382(2):153–175. [PubMed] [Google Scholar]
- Suga N, Ma X. 2003. Multiparametric corticofugal modulation and plasticity in the auditory system. Nat Rev Neurosci. 4(10):783–794. [DOI] [PubMed] [Google Scholar]
- Wall NR, De La Parra M, Callaway EM, Kreitzer AC. 2013. Differential innervation of direct- and indirect-pathway striatal projection neurons. Neuron. 79(2):347–360. [DOI] [PMC free article] [PubMed] [Google Scholar]
- Watabe-Uchida M, Zhu L, Ogawa SK, Vamanrao A, Uchida N. 2012. Whole-brain mapping of direct inputs to midbrain dopamine neurons. Neuron. 74(5):858–873. [DOI] [PubMed] [Google Scholar]
- Weinberger NM. 2004. Specific long-term memory traces in primary auditory cortex. Nat Rev Neurosci. 5(4):279–290. [DOI] [PMC free article] [PubMed] [Google Scholar]
- Weinberger NM. 2007. Associative representational plasticity in the auditory cortex: a synthesis of two disciplines. Learn Mem. 14(1–2):1–16. [DOI] [PMC free article] [PubMed] [Google Scholar]
- Weinberger NM, Ashe JH, Metherate R, McKenna TM, Diamond DM, Bakin J. 1990. Retuning auditory cortex by learning: a preliminary model of receptive field plasticity. Concept Neurosci. 1(1):91–132. [Google Scholar]
- Weinberger NM, Javid R, Lepan B. 1993. Long-term retention of learning induced receptive-field plasticity in the auditory cortex. Proc Natl Acad Sci USA. 90(6):2394–2398. [DOI] [PMC free article] [PubMed] [Google Scholar]
- Wickersham IR, Finke S, Conzelmann KK, Callaway EM. 2007. Retrograde neuronal tracing with a deletion-mutant rabies virus. Nat Methods. 4(1):47–49. [DOI] [PMC free article] [PubMed] [Google Scholar]
- Witten IB, Steinberg EE, Lee SY, Davidson TJ, Zalocusky KA, Brodsky M, Yizhar O, Cho SL, Gong S, Ramakrishnan C et al. 2011. Recombinase-driver rat lines: tools, techniques, and optogenetic application to dopamine-mediated reinforcement. Neuron. 72(5):721–733. [DOI] [PMC free article] [PubMed] [Google Scholar]
- Xiong Q, Znamenskiy P, Zador AM. 2015. Selective corticostriatal plasticity during acquisition of an auditory discrimination task. Nature. 521:348–351. [DOI] [PMC free article] [PubMed] [Google Scholar]
- Zaborszky L, Csordas A, Mosca K, Kim J, Gielow MR, Vadasz C, Nadasdy Z. 2015. Neurons in the basal forebrain project to the cortex in a complex topographic organization that reflects corticocortical connectivity patterns: an experimental study based on retrograde tracing and 3D reconstruction. Cereb Cortex. 25(1):118–137. [DOI] [PMC free article] [PubMed] [Google Scholar]
- Zaborszky L, Cullinan WE. 1992. Projections from the nucleus accumbens to cholinergic neurons of the ventral pallidum: a correlated light and electron microscopic double-immunolabeling study in rat. Brain Res. 570(1-2):92–101. [DOI] [PubMed] [Google Scholar]
- Zaborszky L, Cullinan WE. 1996. Direct catecholaminergic-cholinergic interactions in the basal forebrain. I. Dopamine-beta-hydroxylase- and tyrosine hydroxylase input to cholinergic neurons. J Comp Neurol. 374(4):535–554. [DOI] [PubMed] [Google Scholar]
- Zaborszky L, Cullinan WE, Luine VN. 1993. Catecholaminergic-cholinergic interaction in the basal forebrain. Prog Brain Res. 98:31–49. [DOI] [PubMed] [Google Scholar]
- Zaborszky L, Leranth C, Heimer L. 1984. Ultrastructural evidence of amygdalofugal axons terminating on cholinergic cells of the rostral forebrain. Neurosci Lett. 52(3):219–225. [DOI] [PubMed] [Google Scholar]
- Znamenskiy P, Zador AM. 2013. Corticostriatal neurons in auditory cortex drive decisions during auditory discrimination. Nature. 497(7450):482–485. [DOI] [PMC free article] [PubMed] [Google Scholar]
Associated Data
This section collects any data citations, data availability statements, or supplementary materials included in this article.