Abstract
Objective
To compare the drowning mortality rates and proportion of deaths of each intent among all drowning deaths in Organisation for Economic Co-operation and Development (OECD) countries in 2012–2014.
Design
A population-based cross-sectional study.
Setting
32 OECD countries.
Participants
Individuals in OECD countries who died from drowning.
Main outcome measures
Drowning mortality rates (deaths per 100 000 population) and proportion (%) of deaths of each intent (ie, unintentional intent, intentional self-harm, assault, undetermined intent and all intents combined) among all drowning deaths.
Results
Countries with the highest drowning mortality rates (deaths per 100 000 population) were Estonia (3.53), Japan (3.49) and Greece (2.40) for unintentional intent; Ireland (0.96), Belgium (0.96) and Korea (0.89) for intentional self-harm; Austria (0.57), Korea (0.56) and Hungary (0.44) for undetermined intent and Japan (4.35), Estonia (3.70) and Korea (2.73) for all intents combined. Korea ranked 12th and 3rd for unintentional intent and all intents combined, respectively. By contrast, Belgium ranked 2nd and 15th for intentional self-harm and all intents combined, respectively. The proportion of deaths of each intent among all drowning deaths in each country varied greatly: from 26.2% in Belgium to 96.8% in Chile for unintentional intent; 0.7% in Mexico to 57.4% in Belgium for intentional self-harm; 0.0% in nine countries to 4.9% in Mexico for assault and 0.0% in Israel and Turkey to 38.3% in Austria for undetermined intent.
Conclusions
A large variation in the practice of classifying undetermined intent in drowning deaths across countries was noted and this variation hinders valid international comparisons of intent-specific (unintentional and intentional self-harm) drowning mortality rates.
Keywords: drowning, mortality, international comparisons
Strengths and limitations of this study.
This is the first study comparing drowning mortality rates according to intent-specific versus all intents combined, which can provide a more complete picture of drowning problems within a county.
We combined mortality data for 3 years to ensure the statistical stability of comparisons.
The criteria for classifying undetermined intent in each participating country were not available.
Introduction
An international comparison of injury mortality rates is crucial to identify the unique features of injury problems within a given country. An international comparison of unintentional drowning mortality rates indicated that drowning rate rankings of different countries differed according to age groups; the countries with the highest drowning rates were Kyrgyzstan for ages 0–4 years, Thailand for ages 5–14 years, Guyana for ages 15–24 years, Belarus for ages 25–44 years, Lithuania for ages 45–64 years and Japan for ages 65 years or more.1 However, several studies have indicated country and regional variations in the determination of intent (manner of death), such as unintentional (accidents), intentional self-harm (suicides), assault (homicides) and events of undetermined intent, which could hinder valid international comparisons of injury mortality rates.2–6
To improve the comparability between countries and across years within a single country, some scholars have proposed considering all intents combined versus intent-specific injury deaths to reveal a more comprehensive picture of the injury problem.7–10 Theory and evidence supporting the all-intents-combined approach indicate that passive protection strategies through modification of products (eg, smart guns or adding unpleasant odours and colours to pesticides), environmental interventions (eg, fences on the roofs of high buildings and securing used pesticides) and lethal means restriction (eg, gun control and banning the use of lethal pesticides) are highly effective in preventing unintentional injuries and intentional injuries.11–15 The all-intents-combined approach has been used for the early identification of emerging drug-related poisoning problems in the USA and drowning problems in Finland.16–21 However, no study thus far has used the all-intents-combined approach to examine international variations in drowning mortality. In this study, we compared the drowning mortality rates and proportion of deaths of each intent among all drowning deaths within Organisation for Economic Co-operation and Development (OECD) countries.
Methods
Study design and setting
This study was a population-based descriptive cross-sectional study of 32 OECD countries.
Data source
The population and drowning mortality data of 32 OECD countries were extracted from the WHO Cause of Death Query Online.22 To ensure statistical stability in calculating the drowning mortality rates, we combined available data from the most recently available 3 years. Both numerator (drowning deaths) and denominator (population size) were combined for each 3-year period. The latest available year of mortality data differed across countries. For example, as of 30 April 2017, the latest 3 years of data were 2013–2015 for 5 countries and 2012–2014 for 16 countries.
Measures
The International Classification of Diseases Tenth Revision (ICD-10) codes for drowning mortality of different intents are ICD-10 codes W65–W74 for unintentional intent (accident), ICD-10 code X71 for intentional self-harm (suicide), ICD-10 code X92 for assault (homicide) and ICD-10 code Y21 for undetermined intent.
Statistical analyses
We first calculated the age-standardised mortality rates (deaths per 100 000 population) of each intent for each country using the US 2000 age structure (0–14, 25–24, 25–44, 45–64, 65–74 and greater than or equal to 75 years) as standard. We used bar charts to represent the variations and rankings in drowning mortality rates by intent across countries.
We then computed the proportion of deaths of each intent among all drowning deaths for each country grouped by region. The classification of country by region was based on the Global Burden of Disease Study.23 To demonstrate the extent of variations in death certification practices, we calculated an undetermined intent versus intentional self-harm ratio and an all intents combined versus unintentional intent ratio for each country. The proportion of each intent for each country was illustrated by stacked bar charts.
Patient and public involvement
This study used secondary administrative data. As such, no patients were involved in the development of the research questions. Outcome measures were informed by patients’ priorities, experience and preferences. These conditions applied to the design of this study, in the recruitment for the study and in the conduct of the study.
Results
Intent-specific mortality rates
Countries with the highest drowning mortality rates (deaths per 100 000 population) were Estonia (3.53), Japan (3.49) and Greece (2.40) for accidental (figure 1); Ireland (0.96), Belgium (0.96) and Korea (0.89) for intentional self-harm (figure 2); Austria (0.57), Korea (0.56) and Hungary (0.44) for undetermined intent (figure 3) and Japan (4.35), Estonia (3.70) and South Korea (2.73) for all intents combined (figure 4). South Korea ranked 12th and 3rd for unintentional intent and all intents combined, respectively. By contrast, Belgium ranked 2nd and 15th for intentional self-harm and all intents combined, respectively.
Figure 1.
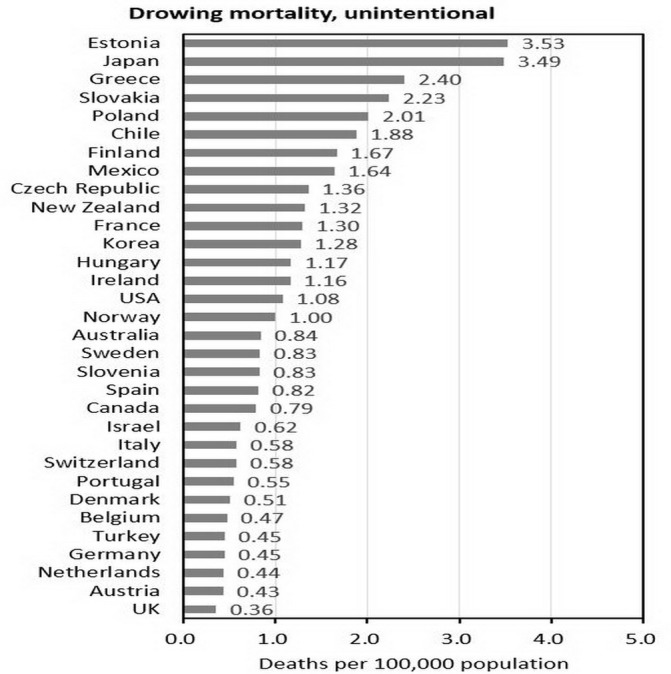
Unintentional (accident) drowning mortality in each OECD country. OECD, Organisation for Economic Co-operation and Development.
Figure 2.
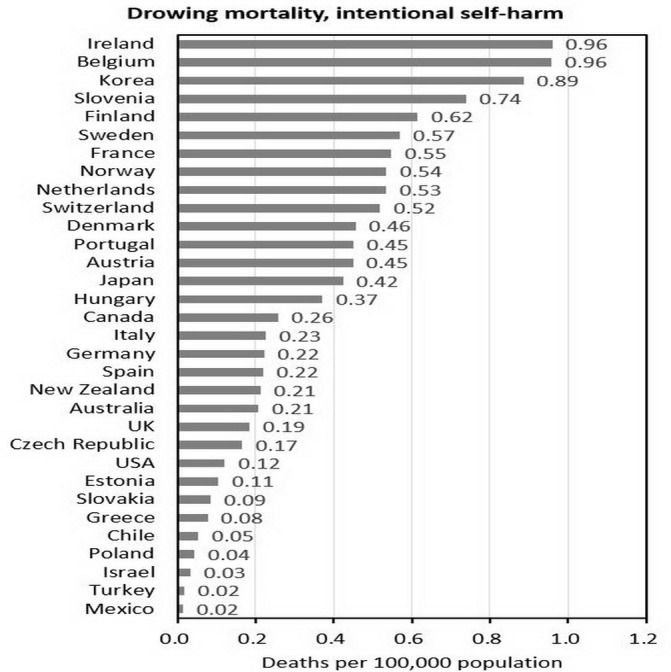
Intentional self-harm (suicide) drowning mortality in each OECD country. OECD, Organisation for Economic Co-operation and Development.
Figure 3.
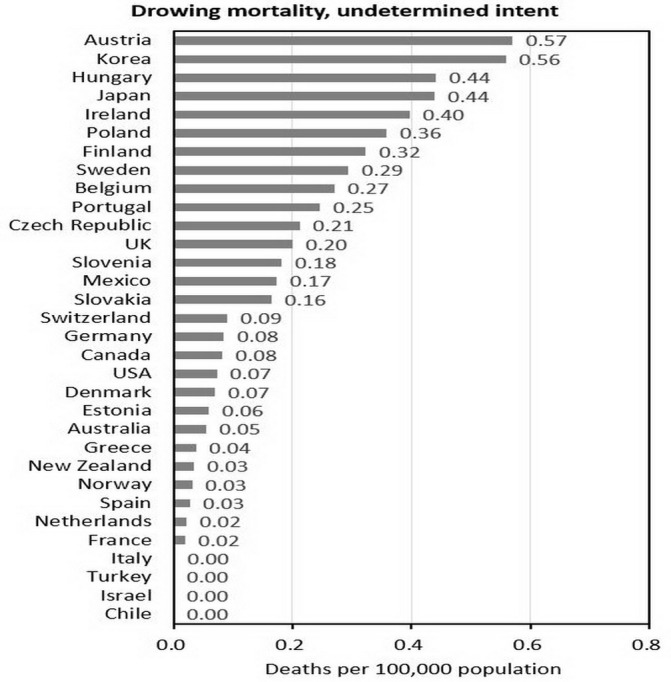
Undetermined intent drowning mortality in each OECD country. OECD, Organisation for Economic Co-operation and Development.
Figure 4.
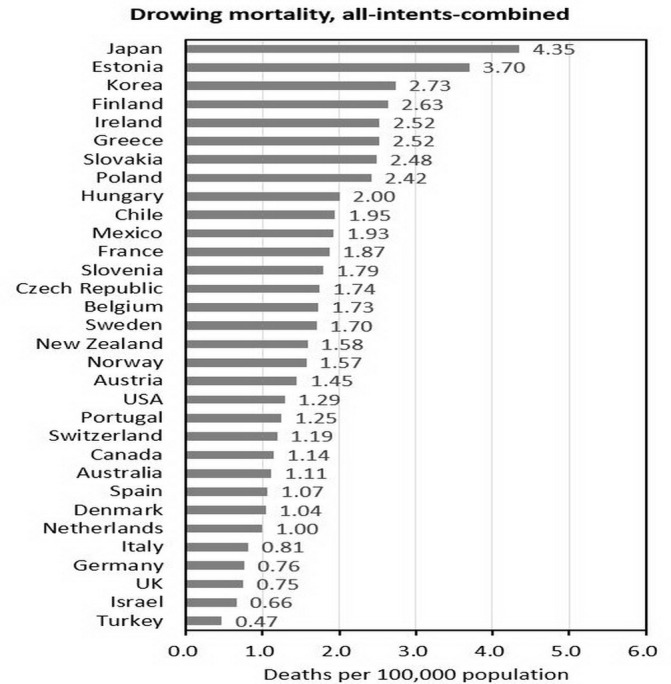
All intents combined drowning mortality in each OECD country. OECD, Organisation for Economic Co-operation and Development.
Proportion of drowning deaths by intent
The numbers and proportions of each intent among drowning deaths for each country by region are presented in table 1 and figure 5. The percentage of unintentional intent ranged from 26.2% in Belgium to 96.8% in Chile. The proportion of intentional self-harm ranged from 0.7% in Mexico to 57.4% in Belgium, indicating a considerably large variation. The percentage of assault was less than 1.0% in most countries, except in Mexico (4.9%) and Slovenia (1.5%). We also found a large variation in undetermined intent, from 0.0% in Israel and Turkey to 38.3% in Austria.
Table 1.
The number and proportion of each intent in drowning mortality in each OECD country
| Region | (1) All-intents- combined | (2) Unintentional | (3) Intentional self-harm | (4) Assault | (5) Undetermined intent | (5)/(3) | (1)/(2) | |||||
| Country, data year | No. | % | No. | % | No. | % | No. | % | No. | % | ||
| High-income North America | ||||||||||||
| Canada, 2010–2012 | 1241 | 100.0 | 840 | 67.7 | 301 | 24.3 | 9 | 0.7 | 91 | 7.3 | 0.30 | 1.48 |
| USA, 2012–2014 | 12 348 | 100.0 | 10 340 | 83.7 | 1200 | 9.7 | 109 | 0.9 | 699 | 5.7 | 0.58 | 1.19 |
| Australasia | ||||||||||||
| Australia, 2012–2014 | 793 | 100.0 | 591 | 74.5 | 156 | 19.7 | 5 | 0.6 | 41 | 5.2 | 0.26 | 1.34 |
| New Zealand, 2010–2012 | 211 | 100.0 | 175 | 82.9 | 29 | 13.7 | 2 | 0.9 | 5 | 2.4 | 0.17 | 1.21 |
| High-income Asia Pacific | ||||||||||||
| Japan, 2012–2014 | 27 383 | 100.0 | 22 940 | 83.8 | 2166 | 7.9 | 10 | 0.0 | 2267 | 8.3 | 1.05 | 1.19 |
| South Korea, 2011–2013 | 4337 | 100.0 | 1980 | 45.7 | 1441 | 33.2 | 14 | 0.3 | 902 | 20.8 | 0.63 | 2.19 |
| Western Europe | ||||||||||||
| Austria, 2012–2014 | 446 | 100.0 | 129 | 28.9 | 146 | 32.7 | 0 | 0.0 | 171 | 38.3 | 1.17 | 3.46 |
| Belgium, 2012–2014 | 687 | 100.0 | 180 | 26.2 | 394 | 57.4 | 7 | 1.0 | 106 | 15.4 | 0.27 | 3.82 |
| Denmark, 2012–2014 | 205 | 100.0 | 97 | 47.3 | 94 | 45.9 | 1 | 0.5 | 13 | 6.3 | 0.14 | 2.11 |
| Finland, 2012–2014 | 510 | 100.0 | 332 | 65.1 | 117 | 22.9 | 3 | 0.6 | 58 | 11.4 | 0.50 | 1.54 |
| France, 2011–2013 | 4147 | 100.0 | 2818 | 68.0 | 1277 | 30.8 | 11 | 0.3 | 41 | 1.0 | 0.03 | 1.47 |
| Germany, 2012–2014 | 2295 | 100.0 | 1271 | 55.4 | 752 | 32.8 | 6 | 0.3 | 266 | 11.6 | 0.35 | 1.81 |
| Greece, 2014 | 363 | 100.0 | 349 | 96.1 | 10 | 2.8 | 0 | 0.0 | 4 | 1.1 | 0.40 | 1.04 |
| Ireland, 2011–2013 | 348 | 100.0 | 159 | 45.7 | 133 | 38.2 | 1 | 0.3 | 55 | 15.8 | 0.41 | 2.19 |
| Israel, 2012–2014 | 155 | 100.0 | 148 | 95.5 | 7 | 4.5 | 0 | 0.0 | 0 | 0.0 | 0.00 | 1.05 |
| Italy, 2010–2012 | 1668 | 100.0 | 1124 | 67.4 | 534 | 32.0 | 8 | 0.5 | 2 | 0.1 | 0.00 | 1.48 |
| Netherlands, 2013–2015 | 585 | 100.0 | 244 | 41.7 | 327 | 55.9 | 2 | 0.3 | 12 | 2.1 | 0.04 | 2.40 |
| Norway, 2012–2014 | 265 | 100.0 | 171 | 64.5 | 89 | 33.6 | 0 | 0.0 | 5 | 1.9 | 0.06 | 1.55 |
| Portugal, 2011–2013 | 472 | 100.0 | 190 | 40.3 | 191 | 40.5 | 1 | 0.2 | 90 | 19.1 | 0.47 | 2.48 |
| Spain, 2012–2014 | 1730 | 100.0 | 1294 | 74.8 | 385 | 22.3 | 4 | 0.2 | 47 | 2.7 | 0.12 | 1.34 |
| Sweden, 2013–2015 | 594 | 100.0 | 287 | 48.3 | 207 | 34.8 | 1 | 0.2 | 99 | 16.7 | 0.48 | 2.07 |
| Switzerland, 2011–2013 | 337 | 100.0 | 154 | 45.7 | 157 | 46.6 | 0 | 0.0 | 26 | 7.7 | 0.17 | 2.19 |
| UK, 2011–2013 | 1529 | 100.0 | 714 | 46.7 | 398 | 26.0 | 2 | 0.1 | 415 | 27.1 | 1.04 | 2.14 |
| Eastern Europe | ||||||||||||
| Estonia, 2012–2014 | 161 | 100.0 | 153 | 95.0 | 5 | 3.1 | 0 | 0.0 | 3 | 1.9 | 0.60 | 1.05 |
| Central Europe | ||||||||||||
| Czech Republic, 2013–2015 | 627 | 100.0 | 484 | 77.2 | 63 | 10.0 | 2 | 0.3 | 78 | 12.4 | 1.24 | 1.30 |
| Hungary, 2013–2015 | 651 | 100.0 | 372 | 57.1 | 127 | 19.5 | 3 | 0.5 | 149 | 22.9 | 1.17 | 1.75 |
| Poland, 2012–2014 | 3005 | 100.0 | 2502 | 83.3 | 59 | 2.0 | 0 | 0.0 | 444 | 14.8 | 7.53 | 1.20 |
| Slovakia, 2012–2014 | 434 | 100.0 | 389 | 89.6 | 16 | 3.7 | 0 | 0.0 | 29 | 6.7 | 1.81 | 1.12 |
| Slovenia, 2013–2015 | 136 | 100.0 | 61 | 44.9 | 59 | 43.4 | 2 | 1.5 | 14 | 10.3 | 0.24 | 2.23 |
| Latin America | ||||||||||||
| Chile, 2012–2014 | 1022 | 100.0 | 989 | 96.8 | 28 | 2.7 | 5 | 0.5 | 0 | 0.0 | 0.00 | 1.03 |
| Mexico, 2012–2014 | 6970 | 100.0 | 5990 | 85.9 | 48 | 0.7 | 339 | 4.9 | 593 | 8.5 | 12.35 | 1.16 |
| Middle East | ||||||||||||
| Turkey, 2011–2013 | 1061 | 100.0 | 1018 | 95.9 | 41 | 3.9 | 2 | 0.2 | 0 | 0.0 | 0.00 | 1.04 |
Data source: WHO Cause of Death Query Online (http://apps.who.int/healthinfo/statistics/mortality/causeofdeath_query/).
OECD, Organisation for Economic Co-operation and Development.
Figure 5.
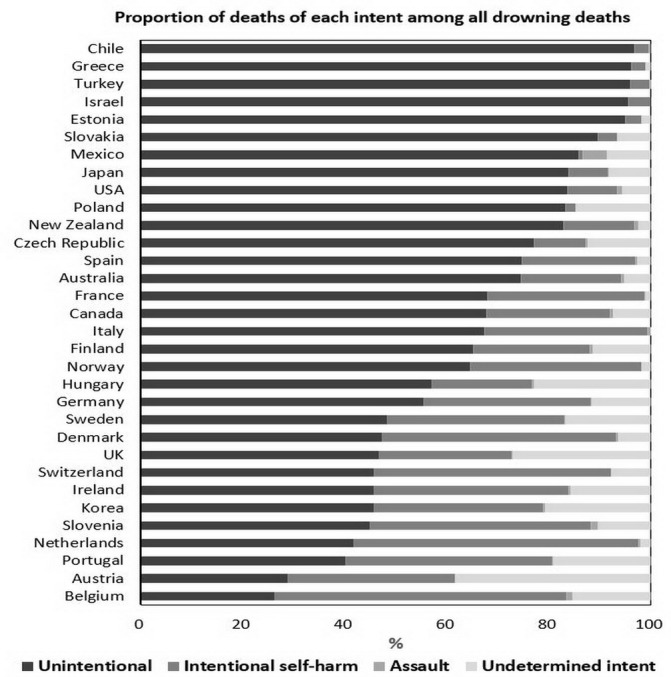
Proportion of deaths of each intent among all drowning deaths in each OECD country. OECD, Organisation for Economic Co-operation and Development.
Of the 32 OECD countries included in the study, 10 had undetermined intent proportions lower than 3% and 8 had proportions greater than 15%. The undetermined intent versus intentional self-harm ratio (an indicator of under-reported suicide) was highest in Mexico (12.35, 593/48) and Poland (7.53, 444/59). Four out of five Central European countries had undetermined intent versus intentional self-harm ratios larger than 1, suggesting relatively a high proportion of reported undetermined intent in Central European countries. By contrast, the all intents combined versus unintentional intent ratio was highest in Belgium (3.82, 687/180) and Austria (3.46, 446/129). Of 11 countries with all intents combined versus unintentional intent ratios larger than 2, 8 were Western European countries.
Discussion
The findings of this study indicate different rankings of drowning mortality rates by intent, which might have been caused by large variations in the proportions of reported undetermined intent and intentional self-harm among all drowning deaths across countries. This study suggests variability in the drowning-related death certification practices associated with specific regions. For example, countries in Central Europe had higher proportions of reporting undetermined intent and countries in Western Europe had higher proportions of reporting intentional self-harm.
According to a previous study involving the certification practices of eight European countries, a legal inquiry is compulsory for every injury death in each participating country, and the inquiry is most commonly executed by legal authorities. However, differences in the classification practices (eg, the efficiency of communication between the medical and legal authorities involved in suicide registration, percentage of injury deaths where forensic autopsies are performed, level of medical training of the coders and availability of inquiry results and forensic autopsy results to the final cause-of-death decision-maker) in different countries result in variations in the proportion of deaths classified as undetermined intent. In that study, the undetermined intent versus suicide ratio was highest in Portugal during 2000–2004 (0.78) and lowest in Austria during 2003–2007 (0.07).2
In this study, we found eight countries (Japan, Austria, UK, Czech Republic, Hungary, Poland, Slovakia and Mexico) with an undetermined intent versus suicide ratio greater than 1. Four out of five countries in Central Europe had undetermined intent versus suicide ratios greater than 1, which indicated similar certification practices among medical examiners and coroners in this region. We also found that 8 out of the 11 countries with high all intents combined versus unintentional intent ratios were in Western Europe. One possible explanation for this was the high proportion in intentional self-harm drowning deaths in this region.
Regarding the determination of intent (manner of death) in drowning deaths, ‘unintentional intent’ could be the assigned intent when witnesses were present during the drowning incident (eg, children swimming or young people surfing in recreational water environments). By contrast, the intent ‘intentional self-harm’ could be assigned if witnesses were present when someone intentionally and voluntarily jumped off a bridge into a river. However, determining the intent of drowning for a body found in water is difficult. According to a study conducted by Lunetta et al, of 1707 bodies that were found in water and were autopsied at the Department of Forensic Medicine, University of Helsinki, from 1976 to 2000, 276 cases (16.2%) were assigned undetermined intent. Of 757 cases initially thought to be accidents by police investigators, pathologists involved with the autopsies agreed in 79.4% of the cases, whereas for suicide, homicide and undetermined intent, the pathologists agreed in only 76.9%, 39.5% and 18.7% of the cases, respectively.24
Because determining the intent of injury is difficult and because accumulated evidence suggests that environmental interventions could prevent unintentional injuries and intentional injuries, counting injury deaths by using the all-intents-combined approach to identify all injury deaths with the same mechanism is recommended.7–10 For example, in the USA, poisoning (n=31 116) was the second leading injury mechanism followed by motor vehicular accidents (n=37 985) in 2008 when the count was restricted to only unintentional intent. However, when the all-intents-combined approach was used, poisoning (n=41 080) became the first leading injury mechanism and superseded motor vehicular accidents (n=37 985) in 2008.20 According to the findings of this study (table 1), 12 348 drowning deaths were identified using the all-intents-combined approach, which suggests that the use of this approach could identify 20% more drowning deaths (n=2108) than did the use of only the unintentional intent approach (n=10 240).
Strengths and limitations of this study
The strength of this study is that it is the first to compare both intent-specific and all-intents-combined drowning mortality across countries. However, several limitations should be considered while interpreting the findings of this study. First, we did not include water transport accidents (ICD-10 codes V90–V94) in this study because of the small number of deaths resulting from these accidents in most countries. Second, unlike reports of unintentional drowning (ICD-10 codes W65–W74), which provide detailed information on the body of water (ie, bathtub, swimming pool or natural water body) and the mechanism of drowning (ie, while in water vs following fall into water), reports of intentional self-harm (ICD-10 code X71), assault (ICD-10 code X92) and undetermined intent (ICD-10 code Y21) provide no such information. Therefore, we could not further analyse the bodies of water and mechanisms of drowning involved in intentional drowning. Third, we could not determine whether the considerably large variations in intentional self-harm drowning mortality rates across countries were caused by actual differences in suicide rates or by differences in classifying undetermined intent.
Conclusion
The rankings of a country with regard to drowning mortality rates differ depending on whether the all-intents-combined approach or the intent-specific approach is used. The findings of this study indicate a large variation in the practice of classifying the undetermined intent of drowning deaths across countries; this variation hinders valid international comparisons of intent-specific (unintentional and intentional self-harm) drowning mortality rates.
Supplementary Material
Acknowledgments
The authors thank Ms Pai-Huan Lin for data analysis.
Footnotes
Contributors: W-HH collected data, performed analysis and drafted and revised the manuscript. C-HW participated the interpretation of results and drafted and revised the manuscript. T-HL initiated the idea, participated in the interpretation of results, drafted and revised the manuscript, supervised the study and is the guarantor.
Funding: The authors have not declared a specific grant for this research from any funding agency in the public, commercial or not-for-profit sectors.
Competing interests: None declared.
Patient consent: Not required.
Ethics approval: This study was approved by the Institutional Review Boards of the Chi-Mei Medical Center (10406-003) and the Tzu Chi Hospital (104-67-B).
Provenance and peer review: Not commissioned; externally peer reviewed.
Data sharing statement: Extra data can be accessed via the Dryad data repository at http://datadryad.org/ with the doi: 10.5061/dryad.k5d0rp0.
References
- 1. Lin CY, Wang YF, Lu TH, et al. Unintentional drowning mortality, by age and body of water: an analysis of 60 countries. Inj Prev 2015;21:e43–e50. 10.1136/injuryprev-2013-041110 [DOI] [PMC free article] [PubMed] [Google Scholar]
- 2. Värnik P, Sisask M, Värnik A, et al. Suicide registration in eight European countries: a qualitative analysis of procedures and practices. Forensic Sci Int 2010;202:86–92. 10.1016/j.forsciint.2010.04.032 [DOI] [PubMed] [Google Scholar]
- 3. Rockett IRH, Kapusta ND, Bhandari R. Suicide misclassification in an international context: revisitation and update. Suicidology 2011;2:48–61. [Google Scholar]
- 4. Pritchard C, Hansen L. Examining undetermined and accidental deaths as source of ‘under-reported-suicide’ by age and sex in twenty Western countries. Community Ment Health J 2015;51:365–76. 10.1007/s10597-014-9810-z [DOI] [PubMed] [Google Scholar]
- 5. Lu TH, Sun SM, Huang SM, et al. Mind your manners: quality of manner of death certification among medical examiners and coroners in Taiwan. Am J Forensic Med Pathol 2006;27:352–4. 10.1097/01.paf.0000233555.31211.78 [DOI] [PubMed] [Google Scholar]
- 6. Breiding MJ, Wiersema B. Variability of undetermined manner of death classification in the US. Inj Prev 2006;12 Suppl 2(Suppl II):ii49–ii54. 10.1136/ip.2006.012591 [DOI] [PMC free article] [PubMed] [Google Scholar]
- 7. McLoughlin E, Annest JL, Fingerhut L, et al. Recommended framework for presenting injury mortality data. MMWR Recomm Rep 1997;46:1–30. [PubMed] [Google Scholar]
- 8. Fingerhut LA, McLoughlin E. Classifying and counting injury : Rivara FP, Cummings P, Koipsell TD, Injury control: a guide to research and program evaluation. Cambridge: Cambridge University Press, 2001:15–31. [Google Scholar]
- 9. Minino AM, Anderson RN, Fingerhut LA, et al. Deaths: Injuries, 2002. National vital statistics reports; Vol 54 No 10. Hyattsville, MD: National Center for Health Statistics, 2006. [PubMed] [Google Scholar]
- 10. Warner M, Chen LH. Surveillance of injury mortality : Li G, Baker SP, Injury research: theories, methods, and approaches. New York: Springer, 2012:3–21. [Google Scholar]
- 11. Peek-Asa C, Zwerling C. Role of environmental interventions in injury control and prevention. Epidemiol Rev 2003;25:77–89. 10.1093/epirev/mxg006 [DOI] [PubMed] [Google Scholar]
- 12. Prüss-Ustün A, Corvalán C. How much disease burden can be prevented by environmental interventions? Epidemiology 2007;18:167–78. 10.1097/01.ede.0000239647.26389.80 [DOI] [PubMed] [Google Scholar]
- 13. Pollack KM, Kercher C, Frattaroli S, et al. Toward environments and policies that promote injury-free active living--it wouldn’t hurt. Health Place 2012;18:106–14. 10.1016/j.healthplace.2011.07.010 [DOI] [PubMed] [Google Scholar]
- 14. Florentine JB, Crane C. Suicide prevention by limiting access to methods: a review of theory and practice. Soc Sci Med 2010;70:1626–32. 10.1016/j.socscimed.2010.01.029 [DOI] [PubMed] [Google Scholar]
- 15. Yip PS, Caine E, Yousuf S, et al. Means restriction for suicide prevention. Lancet 2012;379:2393–9. 10.1016/S0140-6736(12)60521-2 [DOI] [PMC free article] [PubMed] [Google Scholar]
- 16. Paulozzi LJ, Annest JL. US data show sharply rising drug-induced death rates. Inj Prev 2007;13:130–2. 10.1136/ip.2006.014357 [DOI] [PMC free article] [PubMed] [Google Scholar]
- 17. Paulozzi LJ, Jones C, Mack K, et al. Vital signs: overdoses of prescription opioid pain relievers---United States, 1999--2008. MMWR Morb Mortal Wkly Rep 2011;60:1487–92. [PubMed] [Google Scholar]
- 18. Mack K. Drug-induced deaths—United States, 1999-2010. Morb Mortal Wkly Rep;2013:161–3. [PubMed] [Google Scholar]
- 19. Jones CM, Mack KA, Paulozzi LJ. Pharmaceutical overdose deaths, United States, 2010. JAMA 2013;309:657–9. 10.1001/jama.2013.272 [DOI] [PubMed] [Google Scholar]
- 20. Bastian B, Lu L, Miniño A, et al. Injury mortality, United States: 1999–2014. National Center for Health Statistics, National Vital Statistics System. 2016. https://blogs.cdc.gov/nchs-data-visualization/injury-mortality-united-states-1999-2014/ (accessed 20 May 2017).
- 21. Lunetta P, Smith GS, Penttilä A, et al. Unintentional drowning in Finland 1970-2000: a population-based study. Int J Epidemiol 2004;33:1053–63. 10.1093/ije/dyh194 [DOI] [PubMed] [Google Scholar]
- 22. World Health Organization. Cause of death query online: a web-based system for extracting trend series detailed cause-of-death data. 2017. http://apps.who.int/healthinfo/statistics/mortality/causeofdeath_query/
- 23. GBD 2016 Causes of Death Collaborators. Global, regional, and national age-sex specific mortality for 264 causes of death, 1980-2016: a systematic analysis for the Global Burden of Disease Study 2016. Lancet 2017;390:1151–210. 10.1016/S0140-6736(17)32152-9 [DOI] [PMC free article] [PubMed] [Google Scholar]
- 24. Lunetta P, Smith GS, Penttila A, et al. Undetermined drowning. Med Sci Law 2003;43:207–14. 10.1258/rsmmsl.43.3.207 [DOI] [PubMed] [Google Scholar]
Associated Data
This section collects any data citations, data availability statements, or supplementary materials included in this article.


