Abstract
G protein-coupled receptors (GPCRs) are involved in many physiological processes and are therefore key drug targets 1. Despite detailed structural information however the effects of lipids on the receptors themselves, or on their downstream coupling to G proteins, are ill defined. Here we use native mass spectrometry to identify endogenous lipids bound to three class A GPCRs. We demonstrate preferential binding of phosphatidylinositol 4,5 bisphosphate (PIP2) over related lipids and confirm hotspots for PIP2 binding on the intracellular face of the receptors. Endogenous lipids were also observed bound directly to the entire adenosine A2A receptor (A2AR) trimeric Gαsβγ protein complex in the gas phase. Recruiting engineered Gα subunits (mini-Gs, i, 12) 2 we found that the β1AR: mini-Gαs complex is stabilised by the binding of two PIP2 molecules. By contrast PIP2 did not stabilise coupling between β1AR and other Gα subunits (mini- Gαi, 12) or a high affinity nanobody. Other endogenous lipids that bound to receptors showed no effect on coupling, highlighting the specificity of PIP2. Potential of mean force calculations and increased GTP turnover of the activated neurotensin receptor: trimeric Gαiβγ complex in the presence of PIP2 further support the specific effect of PIP2 on coupling. Together our results identify key residues on cognate Gα subunits that mediate simultaneous PIP2 bridging interactions between basic residues on class A receptors, which do not correspond with those on class B GPCRs. By uncovering the effects of lipid modulation of receptors we highlight consequences for understanding function, G protein selectivity and drug targeting of class A GPCRs.
The emerging view from biophysical studies of GPCRs is that they exist as ensembles of discrete conformations that can be influenced by ligands, regulatory proteins, pH and ions as well as potentially lipid molecules 3. The role of these conformational ensembles in signaling pathways are further compounded by the combinatorial effects of the multiple distinct heterotrimeric complexes formed from 21 Gα, 6 Gβ and 12 Gγ subunits. Investigating the relationship between GPCRs, small molecule modulators and numerous binding partners is challenging therefore, due to the difficulties of observing the complexity of these interactions directly. A previous study characterized lipid interactions with β2AR in high-density lipoparticles 4 to which phospholipids were added exogenously. However, the selectivity and the effects of different phosphatidylinositol phosphate (PIP) lipids on downstream coupling were not explored. Here we develop and apply high-resolution native MS to interrogate endogenous lipid - receptor interactions5,6 for three class A GPCRs (the β1-adrenergic receptor (β1AR), the adenosine A2A receptor (A2AR) and the neurotensin receptor 1 (NTSR1)). We discover novel effects of PIP2 that stabilise these receptors in active states, increase GTPase activity and enhance selectivity of coupling to G-proteins.
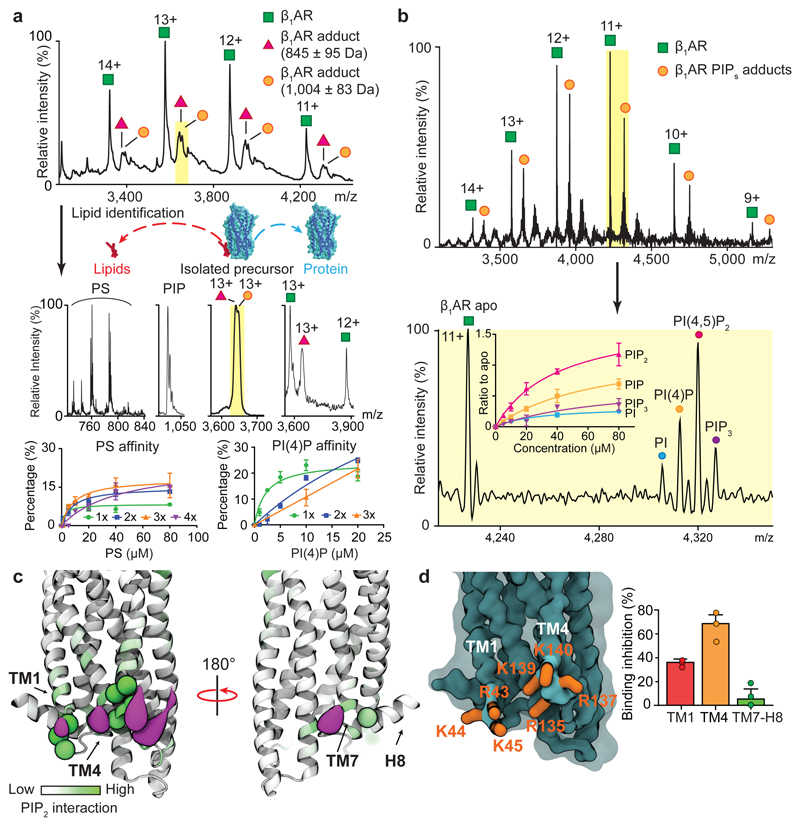
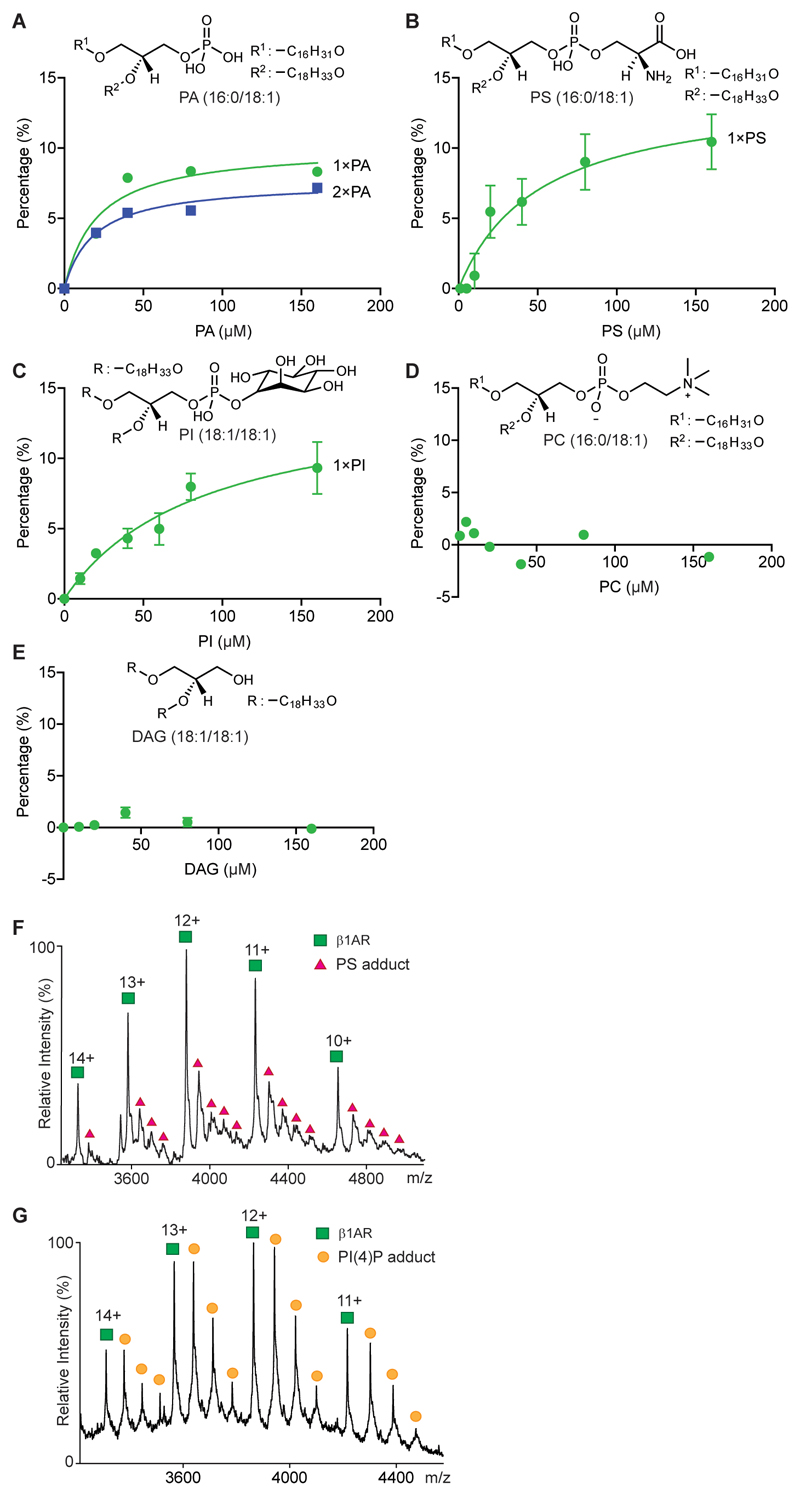
We considered first the endogenous lipids that bind directly to β1AR and the stabilised NTSR1 HTGH4-ΔIC3B 7 expressed and purified from insect cells and E. coli respectively. Peaks corresponding to lipid adducts were observed for β1AR and for NTSR1 (Fig. 1a and Extended Data Fig. 1a). Collisional dissociation of protein-lipid complexes allowed us to identify two major classes of lipids the phosphatidylserines (PS) (34:2 and 36:2) and phosphatidylinositol phosphates (PI(4)P) (42:5) bound to β1AR as well as phosphatidic acid (PA) (36:2) bound to NTSR1. The (Extended Data Fig. 1b and 1c and Extended Data Table 1). Investigating further this selectivity we incubated NTSR1 with PA as well as other anionic lipids (PS and PI), a zwitterionic lipid (PC), and a neutral lipid (DAG). Mass spectra showed that NTSR1 interacts preferentially with PA, PS and PI (Extended Data Fig. 2a-2e). We did not observe significant binding of PG although a positive impact on G protein activation of NTSR1 has been reported for PG in a nanodisc 8. It is possible that PG could affect the local net charge at the receptor/lipid interface. Similarly β1AR, when incubated with detergent-solubilised PS (16:0-18:1) or phosphatidylinositol 4-phosphate (PI(4)P) (18:1-18:1), showed higher affinity toward PI(4)P than PS (Fig. 1a and Extended Data Fig. 2f and 2g).
Figure 1. Identification of endogenous lipids, preferential binding of PI(4,5)P2, MD simulation and site-directed mutagenesis define intracellular PIP2 binding hotspots.
a, Charge states of β1AR (agonist free, 11+ to 14+ green) and adducts are observed bound to the receptor (red, orange). Peaks (highlighted yellow) are selected in the quadrupole and subjected to tandem MS. Phosphatidylserine (PS) and PI(4)P (PIP) were identified in the resulting mass spectra. Binding curves plotted against lipid concentration confirm the preferential binding of PI(4)P over PS. Error bars represent standard deviation of the mean from three independent replicates. b, Mass spectra of β1AR following incubation with an equimolar solution containing PI, PI(4)P, PI(4,5)P2, and PI(3,4,5)P3. Binding curves confirm favorable binding of PI(4,5)P2. Error bars represent standard deviation of the mean from three independent replicates. c, CGMD simulation for NTSR1 TM86V-ΔIC3B embedded in the lipid bilayer containing mixed PC and PIP2. Basic residues forming high interaction levels (green spheres) and PIP2 particle densities (purple surface) representing the most occupied regions (0.6 nm distance cutoff based on the radial distribution of CG particles). d, Mutation of residues in NTSR1 (TM86V-ΔIC3B) highlighted are: TM1 (R43G, K44G and K45G; red), TM4 (R135I, R137T, K139L and K140L; orange) and TM7-H8 (R311N; green). Inhibition of PIP2 binding is plotted from three independent experiments with standard deviation of the mean. Results indicate that mutations on the TM4 interface have a greater effect than the TM1 and TM7-H8 interfaces.
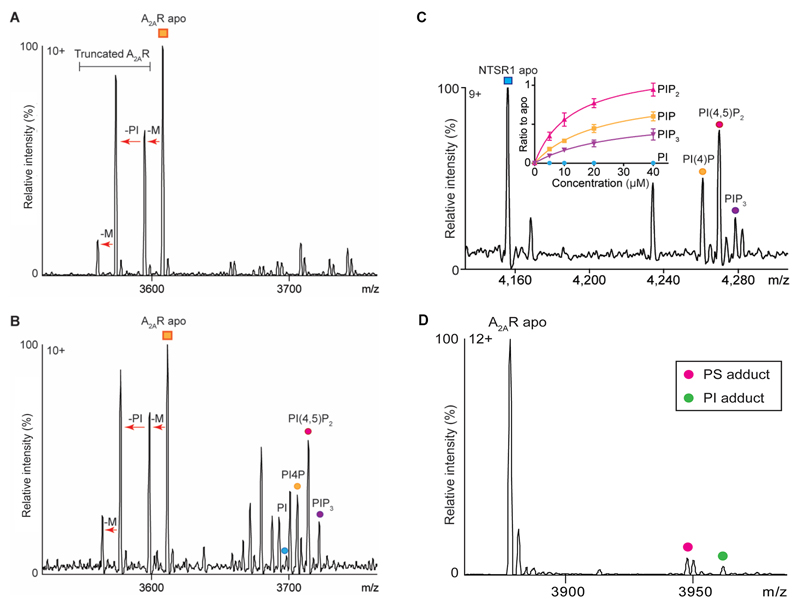
To probe the selectivity of different PI derivatives we incubated β1AR with equimolar ratios of phosphatidylinositol (PI), PI(4)P, phosphatidylinositol 4,5-bisphosphate (PI(4,5)P2), and phosphatidylinositol (3,4,5)-trisphosphate (PI(3,4,5)P3) all with the same acyl chains (18:1/18:1). Plotting intensity ratio to the apo protein in the mass spectrum of each bound lipid peak against concentration showed that PI(4,5)P2 bound to a greater extent than PI(4)P indicating that an additional phosphate group on PIP2 increased the affinity (Fig. 1b). For PI(3,4,5)P3, in which a further phosphate group is introduced over PIP2, binding to β1AR was reduced to a similar level as observed for PI, demonstrating selectivity for the PIP2 head group. Analogous experiments were carried out for NTSR1 and A2AR and in all cases (PI(4,5)P2) was found to bind with the highest affinity (Extended Data Fig. 3) implying that preferential binding sites for PIP2 exist on all three class A GPCRs.
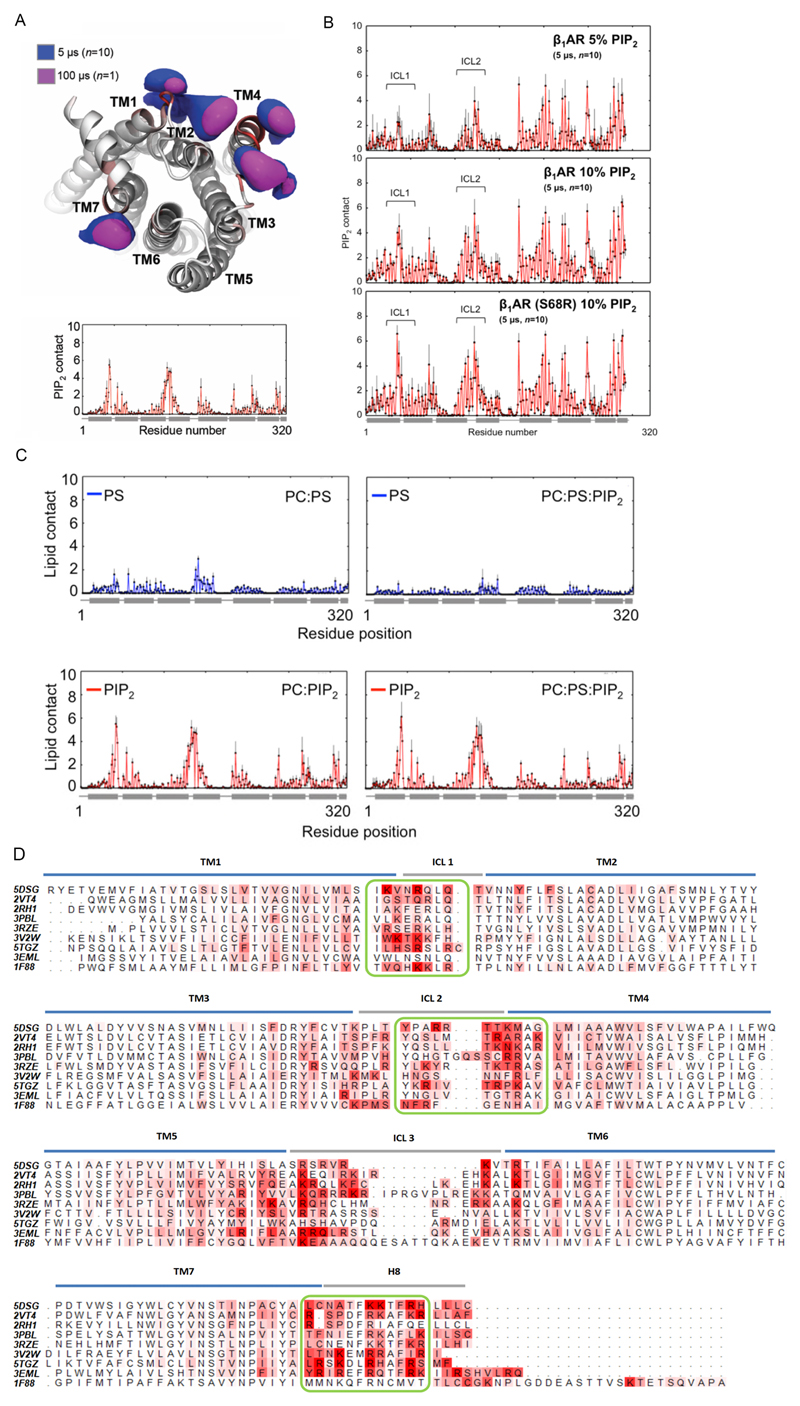
We carried out coarse-grained molecular dynamics (CGMD) simulations (Extended Data Fig. 4) to characterize the molecular nature of GPCR: PIP2 interactions to the receptors in a phospholipid bilayer environment 9. PIP2 molecules were seen to bind at the interface formed by the cytoplasmic loops linking TM1, TM2, TM4 and TM7 of the NTSR1, with binding mediated via interactions between the triphosphorylated inositol headgroup and basic protein side chains (Fig. 1C and Extended Data Fig. 4a). Simulation of PS, also identified above, showed diffuse interaction, with lower intensity, and no obvious competition with PIP2 (Extended Data Fig. 4c). Similar interactions were seen for β1AR, which also exhibited the capacity for PIP2 interaction with the positively charged intracellular sides of TM5-7 (Extended Data Fig. 4b). A more extensive comparison of simulations for nine Class A GPCRs (Extended Data Fig. 4d) revealed conservation of this pattern of PIP2 interactions at the intracellular ends of TM helices implying a structural and/or functional significance.
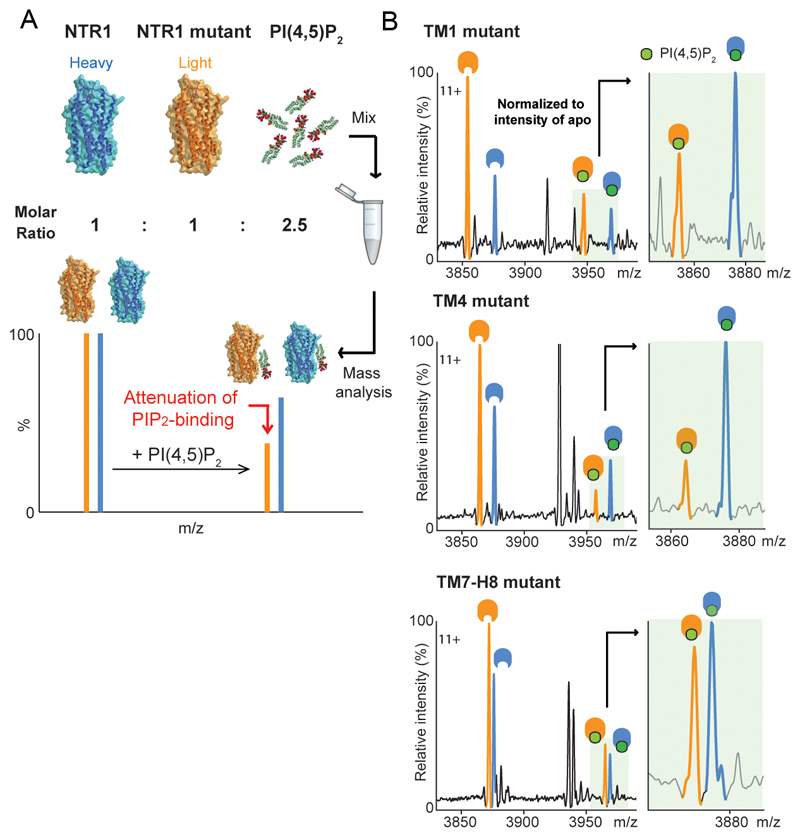
To locate preferential binding sites for PIP2 we performed site-directed mutagenesis on NTSR1 by changing the PIP2 contact residues (Fig. 1d) to other residues that retain the expression and folded state of receptor 10. We developed an MS-based strategy to analyse the impact of mutations on PIP2 binding (Extended Data Fig. 5a). Mutating selected Lys/Arg residues to residues of lower mass decreased the molecular weight of the receptor, thus making the mutants “light” compared to the unmodified parental receptor (“heavy”). An equimolar solution of mutant and unmodified receptor when incubated with PIP2 experiences an identical lipid environment and can be resolved by MS. Attenuation of PIP2 binding was observed in TM1 (35± 0.03%) and TM4 (70± 0.13%) (Fig. 1d and Extended Data Fig. 5b) implying hotspots for PIP2 binding on the cytoplasmic face of these receptors.
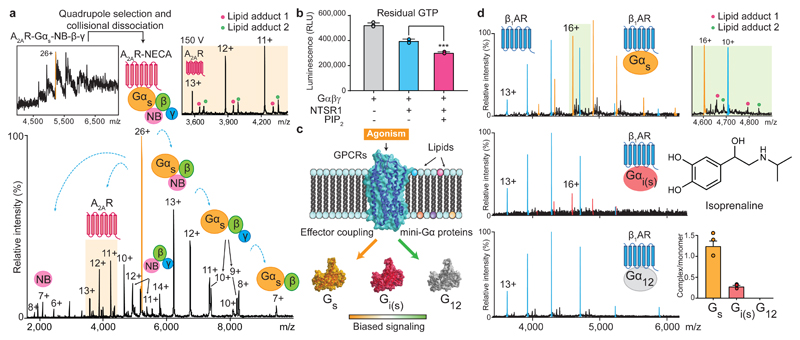
Given the location of these sites we reasoned that PIP2 binding might influence downstream G-protein coupling. To investigate this we developed an MS approach in which the pentameric complex of A2AR (A2AR-mini-Gαs-Nb-β-γ)11,12 was preserved in vacuum. The hetero-pentamer liberates various subcomplexes following collision-induced dissociation with (PS and PI) observed bound directly to A2AR at higher abundance than when bound to the receptor prior to G protein coupling (Fig. 2a and Extended Data Fig. 3d). We reasoned that these lipids in receptor: triple G protein assemblies may play a role in stabilising the complex, and in turn, increase signaling. To test these effects we measured the GTPase activity of Gαi-Gβ-Gγ when coupled to active NTSR1, stimulated by neurotensin8-13, in the presence or absence of PIP2. We found that GTP hydrolysis was enhanced (1.3 -fold) allowing us to conclude that PIP2 improves G protein coupling and GTPase activity (Fig. 2b).
Figure 2. The selectivity of G-protein coupling and the presence of endogenous lipids on coupled receptors.
a, A representative mass spectrum of A2AR receptor coupled to a trimeric G-protein complex stabilised by a nanobody (Inset top left) from three independent experiments. Isolating and subjecting charge state 26+ (orange main figure) to collision-induced dissociation gives rise to subcomplexes and the liberated receptor with lipid adducts (highlighted orange). b, GTPase assays indicate an increase of GTP hydrolysis by active NTSR1coupled to trimeric Gαiβγ in the presence of PIP2 (*** denotes a statistically significant difference (p (0.0006) < 0.001) calculated with a t-test to compare the effect of PIP2 (one variable) on receptor-induced GTPase activation. Data points were overlaid and error bars represent standard deviations of the mean from three independent replicates. c, Schematic representation of the influence of lipids and agonists on the binding of mini-G proteins. d, Mass spectra of isoprenaline bound β1AR with three different mini-G subunits (mini-Gs, i(s),12). Enhanced coupling and lipid adducts are observed in the presence of Gs. (highlighted green top right). Error bars denote standard deviations of the mean from three independent replicates and each data point was overlaid.
Given the instability of the trimeric G protein complex it is not possible to explore the effects of lipids on coupling in an unbiased way. We therefore investigated receptor complexes formed with engineered mini-G subunits that recapitulate the increase in agonist affinity observed upon coupling with the native heterotrimeric G protein (Fig 2c). Mass spectra of thermostabilised β1AR in complex with mini-Gs were recorded. The association of lipids was found to be higher when β1AR is in complex with mini-Gs than for the receptor alone (Fig. 2d). A high population of the receptor mini-Gs complex is preserved enabling the selectivity toward different subtypes of Gα subunits (Gs, Gαi/o, and Gα12/13) to be explored. We investigated the coupling of agonist-bound β1AR to mini-Gi(s), engineered from mini-Gs by introducing nine mutations on the α5 helix to the corresponding residues on Gαi, and similarly for Gα12 which was prepared by transferring all the mutations from mini-Gs to G12 2. We observed a lower extent of coupling for mini-Gi(s) and virtually no coupling for mini-G12 (Fig. 2d).
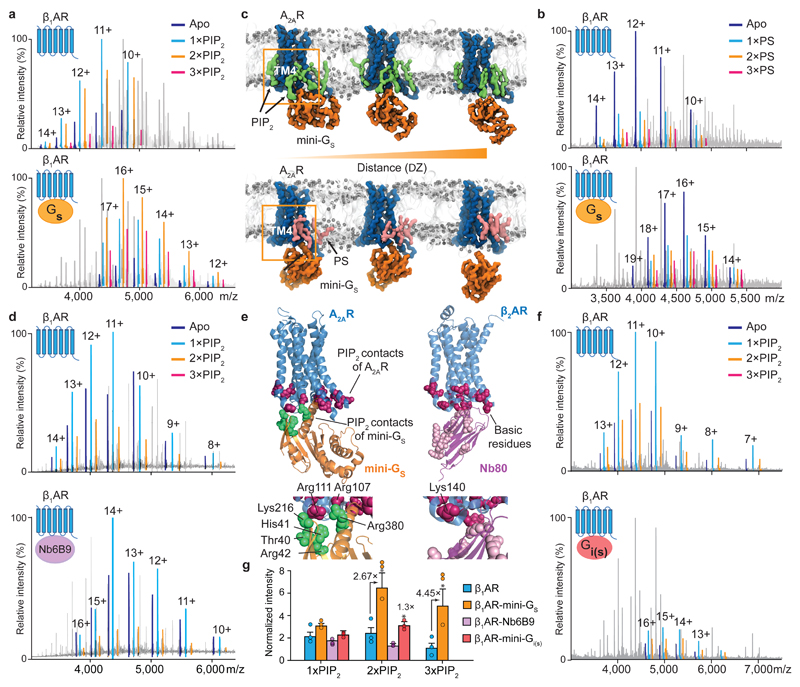
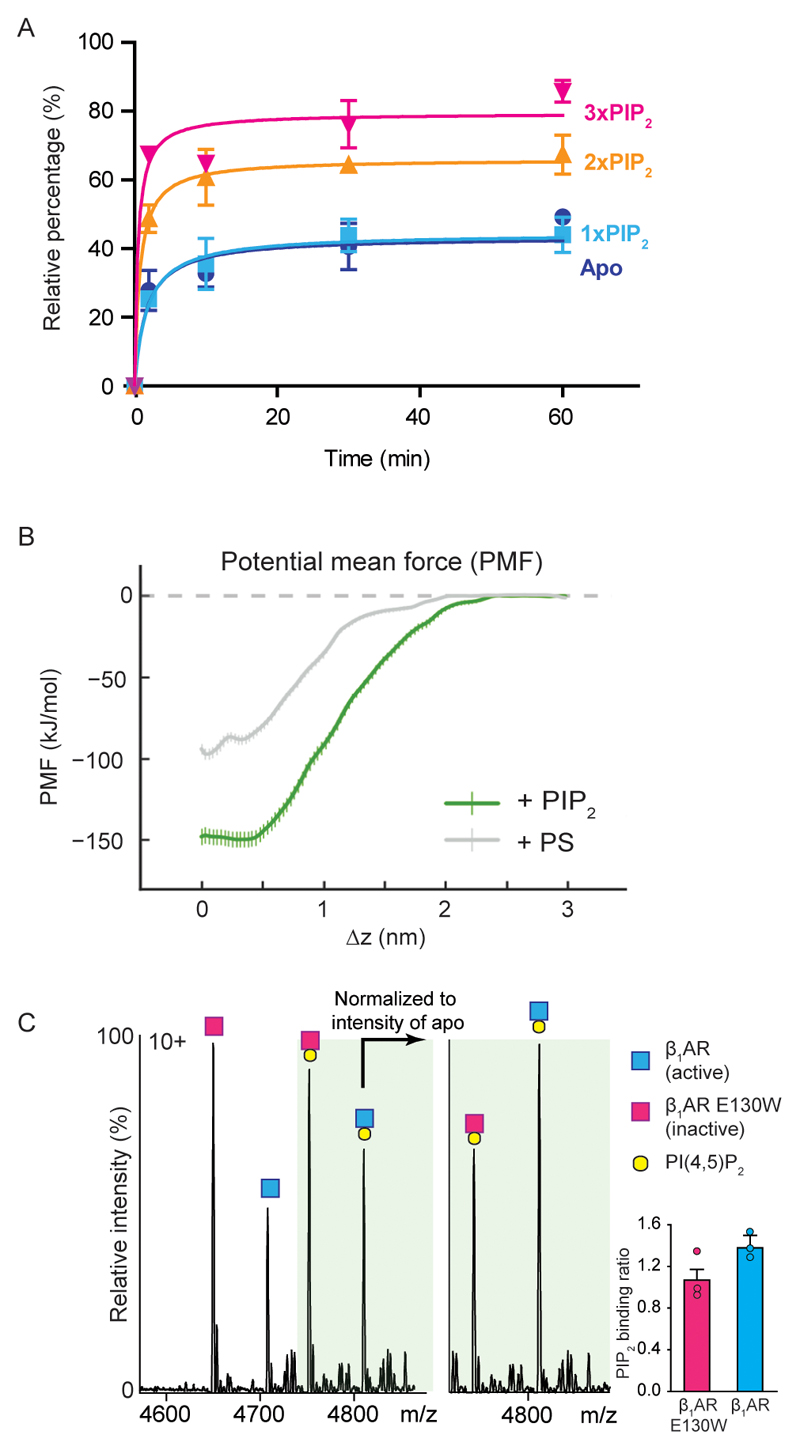
To investigate the effect of PIP2 on GPCR: mini-Gs interactions, we incubated the agonist-bound receptor β1AR with the highest affinity mini-G, mini-Gs, in the presence of lipid and compared the lipid-bound peaks. Although the complex can form in the absence of lipids, or with only one PIP2 bound, in the presence of two or three PIP2 molecules complex formation is significantly enhanced (2.7- and 4.5-fold respectively, compared to the receptor without lipid) (Fig. 3a and 3g). We also observed the same phenomenon from a time course experiment that indicated 21 ± 6 % enhancement of mini-Gs coupling with two PIP2 molecules bound, whereas the third PIP2 increases binding by an additional 12 ± 5 % (Extended Data Fig. 6a).
Figure 3. The effect of PIP2 on coupling to mini-Gs, and comparison with PS, a nanobody and mini-Gi.
a, A representative mass spectrum of the β1AR:mini-Gs complex (n=3) in the presence of PIP2 and the agonist isoprenaline with uncoupled β1AR lipid bound states highlighted according to the colour coding (upper) and β1AR:mini-Gs lipid bound states highlighted in the same spectrum (lower). b, A representative mass spectrum of the β1AR:mini-Gs complex (n=3) in the presence of PS and the agonist isoprenaline. No appreciable difference can be attributed to PS binding between β1AR and β1AR:mini-Gs. c, Snapshots of steered MD simulations to pull mini-Gs away from A2AR in the presence of PIP2 (green) and PS (pink). Results reveal different binding modes of PIP2 and PS to the receptor (outlined orange boxes). The interaction of mini-Gs with A2AR is stabilised in the presence of PIP2 by ~50 kJ/mol relative to PS (Extended Data Fig. 6b). d, A representative mass spectrum recorded following incubation of β1AR with PIP2, isoprenaline and a nanobody (Nb6B9) (0.3 molar ratio to receptor, n=3). e, PIP2 contacts of A2AR-miniGs complex are shown on the receptor (purple) and miniG s (Thr40, His41, Arg42, Lys216, Arg380; green), and juxtaposed to basic residues on β2AR-Nb80 complex (purple). f, A representative mass spectrum of PIP2 binding to mini-Gi(s) (n=3). No difference is detected +/- PIP2. g, The intensity ratios of different lipid bound states to the apo state of receptor in the uncoupled/coupled state are plotted. The asterisk denotes a statistically significant difference (p < 0.05) calculated as one-way ANOVA with Dunnett’s multiple comparison test. Error bars represent standard deviations of the mean from three independent replicates.
Another anionic lipid such as PS, identified as an endogenously bound lipid to the receptor (Fig. 1A), was recruited for examining its effect on mini-Gs coupling. We carried out analogous experiments using a concentration of PS 3-fold higher than that used for PIP2 to reflect the reduced affinity of PS defined above (Fig. 3b and Extended Data Fig. 2). Mass spectra showed only a slight increase in the extent of mini-Gs coupling as a function of PS binding. This reduced effect implies that the electrostatic interactions of the polyanionic lipid headgroups in PIP2 with multiple basic sidechains, as observed in e.g. Kir channels 13, are necessary for bridging receptor coupling and are not possible with PS.
Because our data imply that additional PIP2, but not PS, stabilise the complex once receptor coupling has occurred we used potential of mean force (PMF) calculations 14 to explore the effect of PIP2 binding on the free energy landscape of A2AR-mini-Gs interactions15. Comparison of PMFs for PIP2-bound versus PS-bound receptor in a lipid bilayer indicates that the interaction of mini-Gs with A2AR is stabilised significantly (~ 50 ± 10 kJ/mol) in the presence of PIP2 compared with PS (Fig. 3c and Extended Data Fig. 6b). The presence of PIP2 at the interface between the receptor and mini-Gs in the PMF calculation implies that PIP2 molecules form bridging interactions to stabilise the complex.
There are two potential scenarios for the increase in PIP2 binding to the β1AR:mini-Gs complex: (i) active conformations of receptors bind more PIP2 than their inactive counterparts or (ii) positively charged residues in mini-Gs, at the membrane receptor-G protein interface, recruit additional PIP2 molecules following coupling. To investigate the dependence of PIP2 binding on receptor conformation we incubated PIP2 with β1AR (co-purified with the agonist isoprenaline) and with an E130W mutation to stabilise ligand free β1AR without affecting G protein coupling 16. We observed a 31 ± 1% increase in PIP2 binding to the agonist-bound receptor compared to the unbound state (Extended Data Fig. 6c). While in general transition to active states is thought to involve substantial movements of TM5 and TM6, ICL2 was also found to undergo significant changes during activation of the Kappa Opioid Receptor 17. Our results are consistent with PIP2 stabilising active states of receptors through hotspots for binding on ICL2 directly, and diffuse intracellular PIP2 binding sites more generally.
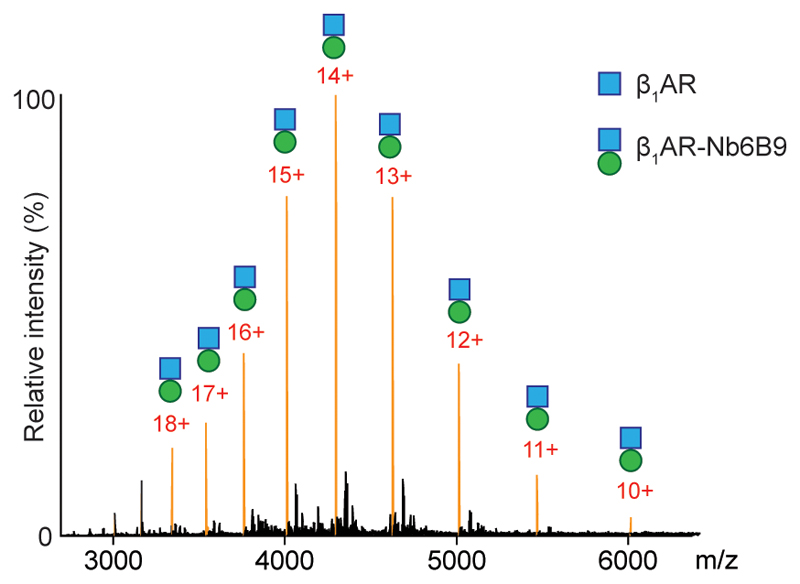
To explore scenario (ii) wherein additional PIP2 binding sites form following coupling, we carried out CGMD simulations for A2AR-mini-Gs, which is the only available structure of a receptor-mini-G complex. In addition to contacts observed above, PIP2 was seen to interact with the residues of mini-Gs proximal to the lipid contacts on the A2AR TM3, TM4 and TM5 interface (Fig. 3e). To investigate the significance of these additional binding sites we employed a nanobody (Nb6B9) 18, where lipid binding residues observed in mini-Gs are absent 12 (Extended Data Fig. 7). (Structures of the receptors bound to the nanobody or mini-Gs are virtually identical (rms deviation 0.4-0.6 Å)) 19. Comparing directly the extent of PIP2 binding to the receptor and receptor-nanobody complex we found that the degree of PIP2 binding was closely similar (Fig. 3d and 3g). The absence of corresponding residues in the nanobody (Fig. 3e) explains the insensitivity to PIP2 in receptor-nanobody complexation and implies that PIP2 molecules enhance coupling via interactions specific to the receptor and mini-Gs. Lipids without the polyanionic headgroups, such as PS, would not be able to induce this effect.
To investigate the possibility that specific residues on mini-Gs, as opposed to other G proteins, mediate bridging we investigated the effects of PIP2 on the coupling of mini-Gi(s) to agonist-bound β1AR. We found that coupling in the presence of PIP2 was improved but to a lower extent (Fig. 3f and 3g). Given the established role in coupling to receptors of helix 5 in Gαs (R380), together with residues identified by MD simulation (Fig. 3e), and the fact that these residues are substituted in Gαi (E40, V41, K42, D216, T380) differences in PIP2 binding can be attributed to disruption of these PIP2 bridging sites. It follows therefore that PIP2 binding sites on Gαs, not present on Gαi, enable simultaneous binding of the β1AR to the G protein of highest affinity. Consequently we propose that PIP2 acts as an allosteric modulator, binding to the intracellular side of the receptor, stabilising the active state and enhancing selectivity of G-protein coupling. This coupling is then further stabilised by PIP2 molecules bridging between receptors and the selected G-protein.
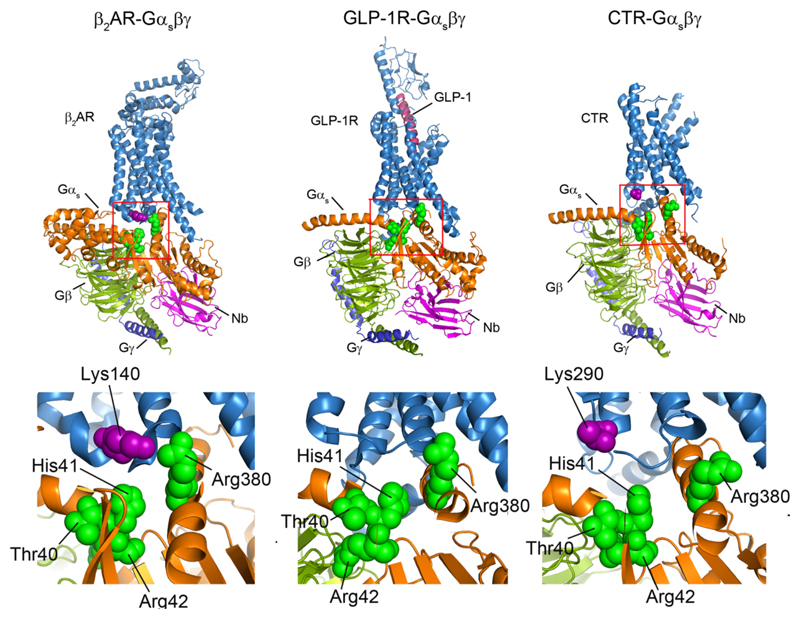
More generally, it is established that the cytoplasmic face of GPCRs undergo conserved conformational change to allow coupling of G proteins 20 with the cytoplasmic ends of TM5 and TM6 moving outwards, and TM7 moving inwards slightly. Synthetic molecules that bind at the TM5-TM6-TM7 cytoplasmic interface act as negative allosteric modulators that inhibit the activation of GPCRs by preventing their movement and consequently reducing the affinity of agonists at the orthosteric binding pocket 21,22. Here we highlight another role of the cytoplasmic interface through the recruitment of PIP2 and the stabilisation of active G protein-bound states of GPCRs. Simultaneous binding of the PIP2 head group to both the Gα subunit and conserved TM4 residues on a number of class A receptors, that are not observed for class B receptors, suggests the generality of this mechanism for stabilising selectively active states of class A GPCRs. (Extended Data Fig. 4d and 8).
As the local concentration of PIP2 in the membrane has the potential to be modulated by different signaling pathways, for example receptor tyrosine kinases or Ca2+ signaling, crosstalk with GPCRs through PIP2 may represent another mode of regulation in the cell 23. In addition, the potential to stabilise the active conformation of G protein-coupled receptors through the binding of potent small molecules that mimic the bridging effects of the PIP2 head group provides a further avenue for stabilising active states of GPCRs for therapeutic purposes. As PIP2 is able to discriminate between different G protein subunits, and is likely to further distinguish binding to β-arrestin, there is the potential of developing novel compounds that bind specifically to different G protein-coupled or β-arrestin bound states, thus providing a new perspective for rational design of novel biased allosteric agonists.
Online Methods
Constructs and proteins
Expression plasmids for two rat NTSR1 stabilised variants7,24 were used in our experiments. NTSR1 HTGH4-ΔIC3B contains the protein sequence from amino acid 50 to 390 with an ICL3 deletion (273-290) and 26 thermostabilising point mutations. It should be noted that this construct is only 80% identical to the wild-type. NTSR1 HTGH4 43-421 contains the intact protein sequence from 43-421, with the same stabilising mutations. Purified thermostabilised turkey (M. gallopavo) β1AR, human wild-type A2AR, engineered Gαs (mini-GS) and Nanobody Nb6B9 were utilized for mass spectrometry analysis11,25,26. The following thermostabilising point mutations on β1AR were used throughout: R68S, M90V, F327A, F338M (for stabilising), C116L (to increase protein expression), R284K (residue equivalent to β2AR designed to improve Nb80 binding), C358A (prevention of potential palmitoylation). In order to purify receptor in the unliganded state, the construct with the same thermostabilising mutations but slightly different lengths of TM1 was introduced with an additional mutation (E130W) for stabilising the receptor. The use of an N-terminal TrxA fusion (C32S & C35S) on the receptor was necessary to confirm formation of a complex on SDS gels. The insect cell lines (Sf9 and Tni) were obtained from Invitrogen and examined without mycoplasma contamination.
Protein expression and purification
Expression and purification of β1AR
The turkey (M. gallopavo) β1AR constructs used (β118 and β114-E130W) were based on the previously published thermostabilised β1AR44-m23 construct but contained only four (R68S, M90V, F327A, F338M) of the original six thermostabilising mutations, as the two mutations on transmembrane helices 5 and 6 (Y227A and A282L) were not included. The omission of these two mutations resulted in constructs that demonstrated coupling to G proteins and to G protein mimetic nanobody Nb80 along with high affinity agonist binding25. The constructs included Thioredoxin (E. coli) fused to the N-terminus of transmembrane helix 1 and the mutations C116L to improve expression and C358A to prevent potential palmitoylation. Both constructs were expressed in insect cells using recombinant baculoviruses prepared using the transfer vector pAcGP67B (BD Biosciences) and BacPAK6 linearized baculovirus DNA (Oxford Expression Technologies). The membrane containing the expressed receptor was solubilized and purified in 2% and 0.02% dodecylmaltoside (DDM, Generon), respectively, as described previously27–29. For β118, the final purification step was competitive elution from a alprenolol sepharose ligand affinity column in 20mM Tris-HCl, ph7.4, 350 mM NaCl and 0.02% DDM supplemented with 1mM isoprenaline so that the receptor was prepared with agonist ligand bound. The purified receptor was finally concentrated to 15mg/ml in the alprenolol sepharose elution buffer.
β114-E130W contained the mutation E130W that increased functional expression of β1AR16. The use of this mutation facilitated the preparation of highly purified active receptor without any ligand bound as the use of a ligand affinity chromatography step was not necessary to separate non-functional receptor. For β114-E130W purification in 0.02% DDM was by Ni2+ affinity chromatography followed by a thrombin (Sigma) protease cleavage step to remove the His tag before further purification by SEC on a Superdex Increase 200 10/300GL column (GE Healthcare) in 20mM Tris-HCl, ph7.4, 100 mM NaCl and 0.02% DDM, with final concentration to 45mg/ml.
Expression and purification of adenosine A2AR
The human adenosine A2AR construct used (residues 1–308) was modified with a C-terminal histidine tag (His10) preceded by a TEV protease cleavage site, and by the mutation N154A to prevent N-linked glycosylation. The A2AR was expressed in insect cells using the baculovirus system, insect cell membranes were prepared and solubilised with 2% lauryl maltose neopentyl glycol (LMNG, Anatrace) and the receptor purified by Ni2+ affinity chromatography and size-exclusion chromatography (SEC), utilizing a Superdex Increase 200 10/300GL column (GE) run in 20 mM HEPES pH 7.5, 100 mM NaCl, 10% (v/v) glycerol, 0.01% (w/v) LMNG and concentrated to 10mg/ml. Purification was as described previously11, with the exception that the receptor was purified without addition of ligand.
Expression and purification of mini-Gs, mini-Gi and mini-G12
The engineered minimal G proteins, mini-Gs construct R41425, mini-Gi construct and mini-G12 construct 8 2 were expressed in E. coli and purified by Ni2+ affinity chromatography, followed by cleavage of the histidine tag using TEV protease and negative purification on Ni2+-NTA to remove TEV and undigested mini-G protein, and finally SEC to remove aggregated protein as described elsewhere25,30, with final concentration up to 100 mg/ml in 10 mM HEPES, pH 7.5, 100 mM NaCl, 10% v/v glycerol, 1 mM MgCl2, 1 μM GDP and 0.1 mM TCEP.
Expression and purification of nanobody Nb6B9
A synthetic gene (Integrated DNA Technologies) for Nb6B912,31 was cloned into the plasmid pET-26b(+) (Novagen) with a N-terminal His6 tag followed by a thrombin protease cleavage site. Expression was in E. coli strain BL21(DE3)RIL (Agilent Technologies) and purification from the periplasmic fraction was by Ni2+ affinity chromatography, but with the use of a thrombin (Sigma) protease cleavage step to remove the His tag before concentration to 40 mg/ml.
Preparation of receptor G protein complexes
Several receptor-G protein complexes were made for MS analysis; A2AR-mini-Gsβγ, which is prepared by incubating A2AR, with a TrxA fusion at the N-terminal, co-purified with NECA and the trimeric G proteins consisted of mini-Gs, Gβ and Gγ in the presence of nanobody Nb35 at 1:2:4 molar ratio (Receptor:G proteins:Nb) to stabilise the complex. The complex was further purified by gel-filtration chromatography after overnight incubation. β1AR-miniG, which is prepared by incubating β1AR co-purified with isoprenaline and different subtypes of mini-G protein (mini-Gs, mini-Gi(s) and mini-G12) at 1:1.2 molar ratio. The incubation time is varied in order to capture the equilibrium of complex formation.
Purification of heterotrimeric G protein
Baculovirus encoding the desired subunits (αi1β1γ1) were used to express the heterotrimeric G protein in Sf9 cells as previously described32. The cells from 1L expression culture were resuspended and lysed in lysis buffer (10 mM HEPES pH 7, 20 mM KCl, 10 mM MgCl2, 10 μM GDP, 2 mM β-mercaptoethanol, and cOmplete protease inhibitor (Roche)). The membranes were pelleted by ultracentrifugation at 108,000 × g for 35 min and solubilized in solubilisation buffer (50 mM HEPES pH 7, 150 mM NaCl, 10 mM MgCl2, 10 μM GDP, 2 mM β-mercaptoethanol, 1% decyl-β-D-maltopyranoside (DM) (w/v), 10% (v/v) glycerol, and cOmplete protease inhibitor (Roche)) for 3 h. The supernatant was collected after centrifugation at 108,000 × g for 35 min and incubated with 1.2 mL of TALON beads (GE Healthcare) overnight. The beads were collected and washed by ten column volumes (CV) of wash buffer (30 mM HEPES pH 7, 300 mM NaCl, 10 mM MgCl2, 25 mM Imidazole pH 8, 10 μM GDP, 2 mM β-mercaptoethanol, 10 % (v/v) glycerol, and 0.5% (w/v) DM), followed by another twenty CV wash of wash buffer containing 40 mM Imidazole (pH 8.0) and were eluted with five CV elution buffer (30 mM HEPES pH 7, 150 mM NaCl, 1 mM MgCl2, 300 mM Imidazole pH 8, 10 μM GDP, 2 mM β-mercaptoethanol, 10 % (v/)v) glycerol, and 0.5% (w/v) DM). The protein was further purified by a Superdex 200 Increase PC 3.2/300 column (GE Healthcare) and the protein tag was removed by incubation with human rhinovirus 3C protease (in-house produced) overnight. Following the buffer exchange to storage buffer (20 mM HEPES pH 7, 100 mM NaCl, 0.1 mM MgCl2, 4 mM β-mercaptoethanol, 10 % (v/)v) glycerol, and 0.5% (w/v) DM) and reverse IMAC by Ni-NTA superflow beads (GE Healthcare), G protein complex was concentrated to at least 2 mg/mL for experimental use.
NTSR1 expression: E. coli BL21 cells were transformed with the expression plasmid encoding NTSR1 HTGH4-ΔIC3B and grown overnight at 37°C in 20 ml of 2YT medium supplemented with 1% (w/v) glucose and 100 μg/mL ampicillin. Two shake flasks containing each 1 L of 2YT medium, 0.5% (w/v) glucose, and 100 μg/ml ampicillin were inoculated using 10 ml pre-culture and grown to an OD600 of 0.5 at 37°C. Receptor expression was induced with 1 mM isopropyl-β-D-thiogalactopyranoside (IPTG) and cells were cultivated at 28°C overnight. Cells were harvested after overnight expression and E. coli cell pellets were resuspended in 100 ml of solubilisation buffer, containing 100 mM HEPES pH 8.0, 20% (v/v) glycerol and 400 mM NaCl. Resuspended cells were frozen in liquid nitrogen and stored at -80 °C.
NTSR1_apo purification: The cell pellet was thawed at room temperature. All following steps were carried out at 4 °C. 0.5 mL of 1 M MgCl2 (5 mM), 2 mg DNase I, 200 mg lysozyme, and 20 ml of a detergent mixture (composed of 0.2% (w/v) cholesteryl hemisuccinate Tris salt (CHS) and 2% (w/v) dodecyl-β-D-maltopyranoside (DDM)) were added to the thawed cell pellet. The mixture was incubated for 1 h, followed by cell lysis via mild sonication for 30 min in an ice-water bath. After cell lysis, 0.4 ml of 5 M imidazole was added and the mixture was incubated for another 30 min. The suspension was centrifuged for 30 min at 28,000 × g. The supernatant was mixed with 5 ml of TALON resin (Clontech, Mountain View, CA, USA), which had been pre-equilibrated with IMAC binding buffer (25 mM HEPES pH 8.0, 10% (v/v) glycerol, 600 mM NaCl, 0.1% (w/v) DDM and 20 mM imidazole) and incubated overnight on a rolling device. The mixture was loaded into a PD10 column (GE Healthcare, Uppsala, Sweden) and was washed with 50 ml of IMAC binding buffer. Elution of bound protein was performed with 15 ml IMAC elution buffer containing 25 mM Hepes pH 8.0, 10% (v/v) glycerol, 150 mM NaCl, 0.1% (w/v) DDM and 250 mM imidazole. Eluted receptor was concentrated in an Amicon-15 Ultra concentrator with a 100 kDa cut-off (Millipore, Billerica, MA, USA) to a final volume of less than 2.5 ml. Concentrated receptor sample was loaded on a Sephadex G-25 desalting column (GE Healthcare, Uppsala, Sweden), pre-equilibrated with 25 mM Hepes pH 8.0, 10% (v/v) glycerol, 150 mM NaCl, 0.1% (w/v) DDM to remove remaining imidazole. Desalted receptor was incubated with 300 μl of 1.6 mg/ml HRV 3C protease for 1 h at 4°C, followed by addition of 150 μl 10% (w/v) LMNG and incubation for 1 h at 4°C. The cleaved protein was diluted threefold with reverse IMAC buffer (10 mM HEPES pH 8.0, 10% (v/v) glycerol, 150 mM NaCl, and 0.01% (w/v) LMNG) and was loaded onto a PD10 column containing 5 ml Ni-NTA beads pre-equilibrated with reverse IMAC buffer. The flow-through was collected in an Amicon-15 ultra concentrator with a 50 kDa cut-off and the resin was further washed with 10 ml buffer. Receptor was concentrated to a final volume of less than 1 ml and was subjected to preparative size exclusion chromatography using a Superdex 200 10/300 GL column (GE Healthcare, Uppsala, Sweden), which had been pre-equilibrated with 10 mM HEPES pH 8, 150 mM NaCl, and 0.01% (w/v) LMNG. Peak fractions corresponding to NTSR1 HTGH4-ΔIC3B were pooled (final volume 3-4 ml) and concentrated in an Amicon-4 ultra-concentrator with a 50 kDa cut-off to a final protein concentration of approximately 50 μM. Purified and concentrated NTSR1-H4 was mixed with 10 mM HEPES pH 8, 150 mM NaCl, 0.01% (w/v) LMNG, and 50% (v/v) glycerol to yield a final glycerol concentration of 25%. Aliquots were frozen in liquid nitrogen and stored at -80 °C for later usage.
Preparation of phospholipids and titration experiment
Phospholipids were purchased from Avanti (Avanti Polar Lipids Inc., Alabama, USA) and prepared as stock concentration of 3 mM in 200 mM ammonium acetate buffer pH 7.5 containing the detergent mixed micelle preparation, which contains DDM and foscholine as previously described33. A phosphate analysis was performed to determine the concentration of phospholipids in solution34. For the titration experiment, 5 μM of buffer exchanged receptors in 200 mM ammonium acetate buffer pH 7.5 containing the detergent mixtures (DDM, LMNG, and foscholine for NTSR1; DDM and foscholine for β1AR and A2AR) were mixed with lipids at various concentration points followed by equilibration at 4°C for 5 min, by which time lipid binding had stabilised according to our time course measurements. Following mass spectrometry analysis UniDec (Universal Deconvolution) software was utilized to quantify the relative abundance of each lipid bound state35, and statistical analysis was performed by GraphPad Prism assuming a one-site total binding model.
Lipidomics analysis
Co-purified lipids from recombinant GPCRs were extracted by chloroform/methanol (2:1, v/v) and lyophilized and re-dissolved in 60% acetonitrile (ACN). For LC-MS/MS analysis, the extracted lipids were separated on a C18 column (Acclaim PepMap 100, C18, 75 mm × 15 cm; Thermo Scientific) by means of Dionex UltiMate 3000 RSLC nano LC System. The buffers and gradient are adapted from a previous protocol.36 Briefly, the lipids were separated using a binary buffer system at 40°C using a gradient of 32% to 99% buffer B at a flow rate of 300 nl/min over 30 min. (Buffer A: (ACN: H2O (60:40), 10 mM ammonium formate, 0.1% formic acid) and buffer B (IPA: ACN (90:10), 10 mM ammonium formate, 0,1% formic acid)). The column eluent was delivered via a dynamic nanospray source to a hybrid LTQ Orbitrap mass spectrometer (Thermo Scientific). Typical MS conditions were: spray voltage (1.8 kV) and capillary temperature (175 °C). The LTQ-Orbitrap XL was operated in negative ion mode and in data-dependent acquisition with one MS scan followed by five MS/MS scans37. Survey full-scan MS spectra were acquired in the orbitrap (m/z 350 – 2,000) with a resolution of 60,000. Collision-induced dissociation (CID) fragmentation in the linear ion trap was performed for the five most intense ions at an automatic gain control target of 30,000 and a normalized collision energy of 38% at an activation of q = 0.25 and an activation time of 30 ms.
GTPase assay
The GTPase activity of trimeric Gαiβγ was measured by using a commercial GTPase-Glo™ assay (Promega). The assay was performed in white 384-well plates (Corning) using purified trimeric G proteins diluted into a GTPase buffer (10 mM HEPES pH 7, 50 mM NaCl, 0.05 mM MgCl2, 2 mM β-mercaptoethanol, 1mM DTT, 5 % (v/v) glycerol, and 0.25% (w/v) DM) at a finial concentration 2.5 μM in the presence of 5 μM GTP. The luminescent signal was measured after incubation at room temperature (1 h) following the protocol provided to indicate the level of residual GTP. To analyse the impact of PIP2 we used NTSR1 HTGH4-ΔIC3B co-purified with recombinant neurotensin8-13 following the method described previously38. The receptor was pre-incubated with detergent solubilised PIP2 at 1:3 molar ratio (receptor to lipid) in the protein buffer (10 mM HEPES pH 8, 150 mM NaCl, 0.01% (w/v) LMNG) containing 100 nM neurotensin8-13 for 15 min on ice. The activated receptor was then added to the reaction mixture containing trimeric G proteins under the condition described above.
Native mass spectrometry of GPCRs
Purified GPCRs were buffer exchanged into 200 mM ammonium acetate buffer pH 7.5 containing the mixed micelle preparation optimized for GPCR analysis as described previously6. The concentration of DDM, foscholine and CHS required to form a mixed micelle range from 0.006-0.02%, 0-0.002%, and 0.001-0.01%, respectively and are optimized for each receptor preparation. The samples were immediately introduced into a modified Q-Exactive mass spectrometer (Thermo) described previously5. Ions were transferred into the Higher-energy collisional dissociation (HCD) cell following a gentle voltage gradient (injection flatapole, inter-flatapole lens, bent flatapole, transfer multipole: 7.9, 6.94, 5.9, 4 V respectively). An optimized acceleration voltage (100-130 V) was then applied to the HCD cell to remove the detergent micelle from the protein ions. Backing pressure was maintained at ~1.00 x 10⁻⁹ mbar and data was analysed using Xcalibur 2.2 SP1.48.
The bound lipid identification experiments were performed with a modified Synapt G2 mass spectrometer (Waters) equipped with a Z-spray source33,39. The typical instrumental setting was source pressure (4.5-5 mbar) capillary voltage (1.2 – 1.5 kV) and cone voltage (100–200V). An extraction voltage of 1-5 V was applied and 80–150V was used as the collision voltage with argon as the collision gas at a pressure of 0.2–0.3 MPa. To strip the detergent from protein ions in the source region, instrument values were optimized to capillary voltage (1.5 kV), cone voltage (200 V) and extraction voltage (3 V). A collision voltage ramp (from 20 – 100 V) was applied to dissociate protein-lipid complexes after quadrupole selection.
Identification of preferential PIP2 binding sites on NTSR1
Unmodified NTSR1 and NTSR1 variants were pre-incubated at 1:1 molar ratio to give a total protein concentration of 12 mM in the protein buffer (10 mM HEPES pH 8, 150 mM NaCl, 0.01% (w/v) LMNG and 25% (v/v) glycerol). Detergent solubilised PI(4,5)P2 was then added to the protein mixture at final molar ratio of 1.25:1 lipid:receptor. The reaction mixture was incubated at 4 °C for 5 min and analysed by MS after buffer exchanging to 200 mM ammonium acetate buffer containing the mix of detergents of DDM, LMNG and foscholine as described previously6.
The ratio of PIP2 binding to the receptor was calculated by normalizing the intensity of the receptor in PIP2 bound states to the unbound state using UniDec software. The results were evaluated by comparing the ratio of PIP2 binding between mutants and the unmodified receptor and plotted as a bar chart using GraphPad Prism.
Mini-GS and nanobody coupling to β1AR
Effector coupling to β1AR was analysed by a modified Q-Exactive mass spectrometer after incubating purified β1AR with mini-GS/Nb6B9 at 1:1.2 molar ratio at 4 °C in the protein buffer (20mM Tris-HCl, ph7.4, 350 mM NaCl and 0.02% DDM). The relative percentage of effector coupling was quantified by UniDec software. A time course was performed with aliquots sampled after 2, 10, 30, and 60 min to monitor the formation of the mini-GS-receptor complex. To investigate the effect of PIP2 on coupling, β1AR was pre-incubated with detergent solubilised PIP2 at 1:1 molar ratio for 5 min at 4 °C to equilibrate before mixing with mini-GS or Nb6B9 at 1.2 or 0.3 molar ratio to receptor, respectively. For the analogous PS binding experiment we pre-incubated β1AR with a 3-fold higher concentration of detergent solubilised PS than PIP2 (PS: β1AR 3:1 molar ratio) for 5 min at 4°C to equilibrate before mixing with mini-GS.
Modelling and simulation system setup
Simulations were performed using the GROMACS v4.6.3 simulation package1. Initial protein coordinates were obtained using 4BUO (NTSR1) and 2Y03 (β1AR), with missing atoms added using MODELLER40. In the case of β1AR, a model was also constructed in which S68 in the thermostabilised structure 2Y03 was back-mutated to R68 to reconstruct available basic residues in the wild-type receptor by using the mutagenesis tool implemented in PyMOL (Schrodinger, L.L.C. The PyMOL Molecular Graphics System, Version 1.3r1 (2010)). Side chain ionisation states were modelled using pdb2gmx41. The N and C-termini were treated with neutral charge. Each protein structure was then energy minimized using the steepest descents algorithm implemented in GROMACS, before being converted to a coarse-grained (CG) representation using the MARTINI 2.2 force field42. The energy minimized CG structure was centered in a periodic simulation box with dimensions 11 x 11 x 12 nm3. 1-palmitoyl-2-oleoyl-sn-glycero-3-phosphocholine (POPC) molecules were randomly placed around the protein and the system solvated and neutralised to a concentration of 0.15 M NaCl. An initial 50 ns of coarse-grained simulation was applied to permit the self-assembly of a POPC lipid bilayer around the GPCR. POPC lipids were randomly exchanged43 to create a mixed-species bilayer of specified composition (Extended Data Table 2). A cut-off distance of 2.5 nm was applied, with only molecules outside this distance being subject to exchange. The exchange protocol was conducted independently for each repeat simulation, such that different random initial configurations of lipids around the protein were generated for each simulation repeat. A summary of simulations performed is provided in Extended Data Table 2.
Simulation details
The MARTINI force field42 was used to describe all system components. An ELNEDYN network44 was applied to the protein using a force constant of 500 kJ/mol/nm2 and a cut off of 1.5 nm. Simulations were performed as an NPT ensemble, with temperature maintained at 310 K using a Berendsen thermostat45 using a coupling constant of τt = 4 ps, and semi-isotropic pressure controlled at 1 bar using a Berendsen barostat45 with a coupling constant of τp = 4 ps and a compressibility of 5 x 10⁻⁶ bar-1. Electrostatics were modeled using the reaction field coulomb type46, and smoothly shifted between 0 and 1.2 nm. Van der Waals interactions were treated using a shifting function between 0.9 and 1.2 nm. Covalent bonds were constrained to their equilibrium values using the LINCS algorithm47. Equations of motion were integrated utilizing the leap-frog algorithm, with a 20 fs time step. All simulations were run in the presence of conventional MARTINI water, and neutralised to a concentration of 0.15 M NaCl.
Analysis of simulation data was conducted using VMD48, PyMOL (Schrodinger, L.L.C. The PyMOL Molecular Graphics System, Version 1.3r1 (2010)), and tools implemented in GROMACS41, and in-house protocols. Protein-lipid contact analysis employed a cut-off distance of 0.6 nm, based on radial distribution functions for CG lipid molecules49.
A2AR-mini-GS PMF calculations
PMFs for the interaction of mini-GS with A2AR in a lipid bilayer the presence and absence of PIP2 were calculated using the MARTINI force field50. To obtain a PIP2-bound A2AR-mini-GS complex, we first ran ten coarse-grained MD simulations on receptor embedded in an asymmetric complex membrane, each lasting 8 μs (Extended Data Table 2). The Root Mean Square Displacement (RMSD) to the crystal structure of A2AR-mini-GS complex (PDB 5G53) was calculated for the protein in these ten simulations, and the protein complex with the lowest RMSD was saved together with the membrane bilayer. The coarse grained mini-GS was then docked back to the membrane-embedded receptor based on the A2AR-mini GS crystal structure to generate the starting configuration of a steered MD (SMD) simulation. In the SMD, the mini-GS was pulled away from the receptor along z axis (normal to the membrane plane) at a rate of 0.05 nm/ns using a force constant of 1000 kJ/mol/nm2 while the receptor was restrained in place using a harmonic force of 1000 kJ/mol/nm2. The distance between the center of mass (COMs) of the receptor and the mini-GS was defined as the 1D reaction coordinate and the pulling processed covered a distance of 3 nm. The initial configurations of the umbrella sampling were extracted from the SMD trajectory spacing 0.05 nm apart along the reaction coordinate. 50 umbrella sampling windows were generated, and each was subjected to 1 μs MD simulation, in which a harmonic restrain of 1000 kJ/mol/nm2 was imposed on the distance between the COMs of the receptor and the mini-GS to maintain the separation of the two. The PMF was extracted from the umbrella sampling using the Weighted Histogram Analysis Method (WHAM) provided by the GROMACS g_wham tool51. A Bayesian bootstrap was used to estimate the statistical error of the energy profile. The PMF of the binding process in the absence of PIP2 was calculated following the same protocol, with the only change made to the lipid composition of the membrane lower leaflet. PIP2 was taken out from the membrane and instead the concentrations of POPC, DOPC, POPE and DOPE were increased by 2.5% to make up for the vacancy left by the absence of PIP2.
Extended Data
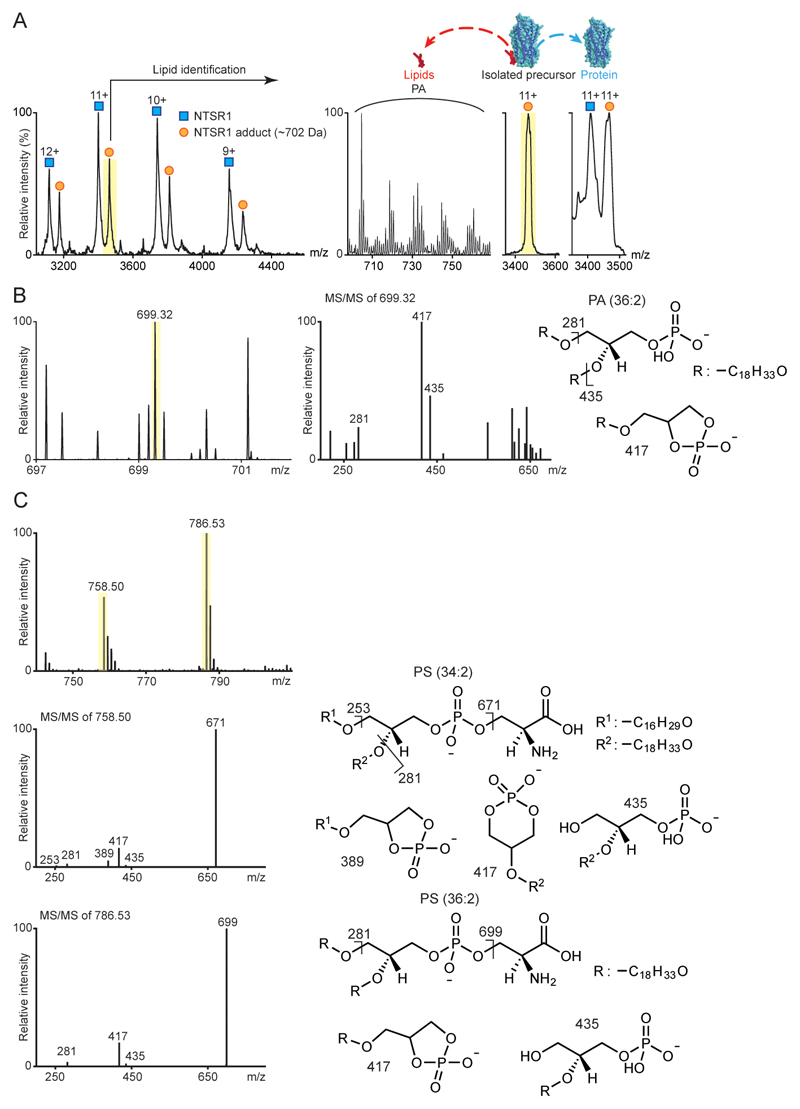
Extended Data Figure 1. Identification of lipids bound to NTSR1 HTGH4-ΔIC3B.
a, Endogenous lipid bounds to NTSR1 HTGH4-ΔIC3B, isolated from E. coli, are identified as PA following m/z selection in the MS quadrupole of the NTSR1:lipid 11+ charge state (highlighted yellow) and collisional activation to dissociate PA and its homologues (m/z 700–760 Da). b, Lipidomics analysis of purified NTSR1 with three technical replicates reveals peaks at low m/z. MS/MS spectra of the precursor ion [M-H-1] at m/z 699.32 highlighted yellow, leads to definitive fragment ions at m/z 281 and 417 consistent with the structure of PA (36:2). c, Analogous lipidomics analysis of purified β1AR from insect cells with three technical replicates. MS/MS spectra of the two [M-H-1] precursor ions (m/z 758.50 and 786.53) identified the lipids as PS (34:2) and PS (36:2) respectively with diagnostic fragments indicated.
Extended Data Figure 2. Lipid binding preference of NTSR1 and β1AR.
The binding of NTSR1 HTGH4-ΔIC3B, measured by mass spectrometry (n=3), to the phospholipids PA (a), PS (b), PI (c), PC (d) and DAG (e). The measurements were performed at different lipid concentration (0 to160 μM) and the percentages of individual lipid-binding peaks (sum of apo protein and all lipid adducts obtained in the region of the mass spectrum under study) were plotted against lipid concentrations in solution. The lipid-binding curves were deduced from fitting to one-site total binding (GraphPad Prism software). Standard deviations of the mean were calculated from three independent replicate experiments at each concentration. The results show that NTSR1 interacts preferentially with anionic phospholipids (PA and PS) as no binding was observed for neutral (DAG) and zwitterionic (PC) lipids. Exogenous POPS (f) and PI(4)P (g) were added to β1AR at different final concentrations (10 μM shown here). Spectra were recorded for a range of lipid concentrations from 0 – 80 μM for PS and 0 – 20 μM for PI(4)P. Peak intensities of the individual PI(4)P-bound species were measured and plotted against lipid concentration to yield a relative affinity for one PI(4)P binding (1x), two PI(4)P molecules binding (2x) or three PI(4)P molecules binding (3x); only the first PI(4)P molecule binds with high affinity (see Fig. 1a). Error bars represent the standard deviation of the mean between three independent experiments.
Extended Data Figure 3. Investigation of the phospholipid preferences of A2AR and NTSR1.
a, A representative mass spectrum of purified A2AR from three independent experiments revealed truncations of the N-terminal sequence (MPIM). The arrow between each species refers to the mass differences corresponding to truncated amino acids (M, PI and M). b, A competitive binding assay (n=3) in which A2AR was incubated with a mixture of lipids (PI, PI(4)P, PI(4,5)P2, and PI(3,4,5)P3) prior to MS, indicated that PIP2 binds with a higher affinity than other phospholipids to A2AR. c, The analogous competitive binding assay in which NTSR1 was incubated with a mixture of lipids (PI, PI(4)P, PI(4,5)P2, and PI(3,4,5)P3) prior to MS. Ratio to apo is plotted as a function of concentration and defined as the intensity ratio of individual PIP adducts to the receptor in the apo state. The same data analysis methods are used for Fig. 1b. Results indicate that PIP2 binds with a higher affinity than other phospholipids to A2AR. Error bars represent standard deviation of the mean from three independent replicates. d, A representative mass spectrum of A2AR (n=3) used for preparation of the G protein complex reveals lower abundance of PS and PI adducts prior coupling to G proteins.
Extended Data Figure 4. NTSR1- and β1AR-PIP2 interactions within CGMD simulations and comparison of PIP2 contacts over different GPCRs.
a, Volumetric density surfaces showing the average spatial occupancy of PIP2 lipids around a crystal structure of NTSR1 TM86V-ΔIC3B (PDB: 4BUO), which shares a greater sequence identity to the wild-type receptor (91%) than NTSR1 HTGH4-ΔIC3B (86%), contoured to show the major PIP2 interaction sites. Density surfaces were calculated over 5-μs of CGMD (blue surface, n=10 independent experiments), and 100-μs of CGMD (magenta, n=1 independent experiment). The cytoplasmic side of NTSR1 structure is colored from white (low PIP2 interaction) to red (high PIP2 interaction). Extending a simulation to 100 μs revealed no overall change in the patterns of PIP2 interaction. Less specific, and hence more dynamic, interaction was seen for the acyl chain moieties of PIP2, which yielded more diffuse probability densities. b, β1AR-PIP2 interactions within CGMD simulations. Contact patterns are shown for simulations containing 5% PIP2 in the lipid bilayer and thermostable β1AR (PDB: 2Y03, upper panel), 10% PIP2 and thermostable β1AR (middle panel), and 10% PIP2 and S68R β1AR construct (bottom panel). In each case PIP2 contacts were calculated over 5-μs of CGMD (n=10 independent experiments), with each repeat simulation initiated from different random system configurations. The std of the mean of lipid contact number is denoted by black error bars. c, PS and PIP2 contacts with NTSR1 as a function of residue position, for PC:PS membranes (top left), PC:PS:PIP2 membranes (top right), PC:PIP2 membrane (bottom left) and PC:PS:PIP2 (bottom right). The position of helices is denoted by horizontal grey bars. Lipid contact is calculated as the mean number of contacts between each residue and a given lipid species per frame, using a 6 Å distance cut-off. Error bars (black) denote the standard deviation of the mean between simulation repeats (n=3). d, PIP2 contacts seen in CG MD simulations for nine Class A GPCRs (3RZE = histamine H1 receptor; 2VT4 = β1 adrenergic receptor; 2RH1 = β2 adrenergic receptor; 5TGZ = CB1 cannabinoid receptor; 5DSG = M4 muscarinic acetylcholine receptor; 3EML = adenosine A2A receptor; 3PBL = dopamine D3 receptor; 3V2W = sphingosine 1-phosphate receptor; 1F88 = rhodopsin). The sequences of the GPCRs are shown, with the TM helices, intracellular loops (ICL) and H8 helices indicated by horizontal bars, and with amino acids coloured by their mean number of contacts per simulation frame with the PIP2 molecules. The three green boxes correspond to the high frequency of PIP2 interactions discussed in the main text for the NTSR1, for the TM1, TM4, and TM7/H8 motifs. Contacts were computed over 1 μs CG-MD simulations (n=3 independent experiments) for each GPCR, using a 6 Å cut-off. Sequences were aligned using T-Coffee52 and mapping of protein-lipid contact data onto the sequence alignment used ALINE53.
Extended Data Figure 5. Site-directed mutagenesis attenuates PIP2 binding to NSTR1.
a, Schematic representation of the experimental protocol designed to combine MS with mutagenesis to produce mutants of lower molecular mass than wild type which when incubated with PIP2 yield a direct readout of the effect of mutations in specific regions. b, PIP2-binding of NTSR1 mutants on residues that exhibit the highest frequency of PIP2 interaction in MD simulation. Mutation of NTSR1 HTGH4-ΔIC3B residues on TM1 (R46G, K47G and K48G (R43G, K44G and K45G in NTSR1 TM86-ΔIC3B; R91G, K92G, K93G in wild-type); red bar), TM4 (R138I, R140T, K142L and K143L (R135I, R137T, K139L and K140L in NTSR1 TM86-ΔIC3B; R183I, R185T, K187L and K188L in wild-type); orange bar) and TM7-H8 (R316N (R311N in NTSR1 TM86-ΔIC3B; R377N in wild-type); green bar) attenuate PIP2 binding, and indicates that the TM4 interface is a preferential binding site over TM1 and TM7-H8 interfaces. The selection of residues for mutations was guided by MD (Extended Data Figure 4) and previous studies wherein binding of a fluorescence-labeled agonist, BODIPY neurotensin, to NTSR1, was screened and used to monitor efficient production, insertion, and folding10.
Extended Data Figure 6. PIP2 binds preferentially to β1AR in an active state and stabilises β1AR coupled to mini-Gs and A2AR-mini-Gs complex.
a, A time course experiment was performed to capture the complex formation of mini-Gs and active β1AR as a function of time. The coupling efficiency (percentage) was calculated from the relative intensity of peaks assigned to the β1AR coupling to mini-Gs at the appropriate lipid-bound state. The plot indicates that mini-Gs coupling is enhanced by PIP2 when more than two lipids are bound to the receptor. Error bars represent standard deviations of the mean from at least three independent experiments. b, Plot of potential of mean force (PMF) for the interaction of mini-Gs with A2AR in the presence of PIP2 (green curve) and PS (grey). The PMF is calculated along a reaction coordinate (Δz) corresponding to the centre-centre separation of the mini-Gs and receptor proteins along the z-axis (normal to the bilayer plane). The interaction of mini-Gs with the A2AR is stabilised in the presence of PIP2 by ~50 ± 10 kJ/mol relative to PS. The error bars on the figure (which are less than 10 kJ/mol) are from bootstrap sampling of the PMFs and thus are the ‘statistical’ errors in estimating the well depth from a given set of simulations/PMF calculation (n=3 independent experiments). A minimum error of <= ~10 kJ/mol is therefore estimated. c, Mass spectra were recorded for a 1:1 equimolar mix of an inactive unliganded β1AR variant E130W and its unmodified active counterpart (co-purified with the agonist isoprenaline) in the presence of PI(4,5)P2. Lipid binding occurred on both receptors but following normalization to account for differences in ionization efficiency a clear preference for PIP2 binding to the active receptor was observed. (Error bars denote standard deviation of the mean between three independent experiments).
Extended Data Figure 7. Detection of nanobody coupling to β1AR.
Mass spectral peaks assigned to the nanobody (Nb6B9) binding to β1AR to form a β1AR·Nb6B9 complex at an equimolar ratio are highlighted (orange) and demonstrate complete complex formation implying a higher affinity of the nanobody than mini-Gs for β1AR (N=3 independent experiments).
Extended Data Figure 8. Structural comparison of class A and class B GPCRs in complex with trimeric Gαβγ complexes.
The PIP2 contacts of the Gαs subunit observed in MD simulation (green spheres) were highlighted on the structures of trimeric G interactions with β2-adrenergic receptor (β2AR) (PDB: 3SN6), the glucagon-like peptide-1 receptor (GLP-1) (PDB: 5VAI), and the calcitonin receptor (CTR) (PDB: 5UZ7). The basic residues on the interface adjacent to the cytoplasmic end of TM4 are also highlighted (purple spheres). Expansion indicates the conserved pattern of PIP2 bridging in class A GPCRs (β2AR and A2AR (Fig. 3e)) both of which have basic residues on TM4 (Lys140 and Arg107/111) which are not observed in class B GPCRs GLP-1R and CTR.
Extended data table 1. Lipidomics anaylsis of purified β1AR.
| Mass (Da) | Lipid ID |
|---|---|
| 824.61 | PC (36:0) |
| 716.52 | PE (34:1) |
| 742.54 | PE (36:2) |
| 714.51 | PE (34:2) |
| 772.59 | PE (38:1) |
| 752.57 | PE (37:4) |
| 793.57 | PG (38:6) |
| 807.50 | PI (32:1) |
| 833.52 | PI (34:2) |
| 865.58 | PI (36:0) |
| 835.53 | PI (34:1) |
| 863.57 | PI (36:1) |
| 861.55 | PI (36:2) |
| 891.60 | PI (38:1) |
| 758.50 | PS (34:2) |
| 760.51 | PS (34:1) |
| 786.53 | PS (36:2) |
| 1019.60 | PIP (42:5) |
| 1343.90 | CL (64:4) |
| 1371.93 | CL (66:4) |
| 1399.96 | CL (68:4) |
Extended data table 2. Simulations run. Lipids were symmetrically distributed between leaflets.
| Name | Length | Bilayer Composition |
|---|---|---|
| NTSR1 | 10 x 5 μs | POPC(95%):PIP2(5%) |
| NTSR1 | 3 x 5 μs | POPC(95%):PS(5%) |
| NTSR1 | 10 x 5 μs | POPC(95%):PS(5%):PIP2(5%) |
| NTSR1 extended | 1 x 100 μs | POPC(95%):PIP2(5%) |
| β1AR (5%) | 10 x 5 μs | POPC(95%):PIP2(5%) |
| β1AR (10%) | 10 x 5 μs | POPC(90%):PIP2(10%) |
| β1AR (S68R, 10%) | 10 x 5 μs | POPC(90%):PIP2(10%) |
| A2AR-mini-Gs | 10 x 8 μs | POPC(95%):PIP2(5%) |
Supplementary Material
Acknowledgments
CVR acknowledges an ERC Advanced Grant 'ENABLE' (Project No. 695511), MRC Programme Grant (MR/N020413/1) and a Wellcome Trust Senior Investigator Award (104633/Z/14/Z). Further support was provided by the MRC (GH), the Royal Society Newton International Fellowship (WS), and the BBSRC (MSPS; BB/L002558/1) and the Wellcome Trust (MSPS; 092970/Z/10/Z). This work used the ARCHER UK National Supercomputing Service (http://www.archer.ac.uk) supported by EPSRC. AP was funded by the Schweizerischer Nationalfonds Grant (31003A_153143). CGT acknowledges the MRC (MC_U105197215), an ERC Advanced Grant EMPSI (339995) and funding from Heptares Therapeutics. We thank Matthias Hillenbrand for kindly providing SF9 cells.
Footnotes
Data availability
All relevant data are available from corresponding authors on request.
Author contributions
H.-Y.Y., K.H.K. and I.L. performed all the mass spectrometry experiments on the GPCR, mini-GS and nanobody. D.W. performed lipidomics. G.H., M.R.H., W.S., and M.S.P.S. performed MD simulations and analysis. P.H. purified the NTSR1 receptor in the apo-state. T.W. purified β1AR, Y.L. purified A2AR and B.C. purified mini-GS. A.P., C.G.T., M.S.P.S. and C.V.R supervised the research and H.-Y.Y. and C.V.R. wrote the paper with contributions from all authors.
Author information
Reprints and permissions information is available at www.nature.com/reprints.
The authors declare competing interests: H.-Y.Y., and I.L. are founders and employees of OMass Technologies. C.V.R is a founder and consultant of OMass Technologies.
References
- 1.Hauser AS, Attwood MM, Rask-Andersen M, Schiöth HB, Gloriam DE. Trends in GPCR drug discovery: new agents, targets and indications. Nat Rev Drug Discov. 2017 doi: 10.1038/nrd.2017.178. [DOI] [PMC free article] [PubMed] [Google Scholar]
- 2.Nehmé R, et al. Mini-G proteins: Novel tools for studying GPCRs in their active conformation. PLOS ONE. 2017;12:e0175642. doi: 10.1371/journal.pone.0175642. [DOI] [PMC free article] [PubMed] [Google Scholar]
- 3.Zocher M, Zhang C, Rasmussen SG, Kobilka BK, Muller DJ. Cholesterol increases kinetic, energetic, and mechanical stability of the human beta2-adrenergic receptor. Proc Natl Acad Sci U S A. 2012;109:E3463–3472. doi: 10.1073/pnas.1210373109. [DOI] [PMC free article] [PubMed] [Google Scholar]
- 4.Dawaliby R, et al. Allosteric regulation of G protein-coupled receptor activity by phospholipids. Nat Chem Biol. 2016;12:35–39. doi: 10.1038/nchembio.1960. [DOI] [PMC free article] [PubMed] [Google Scholar]
- 5.Gault J, et al. High-resolution mass spectrometry of small molecules bound to membrane proteins. Nat Methods. 2016;13:333–336. doi: 10.1038/nmeth.3771. [DOI] [PMC free article] [PubMed] [Google Scholar]
- 6.Yen HY, et al. Ligand binding to a G protein-coupled receptor captured in a mass spectrometer. Sci Adv. 2017;3:e1701016. doi: 10.1126/sciadv.1701016. [DOI] [PMC free article] [PubMed] [Google Scholar]
- 7.Egloff P, et al. Structure of signaling-competent neurotensin receptor 1 obtained by directed evolution in Escherichia coli. Proc Natl Acad Sci U S A. 2014;111:E655–662. doi: 10.1073/pnas.1317903111. [DOI] [PMC free article] [PubMed] [Google Scholar]
- 8.Inagaki S, Ghirlando R, Grisshammer R. Biophysical characterization of membrane proteins in nanodiscs. Methods. 2013;59:287–300. doi: 10.1016/j.ymeth.2012.11.006. [DOI] [PMC free article] [PubMed] [Google Scholar]
- 9.Hedger G, Sansom MSP. Lipid interaction sites on channels, transporters and receptors: Recent insights from molecular dynamics simulations. Biochimica et Biophysica Acta- Biomembranes. 2016;1858:2390–2400. doi: 10.1016/j.bbamem.2016.02.037. [DOI] [PMC free article] [PubMed] [Google Scholar]
- 10.Schlinkmann KM, et al. Critical features for biosynthesis, stability, and functionality of a G protein-coupled receptor uncovered by all-versus-all mutations. Proc Natl Acad Sci U S A. 2012;109:9810–9815. doi: 10.1073/pnas.1202107109. [DOI] [PMC free article] [PubMed] [Google Scholar]
- 11.Carpenter B, Nehmé R, Warne T, Leslie AGW, Tate CG. Structure of the adenosine A2A receptor bound to an engineered G protein. Nature. 2016;536:104–107. doi: 10.1038/nature18966. [DOI] [PMC free article] [PubMed] [Google Scholar]
- 12.Rasmussen SG, et al. Structure of a nanobody-stabilized active state of the beta(2) adrenoceptor. Nature. 2011;469:175–180. doi: 10.1038/nature09648. [DOI] [PMC free article] [PubMed] [Google Scholar]
- 13.Hansen SB, Tao X, MacKinnon R. Structural basis of PIP(2) activation of the classical inward rectifier K(+) channel Kir2.2. Nature. 2011;477:495–498. doi: 10.1038/nature10370. [DOI] [PMC free article] [PubMed] [Google Scholar]
- 14.Roux B. The calculation of the potential of mean force using computer simulations. Comput Phys Commun. 1995;91:275–282. [Google Scholar]
- 15.Domański J, Hedger G, Best RB, Stansfeld PJ, Sansom MSP. Convergence and Sampling in Determining Free Energy Landscapes for Membrane Protein Association. J Phys Chem B. 2017;121:3364–3375. doi: 10.1021/acs.jpcb.6b08445. [DOI] [PMC free article] [PubMed] [Google Scholar]
- 16.Roth CB, Hanson MA, Stevens RC. Stabilization of the β2-adrenergic Receptor 4-3-5 Helix Interface by Mutagenesis of Glu-122(3.41), A Critical Residue in GPCR Structure. J mol biol. 2008;376:1305–1319. doi: 10.1016/j.jmb.2007.12.028. [DOI] [PMC free article] [PubMed] [Google Scholar]
- 17.Che T, et al. Structure of the Nanobody-Stabilized Active State of the Kappa Opioid Receptor. Cell. 2018;172:55–67 e15. doi: 10.1016/j.cell.2017.12.011. [DOI] [PMC free article] [PubMed] [Google Scholar]
- 18.Miller-Gallacher JL, et al. The 2.1 A resolution structure of cyanopindolol-bound beta1-adrenoceptor identifies an intramembrane Na+ ion that stabilises the ligand-free receptor. PLoS One. 2014;9:e92727. doi: 10.1371/journal.pone.0092727. [DOI] [PMC free article] [PubMed] [Google Scholar]
- 19.Injin B, Hee-Jung C. Structural Features of β2 Adrenergic Receptor: Crystal Structures and Beyond. Mol Cells. 2015;38:105–111. doi: 10.14348/molcells.2015.2301. [DOI] [PMC free article] [PubMed] [Google Scholar]
- 20.Venkatakrishnan AJ, et al. Diverse activation pathways in class A GPCRs converge near the G-protein-coupling region. Nature. 2016;536:484–487. doi: 10.1038/nature19107. [DOI] [PMC free article] [PubMed] [Google Scholar]
- 21.Zheng Y, et al. Structure of CC chemokine receptor 2 with orthosteric and allosteric antagonists. Nature. 2016;540:458–461. doi: 10.1038/nature20605. [DOI] [PMC free article] [PubMed] [Google Scholar]
- 22.Liu X, et al. Mechanism of intracellular allosteric beta2AR antagonist revealed by X-ray crystal structure. Nature. 2017;548:480–484. doi: 10.1038/nature23652. [DOI] [PMC free article] [PubMed] [Google Scholar]
- 23.Gavi S, Shumay E, Wang HY, Malbon CC. G-protein-coupled receptors and tyrosine kinases: crossroads in cell signaling and regulation. Trends Endocrinol Metab. 2006;17:48–54. doi: 10.1016/j.tem.2006.01.006. [DOI] [PubMed] [Google Scholar]
- 24.Scott DJ, Kummer L, Egloff P, Bathgate RAD, Plückthun A. Improving the apo-state detergent stability of NTS1 with CHESS for pharmacological and structural studies. Biochimica et Biophysica Acta- Biomembranes. 2014;1838:2817–2824. doi: 10.1016/j.bbamem.2014.07.015. [DOI] [PubMed] [Google Scholar]
- 25.Carpenter B, Tate CG. Engineering a minimal G protein to facilitate crystallisation of G protein-coupled receptors in their active conformation. Protein Eng Des Sel. 2016;29:583–594. doi: 10.1093/protein/gzw049. [DOI] [PMC free article] [PubMed] [Google Scholar]
- 26.Warne T, et al. Structure of a beta1-adrenergic G-protein-coupled receptor. Nature. 2008;454:486–491. doi: 10.1038/nature07101. [DOI] [PMC free article] [PubMed] [Google Scholar]
- 27.Warne T, Serrano-Vega MJ, Tate CG, Schertler GF. Development and crystallization of a minimal thermostabilised G protein-coupled receptor. Protein Expr Purif. 2009;65:204–213. doi: 10.1016/j.pep.2009.01.014. [DOI] [PubMed] [Google Scholar]
- 28.Warne T, Chirnside J, Schertler GF. Expression and purification of truncated, non-glycosylated turkey beta-adrenergic receptors for crystallization. Biochim Biophys Acta. 2003;1610:133–140. doi: 10.1016/s0005-2736(02)00716-2. [DOI] [PubMed] [Google Scholar]
- 29.Warne T, et al. The structural basis for agonist and partial agonist action on a beta(1)-adrenergic receptor. Nature. 2011;469:241–244. doi: 10.1038/nature09746. [DOI] [PMC free article] [PubMed] [Google Scholar]
- 30.Carpenter B, Tate CG. Expression and Purification of Mini G Proteins from Escherichia coli. Bio Protoc. 2017;7 doi: 10.21769/BioProtoc.2235. [DOI] [PMC free article] [PubMed] [Google Scholar]
- 31.Ring AM, et al. Adrenaline-activated structure of beta2-adrenoceptor stabilized by an engineered nanobody. Nature. 2013;502:575–579. doi: 10.1038/nature12572. [DOI] [PMC free article] [PubMed] [Google Scholar]
- 32.Hillenbrand M, Schori C, Schoppe J, Pluckthun A. Comprehensive analysis of heterotrimeric G-protein complex diversity and their interactions with GPCRs in solution. Proc Natl Acad Sci U S A. 2015;112:E1181–1190. doi: 10.1073/pnas.1417573112. [DOI] [PMC free article] [PubMed] [Google Scholar]
- 33.Laganowsky A, Reading E, Hopper JTS, Robinson CV. Mass spectrometry of intact membrane protein complexes. Nat Protocols. 2013;8:639–651. doi: 10.1038/nprot.2013.024. [DOI] [PMC free article] [PubMed] [Google Scholar]
- 34.Chen PS, Toribara TY, Warner H. Microdetermination of Phosphorus. Anal Chem. 1956;28:1756–1758. [Google Scholar]
- 35.Marty MT, et al. Bayesian deconvolution of mass and ion mobility spectra: from binary interactions to polydisperse ensembles. Anal Chem. 2015;87:4370–4376. doi: 10.1021/acs.analchem.5b00140. [DOI] [PMC free article] [PubMed] [Google Scholar]
- 36.Bird SS, Marur VR, Sniatynski MJ, Greenberg HK, Kristal BS. Lipidomics Profiling by High Resolution LC-MS and HCD Fragmentation: Focus on Characterization of Mitochondrial Cardiolipins and Monolysocardiolipins. Anal Chem. 2011;83:940–949. doi: 10.1021/ac102598u. [DOI] [PMC free article] [PubMed] [Google Scholar]
- 37.Bechara C, et al. A subset of annular lipids is linked to the flippase activity of an ABC transporter. Nat Chem. 2015;7:255–262. doi: 10.1038/nchem.2172. [DOI] [PubMed] [Google Scholar]
- 38.Egloff P, Deluigi M, Heine P, Balada S, Pluckthun A. A cleavable ligand column for the rapid isolation of large quantities of homogeneous and functional neurotensin receptor 1 variants from E. coli. Protein Expr Purif. 2015;108:106–114. doi: 10.1016/j.pep.2014.10.006. [DOI] [PubMed] [Google Scholar]
- 39.Sobott F, Hernández H, McCammon MG, Tito MA, Robinson CV. A Tandem Mass Spectrometer for Improved Transmission and Analysis of Large Macromolecular Assemblies. Anal Chem. 2002;74:1402–1407. doi: 10.1021/ac0110552. [DOI] [PubMed] [Google Scholar]
- 40.Šali A, Blundell TL. Comparative Protein Modelling by Satisfaction of Spatial Restraints. J mol biol. 1993;234:779–815. doi: 10.1006/jmbi.1993.1626. [DOI] [PubMed] [Google Scholar]
- 41.Hess B, Kutzner C, van der Spoel D, Lindahl E. GROMACS 4: Algorithms for Highly Efficient, Load-Balanced, and Scalable Molecular Simulation. J Chem Theory Comput. 2008;4:435–447. doi: 10.1021/ct700301q. [DOI] [PubMed] [Google Scholar]
- 42.de Jong DH, et al. Improved Parameters for the Martini Coarse-Grained Protein Force Field. J Chem Theory Comput. 2013;9:687–697. doi: 10.1021/ct300646g. [DOI] [PubMed] [Google Scholar]
- 43.Koldsø H, Shorthouse D, Hélie J, Sansom MSP. Lipid Clustering Correlates with Membrane Curvature as Revealed by Molecular Simulations of Complex Lipid Bilayers. PLoS Comput Biol. 2014;10:e1003911. doi: 10.1371/journal.pcbi.1003911. [DOI] [PMC free article] [PubMed] [Google Scholar]
- 44.Periole X, Cavalli M, Marrink SJ, Ceruso MA. Combining an Elastic Network With a Coarse-Grained Molecular Force Field: Structure, Dynamics, and Intermolecular Recognition. J Chem Theory Comput. 2009;5:2531–2543. doi: 10.1021/ct9002114. [DOI] [PubMed] [Google Scholar]
- 45.Berendsen HJC, Postma JPM, van Gunsteren WF, DiNola A, Haak JR. Molecular dynamics with coupling to an external bath. J Chem Phys. 1984;81:3684–3690. [Google Scholar]
- 46.Tironi IG, Sperb R, Smith PE, van Gunsteren WF. A generalized reaction field method for molecular dynamics simulations. J Chem Phys. 1995;102:5451–5459. [Google Scholar]
- 47.Hess B, Bekker H, Berendsen HJC, Fraaije JGEM. LINCS: A linear constraint solver for molecular simulations. J Comput Chem. 1997;18:1463–1472. [Google Scholar]
- 48.Humphrey W, Dalke A, Schulten K. VMD: visual molecular dynamics. J Mol Graph. 1996;14:33–38. 27–38. doi: 10.1016/0263-7855(96)00018-5. [DOI] [PubMed] [Google Scholar]
- 49.Hedger G, Sansom MSP, Koldsø H. The juxtamembrane regions of human receptor tyrosine kinases exhibit conserved interaction sites with anionic lipids. Sci Rep. 2015;5:9198. doi: 10.1038/srep09198. [DOI] [PMC free article] [PubMed] [Google Scholar]
- 50.Hedger G, Shorthouse D, Koldso H, Sansom MS. Free Energy Landscape of Lipid Interactions with Regulatory Binding Sites on the Transmembrane Domain of the EGF Receptor. J Phys Chem B. 2016;120:8154–8163. doi: 10.1021/acs.jpcb.6b01387. [DOI] [PMC free article] [PubMed] [Google Scholar]
- 51.Hub JS, de Groot BL, van der Spoel D. g_wham—A Free Weighted Histogram Analysis Implementation Including Robust Error and Autocorrelation Estimates. J Chem Theory Comput. 2010;6:3713–3720. [Google Scholar]
- 52.Notredame C, Higgins DG, Heringa J. T-coffee: a novel method for fast and accurate multiple sequence alignment. Thornton J, editor. J Mol Biol. 2000;302:205–217. doi: 10.1006/jmbi.2000.4042. [DOI] [PubMed] [Google Scholar]
- 53.Bond CS, Schuttelkopf AW. ALINE: a WYSIWYG protein-sequence alignment editor for publication-quality alignments. Acta Crystallographica Section D. 2009;65:510–512. doi: 10.1107/S0907444909007835. [DOI] [PubMed] [Google Scholar]
Associated Data
This section collects any data citations, data availability statements, or supplementary materials included in this article.


